
 Login Sign Up


| |||||
 |  | ||||

| 12Stocks.com Market Intelligence |
Best SmallCap Stocks
|
| In a hurry? Small Cap Stock Lists: Performance Trends Table, Stock Charts
Sort Small Cap stocks: Daily, Weekly, Year-to-Date, Market Cap & Trends. Filter Small Cap stocks list by sector: Show all, Tech, Finance, Energy, Staples, Retail, Industrial, Materials, Utilities and HealthCare Filter Small Cap stocks list by size: All Large Medium Small and MicroCap |
| 12Stocks.com Small Cap Stocks Performances & Trends Daily | |||||||||
|
|  The overall Smart Investing & Trading Score is 44 (0-bearish to 100-bullish) which puts Small Cap index in short term neutral trend. The Smart Investing & Trading Score from previous trading session is 58 and hence a deterioration of trend.
| ||||||||
Here are the Smart Investing & Trading Scores of the most requested small cap stocks at 12Stocks.com (click stock name for detailed review):
|


| 12Stocks.com: Investing in Smallcap Index with Stocks | |
|
The following table helps investors and traders sort through current performance and trends (as measured by Smart Investing & Trading Score) of various
stocks in the Smallcap Index. Quick View: Move mouse or cursor over stock symbol (ticker) to view short-term technical chart and over stock name to view long term chart. Click on  to add stock symbol to your watchlist and to add stock symbol to your watchlist and  to view watchlist. Click on any ticker or stock name for detailed market intelligence report for that stock. to view watchlist. Click on any ticker or stock name for detailed market intelligence report for that stock. |
12Stocks.com Performance of Stocks in Smallcap Index
| Ticker | Stock Name | Watchlist | Category | Recent Price | Smart Investing & Trading Score | Change % | YTD Change% |
| CIVI | Civitas Solutions |   | Health Care | 73.72 | 15 | 0.22% | 7.81% |
| EOSE | Eos Energy | | Industrials | 0.71 | 15 | -6.81% | -35.06% |
| NOVA | Sunnova Energy | | Services & Goods | 3.68 | 15 | -6.36% | -75.87% |
| ALLO | Allogene | | Health Care | 2.85 | 15 | -6.25% | -11.21% |
| CDNA | CareDx | | Services & Goods | 7.56 | 15 | -5.26% | -37.00% |
| PLCE | Children s | | Services & Goods | 6.85 | 15 | -4.46% | -70.50% |
| IGMS | IGM Biosciences | | Health Care | 7.62 | 15 | -4.27% | -8.30% |
| FATE | Fate | | Health Care | 3.87 | 15 | -10.00% | 3.48% |
| WOW | WideOpenWest | | Technology | 3.46 | 15 | -0.86% | -14.57% |
| IPSC | Century | | Health Care | 2.98 | 15 | -0.17% | -9.85% |
| SGHC | Super Group | | Services & Goods | 2.99 | 15 | -0.17% | -6.42% |
| PRVA | Privia Health | | Health Care | 17.99 | 15 | -2.73% | -23.87% |
| EVH | Evolent Health | | Technology | 28.32 | 13 | -3.21% | -14.26% |
| BCPC | Balchem | | Materials | 138.50 | 13 | -1.52% | -6.89% |
| QCRH | QCR | | Financials | 57.54 | 12 | -1.76% | -1.46% |
| RXT | Rackspace | | Technology | 1.62 | 12 | -0.61% | -19.20% |
| VICR | Vicor | | Technology | 33.48 | 10 | 4.53% | -25.50% |
| BKKT | Bakkt | | Technology | 0.37 | 10 | 2.39% | -83.47% |
| FENC | Fennec | | Health Care | 9.24 | 10 | 1.87% | -17.65% |
| MGPI | MGP Ingredients | | Consumer Staples | 79.18 | 10 | 1.64% | -19.63% |
| PACB | Pacific Biosciences | | Health Care | 1.38 | 10 | 1.47% | -85.93% |
| OIS | Oil States | | Energy | 5.32 | 10 | 1.33% | -21.65% |
| PAGS | PagSeguro Digital | | Financials | 11.82 | 10 | 1.11% | -5.21% |
| DRQ | Dril-Quip | | Energy | 19.31 | 10 | 1.10% | -17.02% |
| CHGG | Chegg | | Services & Goods | 6.88 | 10 | 1.03% | -39.44% |


| Too many stocks? View smallcap stocks filtered by marketcap & sector |
| Marketcap: All SmallCap Stocks (default-no microcap), Large, Mid-Range, Small |
| Smallcap Sector: Tech, Finance, Energy, Staples, Retail, Industrial, Materials, & Medical |
|
Get the most comprehensive stock market coverage daily at 12Stocks.com ➞ Best Stocks Today ➞ Best Stocks Weekly ➞ Best Stocks Year-to-Date ➞ Best Stocks Trends ➞  Best Stocks Today 12Stocks.com Best Nasdaq Stocks ➞ Best S&P 500 Stocks ➞ Best Tech Stocks ➞ Best Biotech Stocks ➞ |
| Detailed Overview of SmallCap Stocks |
| SmallCap Technical Overview, Leaders & Laggards, Top SmallCap ETF Funds & Detailed SmallCap Stocks List, Charts, Trends & More |
| Smallcap: Technical Analysis, Trends & YTD Performance | |
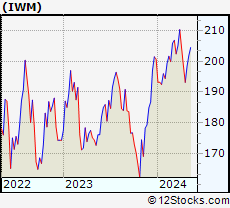
| SmallCap segment as represented by
IWM, an exchange-traded fund [ETF], holds basket of thousands of smallcap stocks from across all major sectors of the US stock market. The smallcap index (contains stocks like Riverbed & Sotheby's) is down by -2.11% and is currently underperforming the overall market by -7.27% year-to-date. Below is a quick view of technical charts and trends: | |
 IWM Weekly Chart |
|
| Long Term Trend: Good | |
| Medium Term Trend: Not Good | |
 IWM Daily Chart |
|
| Short Term Trend: Very Good | |
| Overall Trend Score: 44 | |
| YTD Performance: -2.11% | |
| **Trend Scores & Views Are Only For Educational Purposes And Not For Investing | |
| 12Stocks.com: Top Performing Small Cap Index Stocks | ||||||||||||||||||||||||||||||||||||||||||||||||
 The top performing Small Cap Index stocks year to date are
Now, more recently, over last week, the top performing Small Cap Index stocks on the move are


|
||||||||||||||||||||||||||||||||||||||||||||||||
| 12Stocks.com: Investing in Smallcap Index using Exchange Traded Funds | |
|
The following table shows list of key exchange traded funds (ETF) that
help investors track Smallcap index. The following list also includes leveraged ETF funds that track twice or thrice the daily returns of Smallcap indices. Short or inverse ETF funds move in the opposite direction to the index they track and are useful during market pullbacks or during bear markets. Quick View: Move mouse or cursor over ETF symbol (ticker) to view short-term technical chart and over ETF name to view long term chart. Click on ticker or stock name for detailed view. Click on to add stock symbol to your watchlist and to view watchlist. |
12Stocks.com List of ETFs that track Smallcap Index
| Ticker | ETF Name | Watchlist | Recent Price | Smart Investing & Trading Score | Change % | Week % | Year-to-date % |
| IWM | iShares Russell 2000 | | 196.48 | 44 | -0.61 | 1.73 | -2.11% |
| IJR | iShares Core S&P Small-Cap | | 104.86 | 78 | -0.80 | 1.59 | -3.13% |
| VTWO | Vanguard Russell 2000 ETF | | 79.45 | 63 | -0.60 | 1.75 | -2.03% |
| IWN | iShares Russell 2000 Value | | 150.18 | 68 | -0.73 | 1.62 | -3.32% |
| IWO | iShares Russell 2000 Growth | | 249.86 | 51 | -0.56 | 1.86 | -0.94% |
| IJS | iShares S&P Small-Cap 600 Value | | 96.69 | 60 | -1.04 | 1.13 | -6.19% |
| IJT | iShares S&P Small-Cap 600 Growth | | 125.06 | 63 | -0.25 | 2.33 | -0.06% |
| XSLV | PowerShares S&P SmallCap Low Volatil ETF | | 42.54 | 73 | -0.93 | 0.85 | -3.65% |
| SDD | ProShares UltraShort SmallCap600 | | 19.58 | 42 | 0.46 | -3.74 | 6.26% |
| SBB | ProShares Short SmallCap600 | | 16.50 | 40 | 0.79 | -2.02 | 3.58% |
| SMLV | SPDR SSGA US Small Cap Low Volatil ETF | | 107.33 | 73 | -1.01 | 1.17 | -4.61% |
| SAA | ProShares Ultra SmallCap600 | | 22.66 | 58 | -1.52 | 3.94 | -9.18% |
| 12Stocks.com: Charts, Trends, Fundamental Data and Performances of SmallCap Stocks | |
|
We now take in-depth look at all SmallCap stocks including charts, multi-period performances and overall trends (as measured by Smart Investing & Trading Score). One can sort SmallCap stocks (click link to choose) by Daily, Weekly and by Year-to-Date performances. Also, one can sort by size of the company or by market capitalization. |
| Select Your Default Chart Type: | |||||
| |||||
| Click on stock symbol or name for detailed view. Click on to add stock symbol to your watchlist and to view watchlist. Quick View: Move mouse or cursor over "Daily" to quickly view daily technical stock chart and over "Weekly" to view weekly technical stock chart. | |||||

 | CIVI Civitas Solutions, Inc. |
| Sector: Health Care | |
| SubSector: Long-Term Care Facilities | |
| MarketCap: 625.74 Millions | |
| Recent Price: 73.72 Smart Investing & Trading Score: 15 | |
| Day Percent Change: 0.22% Day Change: 0.16 | |
| Week Change: 1.5% Year-to-date Change: 7.8% | |
| CIVI Links: Profile News Message Board | |
| Charts:- Daily , Weekly | |
| Add CIVI to Watchlist: View: Get Complete CIVI Trend Analysis ➞ | |
 | EOSE Eos Energy Enterprises, Inc. |
| Sector: Industrials | |
| SubSector: Electrical Equipment & Parts | |
| MarketCap: 76627 Millions | |
| Recent Price: 0.71 Smart Investing & Trading Score: 15 | |
| Day Percent Change: -6.81% Day Change: -0.05 | |
| Week Change: -8.39% Year-to-date Change: -35.1% | |
| EOSE Links: Profile News Message Board | |
| Charts:- Daily , Weekly | |
| Add EOSE to Watchlist: View: Get Complete EOSE Trend Analysis ➞ | |
 | NOVA Sunnova Energy International Inc. |
| Sector: Services & Goods | |
| SubSector: Management Services | |
| MarketCap: 1180.45 Millions | |
| Recent Price: 3.68 Smart Investing & Trading Score: 15 | |
| Day Percent Change: -6.36% Day Change: -0.25 | |
| Week Change: -3.16% Year-to-date Change: -75.9% | |
| NOVA Links: Profile News Message Board | |
| Charts:- Daily , Weekly | |
| Add NOVA to Watchlist: View: Get Complete NOVA Trend Analysis ➞ | |
 | ALLO Allogene Therapeutics, Inc. |
| Sector: Health Care | |
| SubSector: Biotechnology | |
| MarketCap: 2858.65 Millions | |
| Recent Price: 2.85 Smart Investing & Trading Score: 15 | |
| Day Percent Change: -6.25% Day Change: -0.19 | |
| Week Change: -18.1% Year-to-date Change: -11.2% | |
| ALLO Links: Profile News Message Board | |
| Charts:- Daily , Weekly | |
| Add ALLO to Watchlist: View: Get Complete ALLO Trend Analysis ➞ | |
 | CDNA CareDx, Inc |
| Sector: Services & Goods | |
| SubSector: Research Services | |
| MarketCap: 828.194 Millions | |
| Recent Price: 7.56 Smart Investing & Trading Score: 15 | |
| Day Percent Change: -5.26% Day Change: -0.42 | |
| Week Change: -9.03% Year-to-date Change: -37.0% | |
| CDNA Links: Profile News Message Board | |
| Charts:- Daily , Weekly | |
| Add CDNA to Watchlist: View: Get Complete CDNA Trend Analysis ➞ | |
 | PLCE The Children s Place, Inc. |
| Sector: Services & Goods | |
| SubSector: Apparel Stores | |
| MarketCap: 303.608 Millions | |
| Recent Price: 6.85 Smart Investing & Trading Score: 15 | |
| Day Percent Change: -4.46% Day Change: -0.32 | |
| Week Change: -16.97% Year-to-date Change: -70.5% | |
| PLCE Links: Profile News Message Board | |
| Charts:- Daily , Weekly | |
| Add PLCE to Watchlist: View: Get Complete PLCE Trend Analysis ➞ | |
 | IGMS IGM Biosciences, Inc. |
| Sector: Health Care | |
| SubSector: Biotechnology | |
| MarketCap: 2000.05 Millions | |
| Recent Price: 7.62 Smart Investing & Trading Score: 15 | |
| Day Percent Change: -4.27% Day Change: -0.34 | |
| Week Change: 5.83% Year-to-date Change: -8.3% | |
| IGMS Links: Profile News Message Board | |
| Charts:- Daily , Weekly | |
| Add IGMS to Watchlist: View: Get Complete IGMS Trend Analysis ➞ | |
 | FATE Fate Therapeutics, Inc. |
| Sector: Health Care | |
| SubSector: Biotechnology | |
| MarketCap: 2022.45 Millions | |
| Recent Price: 3.87 Smart Investing & Trading Score: 15 | |
| Day Percent Change: -10.00% Day Change: -0.43 | |
| Week Change: -19.21% Year-to-date Change: 3.5% | |
| FATE Links: Profile News Message Board | |
| Charts:- Daily , Weekly | |
| Add FATE to Watchlist: View: Get Complete FATE Trend Analysis ➞ | |
 | WOW WideOpenWest, Inc. |
| Sector: Technology | |
| SubSector: CATV Systems | |
| MarketCap: 328.932 Millions | |
| Recent Price: 3.46 Smart Investing & Trading Score: 15 | |
| Day Percent Change: -0.86% Day Change: -0.03 | |
| Week Change: -1.7% Year-to-date Change: -14.6% | |
| WOW Links: Profile News Message Board | |
| Charts:- Daily , Weekly | |
| Add WOW to Watchlist: View: Get Complete WOW Trend Analysis ➞ | |
 | IPSC Century Therapeutics, Inc. |
| Sector: Health Care | |
| SubSector: Biotechnology | |
| MarketCap: 187 Millions | |
| Recent Price: 2.98 Smart Investing & Trading Score: 15 | |
| Day Percent Change: -0.17% Day Change: 0.00 | |
| Week Change: -3.72% Year-to-date Change: -9.9% | |
| IPSC Links: Profile News Message Board | |
| Charts:- Daily , Weekly | |
| Add IPSC to Watchlist: View: Get Complete IPSC Trend Analysis ➞ | |
 | SGHC Super Group (SGHC) Limited |
| Sector: Services & Goods | |
| SubSector: Gambling | |
| MarketCap: 1390 Millions | |
| Recent Price: 2.99 Smart Investing & Trading Score: 15 | |
| Day Percent Change: -0.17% Day Change: 0.00 | |
| Week Change: -3.55% Year-to-date Change: -6.4% | |
| SGHC Links: Profile News Message Board | |
| Charts:- Daily , Weekly | |
| Add SGHC to Watchlist: View: Get Complete SGHC Trend Analysis ➞ | |
 | PRVA Privia Health Group, Inc. |
| Sector: Health Care | |
| SubSector: Health Information Services | |
| MarketCap: 3130 Millions | |
| Recent Price: 17.99 Smart Investing & Trading Score: 15 | |
| Day Percent Change: -2.73% Day Change: -0.51 | |
| Week Change: -0.5% Year-to-date Change: -23.9% | |
| PRVA Links: Profile News Message Board | |
| Charts:- Daily , Weekly | |
| Add PRVA to Watchlist: View: Get Complete PRVA Trend Analysis ➞ | |
 | EVH Evolent Health, Inc. |
| Sector: Technology | |
| SubSector: Healthcare Information Services | |
| MarketCap: 486.755 Millions | |
| Recent Price: 28.32 Smart Investing & Trading Score: 13 | |
| Day Percent Change: -3.21% Day Change: -0.94 | |
| Week Change: -4.03% Year-to-date Change: -14.3% | |
| EVH Links: Profile News Message Board | |
| Charts:- Daily , Weekly | |
| Add EVH to Watchlist: View: Get Complete EVH Trend Analysis ➞ | |
 | BCPC Balchem Corporation |
| Sector: Materials | |
| SubSector: Specialty Chemicals | |
| MarketCap: 3330.17 Millions | |
| Recent Price: 138.50 Smart Investing & Trading Score: 13 | |
| Day Percent Change: -1.52% Day Change: -2.14 | |
| Week Change: -3.47% Year-to-date Change: -6.9% | |
| BCPC Links: Profile News Message Board | |
| Charts:- Daily , Weekly | |
| Add BCPC to Watchlist: View: Get Complete BCPC Trend Analysis ➞ | |
 | QCRH QCR Holdings, Inc. |
| Sector: Financials | |
| SubSector: Regional - Southwest Banks | |
| MarketCap: 465.765 Millions | |
| Recent Price: 57.54 Smart Investing & Trading Score: 12 | |
| Day Percent Change: -1.76% Day Change: -1.03 | |
| Week Change: 0.31% Year-to-date Change: -1.5% | |
| QCRH Links: Profile News Message Board | |
| Charts:- Daily , Weekly | |
| Add QCRH to Watchlist: View: Get Complete QCRH Trend Analysis ➞ | |
 | RXT Rackspace Technology, Inc. |
| Sector: Technology | |
| SubSector: Software Infrastructure | |
| MarketCap: 40287 Millions | |
| Recent Price: 1.62 Smart Investing & Trading Score: 12 | |
| Day Percent Change: -0.61% Day Change: -0.01 | |
| Week Change: 2.86% Year-to-date Change: -19.2% | |
| RXT Links: Profile News Message Board | |
| Charts:- Daily , Weekly | |
| Add RXT to Watchlist: View: Get Complete RXT Trend Analysis ➞ | |
 | VICR Vicor Corporation |
| Sector: Technology | |
| SubSector: Diversified Electronics | |
| MarketCap: 1526.76 Millions | |
| Recent Price: 33.48 Smart Investing & Trading Score: 10 | |
| Day Percent Change: 4.53% Day Change: 1.45 | |
| Week Change: -1.15% Year-to-date Change: -25.5% | |
| VICR Links: Profile News Message Board | |
| Charts:- Daily , Weekly | |
| Add VICR to Watchlist: View: Get Complete VICR Trend Analysis ➞ | |
 | BKKT Bakkt Holdings, Inc. |
| Sector: Technology | |
| SubSector: Software - Infrastructure | |
| MarketCap: 335 Millions | |
| Recent Price: 0.37 Smart Investing & Trading Score: 10 | |
| Day Percent Change: 2.39% Day Change: 0.01 | |
| Week Change: -7.32% Year-to-date Change: -83.5% | |
| BKKT Links: Profile News Message Board | |
| Charts:- Daily , Weekly | |
| Add BKKT to Watchlist: View: Get Complete BKKT Trend Analysis ➞ | |
 | FENC Fennec Pharmaceuticals Inc. |
| Sector: Health Care | |
| SubSector: Biotechnology | |
| MarketCap: 126.785 Millions | |
| Recent Price: 9.24 Smart Investing & Trading Score: 10 | |
| Day Percent Change: 1.87% Day Change: 0.17 | |
| Week Change: -0.86% Year-to-date Change: -17.7% | |
| FENC Links: Profile News Message Board | |
| Charts:- Daily , Weekly | |
| Add FENC to Watchlist: View: Get Complete FENC Trend Analysis ➞ | |
 | MGPI MGP Ingredients, Inc. |
| Sector: Consumer Staples | |
| SubSector: Beverages - Wineries & Distillers | |
| MarketCap: 502.635 Millions | |
| Recent Price: 79.18 Smart Investing & Trading Score: 10 | |
| Day Percent Change: 1.64% Day Change: 1.28 | |
| Week Change: -0.71% Year-to-date Change: -19.6% | |
| MGPI Links: Profile News Message Board | |
| Charts:- Daily , Weekly | |
| Add MGPI to Watchlist: View: Get Complete MGPI Trend Analysis ➞ | |
 | PACB Pacific Biosciences of California, Inc. |
| Sector: Health Care | |
| SubSector: Biotechnology | |
| MarketCap: 470.685 Millions | |
| Recent Price: 1.38 Smart Investing & Trading Score: 10 | |
| Day Percent Change: 1.47% Day Change: 0.02 | |
| Week Change: -10.97% Year-to-date Change: -85.9% | |
| PACB Links: Profile News Message Board | |
| Charts:- Daily , Weekly | |
| Add PACB to Watchlist: View: Get Complete PACB Trend Analysis ➞ | |
 | OIS Oil States International, Inc. |
| Sector: Energy | |
| SubSector: Oil & Gas Equipment & Services | |
| MarketCap: 131.061 Millions | |
| Recent Price: 5.32 Smart Investing & Trading Score: 10 | |
| Day Percent Change: 1.33% Day Change: 0.07 | |
| Week Change: -4.32% Year-to-date Change: -21.7% | |
| OIS Links: Profile News Message Board | |
| Charts:- Daily , Weekly | |
| Add OIS to Watchlist: View: Get Complete OIS Trend Analysis ➞ | |
 | PAGS PagSeguro Digital Ltd. |
| Sector: Financials | |
| SubSector: Credit Services | |
| MarketCap: 6500.78 Millions | |
| Recent Price: 11.82 Smart Investing & Trading Score: 10 | |
| Day Percent Change: 1.11% Day Change: 0.13 | |
| Week Change: 2.96% Year-to-date Change: -5.2% | |
| PAGS Links: Profile News Message Board | |
| Charts:- Daily , Weekly | |
| Add PAGS to Watchlist: View: Get Complete PAGS Trend Analysis ➞ | |
 | DRQ Dril-Quip, Inc. |
| Sector: Energy | |
| SubSector: Oil & Gas Equipment & Services | |
| MarketCap: 1211.61 Millions | |
| Recent Price: 19.31 Smart Investing & Trading Score: 10 | |
| Day Percent Change: 1.10% Day Change: 0.21 | |
| Week Change: -1.78% Year-to-date Change: -17.0% | |
| DRQ Links: Profile News Message Board | |
| Charts:- Daily , Weekly | |
| Add DRQ to Watchlist: View: Get Complete DRQ Trend Analysis ➞ | |
 | CHGG Chegg, Inc. |
| Sector: Services & Goods | |
| SubSector: Education & Training Services | |
| MarketCap: 3606.86 Millions | |
| Recent Price: 6.88 Smart Investing & Trading Score: 10 | |
| Day Percent Change: 1.03% Day Change: 0.07 | |
| Week Change: -2.96% Year-to-date Change: -39.4% | |
| CHGG Links: Profile News Message Board | |
| Charts:- Daily , Weekly | |
| Add CHGG to Watchlist: View: Get Complete CHGG Trend Analysis ➞ | |
| Too many stocks? View smallcap stocks filtered by marketcap & sector |
| Marketcap: All SmallCap Stocks (default-no microcap), Large, Mid-Range, Small & MicroCap |
| Sector: Tech, Finance, Energy, Staples, Retail, Industrial, Materials, Utilities & Medical |
|
Best Stocks Today 12Stocks.com |
© 2024 12Stocks.com Terms & Conditions Privacy Contact Us
All Information Provided Only For Education And Not To Be Used For Investing or Trading. See Terms & Conditions


One More Thing ... Get Best Stocks Delivered Daily!
Never Ever Miss A Move With Our Top Ten Stocks Lists
Find Best Stocks In Any Market - Bull or Bear Market
Take A Peek At Our Top Ten Stocks Lists: Daily, Weekly, Year-to-Date & Top Trends
Find Best Stocks In Any Market - Bull or Bear Market
Take A Peek At Our Top Ten Stocks Lists: Daily, Weekly, Year-to-Date & Top Trends
Smallcap Stocks With Best Up Trends [0-bearish to 100-bullish]: B. Riley[100], Central Pacific[100], California Water[100], Cricut [100], Carpenter [100], Haemonetics [100], Sanmina [100], Trustmark [100], Comstock Resources[100], EchoStar [100], Mueller Industries[100]
Best Smallcap Stocks Year-to-Date:
CareMax [490.72%], Janux [338.34%], Viking [270.02%], Alpine Immune[239.52%], Longboard [218%], Super Micro[177%], Arcutis Bio[166.56%], Avidity Biosciences[159.79%], Vera [149.94%], Hippo [128.87%], Stoke [122.15%] Best Smallcap Stocks This Week:
Matterport [168.97%], B. Riley[73.54%], Impinj [33.73%], ProKidney [32.84%], Seres [32.65%], Riot Blockchain[32.64%], Ribbon [25.58%], Cullinan Oncology[22.92%], P.A.M. Transportation[22.85%], NuScale Power[21.44%], Hibbett Sports[21.03%] Best Smallcap Stocks Daily:
Impinj [28.65%], P.A.M. Transportation[17.95%], B. Riley[16.61%], Strategic Education[16.28%], OptiNose [14.56%], JELD-WEN Holding[11.54%], Sonic Automotive[10.86%], Intevac [10.54%], SiTime [8.84%], Noodles & [8.08%], ProKidney [7.75%]