
 Login Sign Up


| |||||
 |  | ||||

| 12Stocks.com Market Intelligence |
Best Mexico Stocks
|
|
| Quick Read: Top Mexico Stocks By Performances & Trends: Daily, Weekly, Year-to-Date, Market Cap (Size) & Technical Trends | |||
| Best Mexico Views: Quick Browse View, Summary & Slide Show | |||
| 12Stocks.com Mexico Stocks Performances & Trends Daily | |||||||||
|
|  The overall market intelligence score is 90 (0-bearish to 100-bullish) which puts Mexico index in short term bullish trend. The market intelligence score from previous trading session is 100 and hence a deterioration of trend.
| ||||||||
| Here are the market intelligence trend scores of the most requested Mexico stocks at 12Stocks.com (click stock name for detailed review): | |
| Scroll down this page for most comprehensive review of Mexico stocks by performance, trends, technical analysis, charts, fund plays & more | |


| 12Stocks.com: Top Performing Mexico Index Stocks | ||||||||||||||||||||||||||||||||||||||||||||||||
 The top performing Mexico Index stocks year to date are
Now, more recently, over last week, the top performing Mexico Index stocks on the move are


|
||||||||||||||||||||||||||||||||||||||||||||||||
| 12Stocks.com: Investing in Mexico Index with Stocks | |
|
The following table helps investors and traders sort through current performance and trends (as measured by market intelligence score) of various
stocks in the Mexico Index. Quick View: Move mouse or cursor over stock symbol (ticker) to view short-term technical chart and over stock name to view long term chart. Click on  to add stock symbol to your watchlist and to add stock symbol to your watchlist and  to view watchlist. Click on any ticker or stock name for detailed market intelligence report for that stock. to view watchlist. Click on any ticker or stock name for detailed market intelligence report for that stock. |
12Stocks.com Performance of Stocks in Mexico Index
| Ticker | Stock Name | Watchlist | Category | Recent Price | Market Intelligence Score | Change % | YTD Change% |
| AMX | America Movil |   | Technology | 20.50 | 90 | 0.44% | 44.43% |
| FMX | Fomento Economico | | Consumer Staples | 93.03 | 70 | 1.87% | 14.30% |
| CX | Cemex S.A.B. | | Materials | 9.43 | 60 | -1.26% | 66.85% |
| PAC | Grupo Aeroportuario | | Industrials | 249.15 | 50 | 0.88% | 39.61% |
| BSMX | Grupo Financiero | | Financials | 75.54 | 70 | 0.32% | 0.00% |
| ASR | Grupo Aeroportuario | | Industrials | 337.26 | 50 | -1.73% | 39.90% |
| SIM | Grupo Simec | | Materials | 28.06 | 90 | 12.26% | 4.76% |
| OMAB | Grupo Aeroportuario | | Industrials | 106.77 | 40 | 1.18% | 55.39% |
| KOF | Coca-Cola Femsa | | Consumer Staples | 84.41 | 20 | -2.01% | 10.80% |
| VIST | Vista Energy | | Energy | 36.67 | 50 | 0.05% | -34.40% |
| VTMX | Corporacion Inmobiliaria | | Financials | 26.99 | 63 | -0.21% | 12.64% |
| IBA | Industrias Bachoco | | Consumer Staples | 84.44 | 100 | 1.22% | 0.00% |
| TV | Grupo Televisa | | Technology | 2.83 | 70 | -3.08% | 69.45% |
| VLRS | Controladora Vuela | | Industrials | 6.59 | 100 | 2.65% | -10.95% |
| DDMX | DD3 Acquisition | | Transports | 9.42 | 10 | 0.00% | 0.00% |
| To view more stocks, click on Next / Previous arrows or select different range: 0 - 25 | ||
 | Click To Change The Sort Order: By Market Cap or Company Size Performance: Year-to-date, Week and Day |  |
| Detailed Overview Of Mexico Stocks |
| Mexico Technical Overview, Leaders & Laggards, Top Mexico ETF Funds & Detailed Mexico Stocks List, Charts, Trends & More |
| Mexico: Technical Analysis, Trends & YTD Performance | |
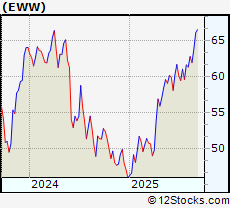
 EWW Weekly Chart |
|
| Long Term Trend: Very Good | |
| Medium Term Trend: Very Good | |
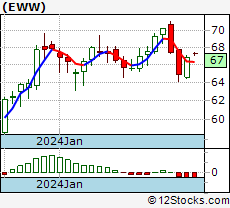
 EWW Daily Chart |
|
| Short Term Trend: Good | |
| Overall Trend Score: 90 | |
| YTD Performance: 41.9355% | |
| **Trend Scores & Views Are Only For Educational Purposes And Not For Investing | |
| 12Stocks.com: Investing in Mexico Index using Exchange Traded Funds | |
|
The following table shows list of key exchange traded funds (ETF) that
help investors play Mexico stock market. For detailed view, check out our ETF Funds section of our website. Quick View: Move mouse or cursor over ETF symbol (ticker) to view short-term technical chart and over ETF name to view long term chart. Click on ticker or stock name for detailed view. Click on to add stock symbol to your watchlist and to view watchlist. |
12Stocks.com List of ETFs that track Mexico Index
| Ticker | ETF Name | Watchlist | Recent Price | Market Intelligence Score | Change % | Week % | Year-to-date % |
| HEWW | Currency Hedged | | 18.09 | 20 | 0 | 0 | 0% |
| SMK | Short Mexico | | 31.96 | 50 | -1.99325 | -0.745342 | 0% |
| UMX | Mexico IMI | | 59.39 | 80 | -3.43089 | 192.13 | 0% |
| 12Stocks.com: Charts, Trends, Fundamental Data and Performances of Mexico Stocks | |
|
We now take in-depth look at all Mexico stocks including charts, multi-period performances and overall trends (as measured by market intelligence score). One can sort Mexico stocks (click link to choose) by Daily, Weekly and by Year-to-Date performances. Also, one can sort by size of the company or by market capitalization. |
| Select Your Default Chart Type: | |||||
| |||||
| Click on stock symbol or name for detailed view. Click on to add stock symbol to your watchlist and to view watchlist. Quick View: Move mouse or cursor over "Daily" to quickly view daily technical stock chart and over "Weekly" to view weekly technical stock chart. | |||||
 | AMX America Movil S.A.B.DE C.V. ADR |
| Sector: Technology | |
| SubSector: Telecom Services | |
| MarketCap: 59926.6 Millions | |
| Recent Price: 20.50 Market Intelligence Score: 90 | |
| Day Percent Change: 0.44096% Day Change: 0.32 | |
| Week Change: 3.74494% Year-to-date Change: 44.4% | |
| AMX Links: Profile News Message Board | |
| Charts:- Daily , Weekly | |
| Add AMX to Watchlist: View: Get Complete AMX Trend Analysis ➞ | |
 | FMX Fomento Economico Mexicano S.A.B. de C.V. ADR |
| Sector: Consumer Staples | |
| SubSector: Beverages - Brewers | |
| MarketCap: 17575.6 Millions | |
| Recent Price: 93.03 Market Intelligence Score: 70 | |
| Day Percent Change: 1.87254% Day Change: 0.77 | |
| Week Change: 6.89417% Year-to-date Change: 14.3% | |
| FMX Links: Profile News Message Board | |
| Charts:- Daily , Weekly | |
| Add FMX to Watchlist: View: Get Complete FMX Trend Analysis ➞ | |
 | CX Cemex S.A.B. De C.V. ADR |
| Sector: Materials | |
| SubSector: Building Materials | |
| MarketCap: 14210 Millions | |
| Recent Price: 9.43 Market Intelligence Score: 60 | |
| Day Percent Change: -1.25654% Day Change: 0.14 | |
| Week Change: 0.425985% Year-to-date Change: 66.8% | |
| CX Links: Profile News Message Board | |
| Charts:- Daily , Weekly | |
| Add CX to Watchlist: View: Get Complete CX Trend Analysis ➞ | |
 | PAC Grupo Aeroportuario Del Pacifico SAB de CV ADR |
| Sector: Industrials | |
| SubSector: Airports & Air Services | |
| MarketCap: 10734.5 Millions | |
| Recent Price: 249.15 Market Intelligence Score: 50 | |
| Day Percent Change: 0.882698% Day Change: -2.74 | |
| Week Change: -0.816083% Year-to-date Change: 39.6% | |
| PAC Links: Profile News Message Board | |
| Charts:- Daily , Weekly | |
| Add PAC to Watchlist: View: Get Complete PAC Trend Analysis ➞ | |
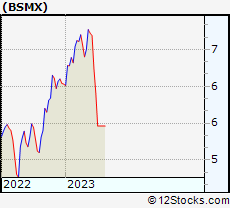 | BSMX Grupo Financiero Santander Mexico, S.A.B. de C.V. |
| Sector: Financials | |
| SubSector: Foreign Regional Banks | |
| MarketCap: 10616.2 Millions | |
| Recent Price: 75.54 Market Intelligence Score: 70 | |
| Day Percent Change: 0.318725% Day Change: -9999 | |
| Week Change: 1283.52% Year-to-date Change: 0.0% | |
| BSMX Links: Profile News Message Board | |
| Charts:- Daily , Weekly | |
| Add BSMX to Watchlist: View: Get Complete BSMX Trend Analysis ➞ | |
 | ASR Grupo Aeroportuario Del Sureste S.A. ADR |
| Sector: Industrials | |
| SubSector: Airports & Air Services | |
| MarketCap: 9391.68 Millions | |
| Recent Price: 337.26 Market Intelligence Score: 50 | |
| Day Percent Change: -1.72791% Day Change: 8.43 | |
| Week Change: -0.527946% Year-to-date Change: 39.9% | |
| ASR Links: Profile News Message Board | |
| Charts:- Daily , Weekly | |
| Add ASR to Watchlist: View: Get Complete ASR Trend Analysis ➞ | |
 | SIM Grupo Simec S.A.B. de C.V. ADR |
| Sector: Materials | |
| SubSector: Steel | |
| MarketCap: 4635.25 Millions | |
| Recent Price: 28.06 Market Intelligence Score: 90 | |
| Day Percent Change: 12.2572% Day Change: -9999 | |
| Week Change: 0.987046% Year-to-date Change: 4.8% | |
| SIM Links: Profile News Message Board | |
| Charts:- Daily , Weekly | |
| Add SIM to Watchlist: View: Get Complete SIM Trend Analysis ➞ | |
 | OMAB Grupo Aeroportuario del Centro Norte S.A.B de C.V. ADR |
| Sector: Industrials | |
| SubSector: Airports & Air Services | |
| MarketCap: 4432.91 Millions | |
| Recent Price: 106.77 Market Intelligence Score: 40 | |
| Day Percent Change: 1.17502% Day Change: -0.27 | |
| Week Change: -0.447552% Year-to-date Change: 55.4% | |
| OMAB Links: Profile News Message Board | |
| Charts:- Daily , Weekly | |
| Add OMAB to Watchlist: View: Get Complete OMAB Trend Analysis ➞ | |
 | KOF Coca-Cola Femsa S.A.B. DE C.V. ADR |
| Sector: Consumer Staples | |
| SubSector: Beverages - Non-Alcoholic | |
| MarketCap: 4385.42 Millions | |
| Recent Price: 84.41 Market Intelligence Score: 20 | |
| Day Percent Change: -2.00836% Day Change: 2 | |
| Week Change: 0.655855% Year-to-date Change: 10.8% | |
| KOF Links: Profile News Message Board | |
| Charts:- Daily , Weekly | |
| Add KOF to Watchlist: View: Get Complete KOF Trend Analysis ➞ | |
 | VIST Vista Energy S.A.B. de C.V ADR |
| Sector: Energy | |
| SubSector: Oil & Gas E&P | |
| MarketCap: 3625.22 Millions | |
| Recent Price: 36.67 Market Intelligence Score: 50 | |
| Day Percent Change: 0.0545703% Day Change: 0.26 | |
| Week Change: 2.86115% Year-to-date Change: -34.4% | |
| VIST Links: Profile News Message Board | |
| Charts:- Daily , Weekly | |
| Add VIST to Watchlist: View: Get Complete VIST Trend Analysis ➞ | |
 | VTMX Corporacion Inmobiliaria Vesta Sab ADR |
| Sector: Financials | |
| SubSector: Real Estate - Development | |
| MarketCap: 2490.41 Millions | |
| Recent Price: 26.99 Market Intelligence Score: 63 | |
| Day Percent Change: -0.21% Day Change: -0.06 | |
| Week Change: -1.3% Year-to-date Change: 12.6% | |
| VTMX Links: Profile News Message Board | |
| Charts:- Daily , Weekly | |
| Add VTMX to Watchlist: View: Get Complete VTMX Trend Analysis ➞ | |
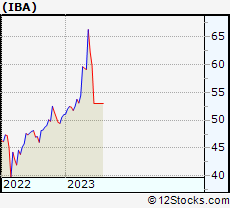 | IBA Industrias Bachoco, S.A.B. de C.V. |
| Sector: Consumer Staples | |
| SubSector: Farm Products | |
| MarketCap: 1547.87 Millions | |
| Recent Price: 84.44 Market Intelligence Score: 100 | |
| Day Percent Change: 1.22273% Day Change: -9999 | |
| Week Change: 59.3208% Year-to-date Change: 0.0% | |
| IBA Links: Profile News Message Board | |
| Charts:- Daily , Weekly | |
| Add IBA to Watchlist: View: Get Complete IBA Trend Analysis ➞ | |
 | TV Grupo Televisa SAB ADR |
| Sector: Technology | |
| SubSector: Telecom Services | |
| MarketCap: 1281.93 Millions | |
| Recent Price: 2.83 Market Intelligence Score: 70 | |
| Day Percent Change: -3.08219% Day Change: -0.01 | |
| Week Change: 1.07143% Year-to-date Change: 69.5% | |
| TV Links: Profile News Message Board | |
| Charts:- Daily , Weekly | |
| Add TV to Watchlist: View: Get Complete TV Trend Analysis ➞ | |
 | VLRS Controladora Vuela Cia De Aviacion ADR |
| Sector: Industrials | |
| SubSector: Airlines | |
| MarketCap: 706.64 Millions | |
| Recent Price: 6.59 Market Intelligence Score: 100 | |
| Day Percent Change: 2.64797% Day Change: -0.09 | |
| Week Change: 11.3176% Year-to-date Change: -10.9% | |
| VLRS Links: Profile News Message Board | |
| Charts:- Daily , Weekly | |
| Add VLRS to Watchlist: View: Get Complete VLRS Trend Analysis ➞ | |
 | DDMX DD3 Acquisition Corp. |
| Sector: Transports | |
| SubSector: Trucking | |
| MarketCap: 65.7915 Millions | |
| Recent Price: 9.42 Market Intelligence Score: 10 | |
| Day Percent Change: 0% Day Change: -9999 | |
| Week Change: -4.84848% Year-to-date Change: 0.0% | |
| DDMX Links: Profile News Message Board | |
| Charts:- Daily , Weekly | |
| Add DDMX to Watchlist: View: Get Complete DDMX Trend Analysis ➞ | |
| To view more stocks, click on Next / Previous arrows or select different range: 0 - 25 | ||
| Click To Change The Sort Order: By Market Cap or Company Size Performance: Year-to-date, Week and Day | |
| Select Chart Type: | ||
 Best Stocks Today 12Stocks.com |
© 2025 12Stocks.com Terms & Conditions Privacy Contact Us
All Information Provided Only For Education And Not To Be Used For Investing or Trading. See Terms & Conditions


One More Thing ... Get Best Stocks Delivered Daily!
Never Ever Miss A Move With Our Top Ten Stocks Lists
Find Best Stocks In Any Market - Bull or Bear Market
Take A Peek At Our Top Ten Stocks Lists: Daily, Weekly, Year-to-Date & Top Trends
Find Best Stocks In Any Market - Bull or Bear Market
Take A Peek At Our Top Ten Stocks Lists: Daily, Weekly, Year-to-Date & Top Trends
Mexico Stocks With Best Up Trends [0-bearish to 100-bullish]: Controladora Vuela[100], Industrias Bachoco[100], Grupo Simec[90], America Movil[90], Fomento Economico[70], Grupo Financiero[70], Grupo Televisa[70], Corporacion Inmobiliaria[63], Cemex S.A.B.[60], Grupo Aeroportuario[50], Vista Energy[50]
Best Mexico Stocks Year-to-Date:
Grupo Televisa[69.4509%], Cemex S.A.B.[66.8465%], Grupo Aeroportuario[55.3918%], America Movil[44.4333%], Grupo Aeroportuario[39.8966%], Grupo Aeroportuario[39.608%], Fomento Economico[14.298%], Corporacion Inmobiliaria[12.64%], Coca-Cola Femsa[10.7974%], Grupo Simec[4.75663%], Grupo Financiero[0%] Best Mexico Stocks This Week:
Grupo Financiero[1283.52%], Industrias Bachoco[59.3208%], Controladora Vuela[11.3176%], Fomento Economico[6.89417%], America Movil[3.74494%], Vista Energy[2.86115%], Grupo Televisa[1.07143%], Grupo Simec[0.987046%], Coca-Cola Femsa[0.655855%], Cemex S.A.B.[0.425985%], Grupo Aeroportuario[-0.447552%] Best Mexico Stocks Daily:
Grupo Simec[12.2572%], Controladora Vuela[2.64797%], Fomento Economico[1.87254%], Industrias Bachoco[1.22273%], Grupo Aeroportuario[1.17502%], Grupo Aeroportuario[0.882698%], America Movil[0.44096%], Grupo Financiero[0.318725%], Vista Energy[0.0545703%], Corporacion Inmobiliaria[-0.21%], Cemex S.A.B.[-1.25654%]