
 Login Sign Up


| |||||
 |  | ||||

| 12Stocks.com Market Intelligence |
Best Consumer Services Stocks
| In a hurry? Services & Goods Stocks: Performance Trends Table, Stock Charts
Sort Consumer Services: Daily, Weekly, Year-to-Date, Market Cap & Trends. Filter Services & Goods stocks list by size: All Large Mid-Range Small |
| 12Stocks.com Consumer Services Stocks Performances & Trends Daily | |||||||||
|
|  The overall Smart Investing & Trading Score is 90 (0-bearish to 100-bullish) which puts Consumer Services sector in short term bullish trend. The Smart Investing & Trading Score from previous trading session is 100 and hence a deterioration of trend.
| ||||||||
Here are the Smart Investing & Trading Scores of the most requested Consumer Services stocks at 12Stocks.com (click stock name for detailed review):
|


| Consider signing up for our daily 12Stocks.com "Best Stocks Newsletter". You will never ever miss a big stock move again! |
| 12Stocks.com: Investing in Consumer Services sector with Stocks | |
|
The following table helps investors and traders sort through current performance and trends (as measured by Smart Investing & Trading Score) of various
stocks in the Consumer Services sector. Quick View: Move mouse or cursor over stock symbol (ticker) to view short-term Technical chart and over stock name to view long term chart. Click on  to add stock symbol to your watchlist and to add stock symbol to your watchlist and  to view watchlist. Click on any ticker or stock name for detailed market intelligence report for that stock. to view watchlist. Click on any ticker or stock name for detailed market intelligence report for that stock. |
12Stocks.com Performance of Stocks in Consumer Services Sector
| Ticker | Stock Name | Watchlist | Category | Recent Price | Smart Investing & Trading Score | Change % | YTD Change% |
| AMZN | Amazon.com |   | Internet Retail | 229.32 | 40 | -0.99% | 4.13% |
| TSLA | Tesla | | Auto Manufacturers | 427.72 | 100 | 0.44% | 12.77% |
| HD | Home Depot | | Home Improvement Retail | 416.73 | 50 | -0.06% | 8.63% |
| BABA | Alibaba | | Internet Retail | 162.35 | 70 | -2.30% | 92.63% |
| TM | Toyota Motor | | Auto Manufacturers | 201.38 | 100 | 1.24% | 6.33% |
| MCD | McDonald's Corp | | Restaurants | 300.57 | 20 | -1.44% | 3.93% |
| BKNG | Booking | | Travel Services | 5485.19 | 20 | -1.23% | 11.79% |
| PDD | PDD | | Internet Retail | 133.76 | 100 | -0.82% | 38.05% |
| TJX | TJX | | Apparel Retail | 139.84 | 50 | -0.14% | 16.15% |
| LOW | Lowe's Cos | | Home Improvement Retail | 268.15 | 50 | 0.07% | 10.20% |
| MELI | MercadoLibre | | Internet Retail | 2487.78 | 70 | 1.69% | 40.95% |
| NKE | Nike | | Footwear & Accessories | 72.33 | 30 | 0.03% | -0.67% |
| DASH | DoorDash | | Internet Retail | 263.72 | 90 | 1.72% | 54.54% |
| SE | Sea | | Internet Retail | 186.89 | 30 | -1.15% | 78.21% |
| DADA | Dada Nexus | | Internet Retail | 1.96 | 10 | -1.26% | 47.37% |
| SBUX | Starbucks Corp | | Restaurants | 82.94 | 20 | -0.34% | -8.89% |
| RCL | Royal Caribbean | | Travel Services | 322.74 | 20 | -0.10% | 41.81% |
| ORLY | O'Reilly Automotive | | Auto Parts | 104.98 | 40 | 0.41% | 32.58% |
| RACE | Ferrari N.V | | Auto Manufacturers | 470.03 | 10 | -2.14% | 14.58% |
| CVNA | Carvana Co | | Auto & Truck Dealerships | 378.06 | 80 | 3.69% | 89.45% |
| ABNB | Airbnb | | Travel Services | 124.68 | 50 | 1.20% | -5.17% |
| TWX | Time Warner | | Entertainment | 56.25 | 100 | 0.27% | 0.00% |
| MAR | Marriott | | Lodging | 265.63 | 20 | 1.37% | -2.75% |
| AZO | Autozone | | Auto Parts | 4232.57 | 50 | 0.00% | 30.23% |
| HLT | Hilton Worldwide | | Lodging | 267.89 | 10 | 0.56% | 9.42% |
| For chart view version of above stock list: Chart View ➞ 0 - 25 , 25 - 50 , 50 - 75 , 75 - 100 , 100 - 125 , 125 - 150 , 150 - 175 , 175 - 200 , 200 - 225 , 225 - 250 , 250 - 275 , 275 - 300 , 300 - 325 , 325 - 350 , 350 - 375 , 375 - 400 , 400 - 425 , 425 - 450 , 450 - 475 , 475 - 500 , 500 - 525 , 525 - 550 , 550 - 575 , 575 - 600 , 600 - 625 | ||
 | Click To Change The Sort Order: By Market Cap or Company Size Performance: Year-to-date, Week and Day |  |
|
Get the most comprehensive stock market coverage daily at 12Stocks.com ➞ Best Stocks Today ➞ Best Stocks Weekly ➞ Best Stocks Year-to-Date ➞ Best Stocks Trends ➞  Best Stocks Today 12Stocks.com Best Nasdaq Stocks ➞ Best S&P 500 Stocks ➞ Best Tech Stocks ➞ Best Biotech Stocks ➞ |
| Detailed Overview of Consumer Services Stocks |
| Consumer Services Technical Overview, Leaders & Laggards, Top Consumer Services ETF Funds & Detailed Consumer Services Stocks List, Charts, Trends & More |
| Consumer Services Sector: Technical Analysis, Trends & YTD Performance | |
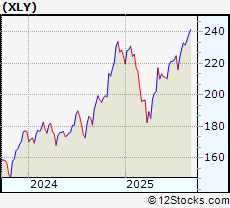
| Consumer Services sector is composed of stocks
from retail, entertainment, media/publishing, consumer goods
and services subsectors. Consumer Services sector, as represented by XLY, an exchange-traded fund [ETF] that holds basket of Consumer Services stocks (e.g, Walmart, Alibaba) is up by 9.693% and is currently underperforming the overall market by -3.8957% year-to-date. Below is a quick view of Technical charts and trends: |
|
 XLY Weekly Chart |
|
| Long Term Trend: Very Good | |
| Medium Term Trend: Good | |
 XLY Daily Chart |
|
| Short Term Trend: Good | |
| Overall Trend Score: 90 | |
| YTD Performance: 9.693% | |
| **Trend Scores & Views Are Only For Educational Purposes And Not For Investing | |
| 12Stocks.com: Top Performing Consumer Services Sector Stocks | ||||||||||||||||||||||||||||||||||||||||||||||||
 The top performing Consumer Services sector stocks year to date are
Now, more recently, over last week, the top performing Consumer Services sector stocks on the move are


|
||||||||||||||||||||||||||||||||||||||||||||||||
| 12Stocks.com: Investing in Consumer Services Sector using Exchange Traded Funds | |
|
The following table shows list of key exchange traded funds (ETF) that
help investors track Consumer Services Index. For detailed view, check out our ETF Funds section of our website. Quick View: Move mouse or cursor over ETF symbol (ticker) to view short-term Technical chart and over ETF name to view long term chart. Click on ticker or stock name for detailed view. Click on to add stock symbol to your watchlist and to view watchlist. |
12Stocks.com List of ETFs that track Consumer Services Index
| Ticker | ETF Name | Watchlist | Recent Price | Smart Investing & Trading Score | Change % | Week % | Year-to-date % |
| PMR | Retail | | 40.96 | 70 | -0.0244081 | 2.86288 | 0% |
| 12Stocks.com: Charts, Trends, Fundamental Data and Performances of Consumer Services Stocks | |
|
We now take in-depth look at all Consumer Services stocks including charts, multi-period performances and overall trends (as measured by Smart Investing & Trading Score). One can sort Consumer Services stocks (click link to choose) by Daily, Weekly and by Year-to-Date performances. Also, one can sort by size of the company or by market capitalization. |
| Select Your Default Chart Type: | |||||
| |||||
| Click on stock symbol or name for detailed view. Click on to add stock symbol to your watchlist and to view watchlist. Quick View: Move mouse or cursor over "Daily" to quickly view daily Technical stock chart and over "Weekly" to view weekly Technical stock chart. | |||||

 | AMZN Amazon.com Inc |
| Sector: Services & Goods | |
| SubSector: Internet Retail | |
| MarketCap: 2477780 Millions | |
| Recent Price: 229.32 Smart Investing & Trading Score: 40 | |
| Day Percent Change: -0.993006% Day Change: -2.3 | |
| Week Change: -0.438501% Year-to-date Change: 4.1% | |
| AMZN Links: Profile News Message Board | |
| Charts:- Daily , Weekly | |
| Add AMZN to Watchlist: View: Get Complete AMZN Trend Analysis ➞ | |
 | TSLA Tesla Inc |
| Sector: Services & Goods | |
| SubSector: Auto Manufacturers | |
| MarketCap: 1131620 Millions | |
| Recent Price: 427.72 Smart Investing & Trading Score: 100 | |
| Day Percent Change: 0.436763% Day Change: 1.86 | |
| Week Change: 22.9823% Year-to-date Change: 12.8% | |
| TSLA Links: Profile News Message Board | |
| Charts:- Daily , Weekly | |
| Add TSLA to Watchlist: View: Get Complete TSLA Trend Analysis ➞ | |
 | HD Home Depot, Inc |
| Sector: Services & Goods | |
| SubSector: Home Improvement Retail | |
| MarketCap: 417017 Millions | |
| Recent Price: 416.73 Smart Investing & Trading Score: 50 | |
| Day Percent Change: -0.0647482% Day Change: -0.27 | |
| Week Change: 0.846986% Year-to-date Change: 8.6% | |
| HD Links: Profile News Message Board | |
| Charts:- Daily , Weekly | |
| Add HD to Watchlist: View: Get Complete HD Trend Analysis ➞ | |
 | BABA Alibaba Group Holding Ltd ADR |
| Sector: Services & Goods | |
| SubSector: Internet Retail | |
| MarketCap: 302968 Millions | |
| Recent Price: 162.35 Smart Investing & Trading Score: 70 | |
| Day Percent Change: -2.29885% Day Change: -3.82 | |
| Week Change: 12.7979% Year-to-date Change: 92.6% | |
| BABA Links: Profile News Message Board | |
| Charts:- Daily , Weekly | |
| Add BABA to Watchlist: View: Get Complete BABA Trend Analysis ➞ | |
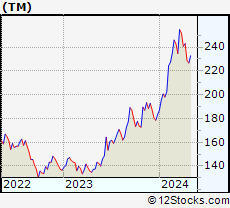 | TM Toyota Motor Corporation ADR |
| Sector: Services & Goods | |
| SubSector: Auto Manufacturers | |
| MarketCap: 260173 Millions | |
| Recent Price: 201.38 Smart Investing & Trading Score: 100 | |
| Day Percent Change: 1.23922% Day Change: -1.92 | |
| Week Change: 0.288845% Year-to-date Change: 6.3% | |
| TM Links: Profile News Message Board | |
| Charts:- Daily , Weekly | |
| Add TM to Watchlist: View: Get Complete TM Trend Analysis ➞ | |
 | MCD McDonald's Corp |
| Sector: Services & Goods | |
| SubSector: Restaurants | |
| MarketCap: 224343 Millions | |
| Recent Price: 300.57 Smart Investing & Trading Score: 20 | |
| Day Percent Change: -1.44276% Day Change: -4.4 | |
| Week Change: -1.75525% Year-to-date Change: 3.9% | |
| MCD Links: Profile News Message Board | |
| Charts:- Daily , Weekly | |
| Add MCD to Watchlist: View: Get Complete MCD Trend Analysis ➞ | |
 | BKNG Booking Holdings Inc |
| Sector: Services & Goods | |
| SubSector: Travel Services | |
| MarketCap: 178442 Millions | |
| Recent Price: 5485.19 Smart Investing & Trading Score: 20 | |
| Day Percent Change: -1.23359% Day Change: -68.51 | |
| Week Change: 0.189596% Year-to-date Change: 11.8% | |
| BKNG Links: Profile News Message Board | |
| Charts:- Daily , Weekly | |
| Add BKNG to Watchlist: View: Get Complete BKNG Trend Analysis ➞ | |
 | PDD PDD Holdings Inc ADR |
| Sector: Services & Goods | |
| SubSector: Internet Retail | |
| MarketCap: 173152 Millions | |
| Recent Price: 133.76 Smart Investing & Trading Score: 100 | |
| Day Percent Change: -0.815661% Day Change: -1.1 | |
| Week Change: 7.28264% Year-to-date Change: 38.1% | |
| PDD Links: Profile News Message Board | |
| Charts:- Daily , Weekly | |
| Add PDD to Watchlist: View: Get Complete PDD Trend Analysis ➞ | |
 | TJX TJX Companies, Inc |
| Sector: Services & Goods | |
| SubSector: Apparel Retail | |
| MarketCap: 154988 Millions | |
| Recent Price: 139.84 Smart Investing & Trading Score: 50 | |
| Day Percent Change: -0.142816% Day Change: -0.2 | |
| Week Change: -0.0143% Year-to-date Change: 16.2% | |
| TJX Links: Profile News Message Board | |
| Charts:- Daily , Weekly | |
| Add TJX to Watchlist: View: Get Complete TJX Trend Analysis ➞ | |
 | LOW Lowe's Cos., Inc |
| Sector: Services & Goods | |
| SubSector: Home Improvement Retail | |
| MarketCap: 151406 Millions | |
| Recent Price: 268.15 Smart Investing & Trading Score: 50 | |
| Day Percent Change: 0.0746408% Day Change: 0.2 | |
| Week Change: 0.600263% Year-to-date Change: 10.2% | |
| LOW Links: Profile News Message Board | |
| Charts:- Daily , Weekly | |
| Add LOW to Watchlist: View: Get Complete LOW Trend Analysis ➞ | |
 | MELI MercadoLibre Inc |
| Sector: Services & Goods | |
| SubSector: Internet Retail | |
| MarketCap: 122560 Millions | |
| Recent Price: 2487.78 Smart Investing & Trading Score: 70 | |
| Day Percent Change: 1.69479% Day Change: 41.46 | |
| Week Change: 5.9085% Year-to-date Change: 41.0% | |
| MELI Links: Profile News Message Board | |
| Charts:- Daily , Weekly | |
| Add MELI to Watchlist: View: Get Complete MELI Trend Analysis ➞ | |
 | NKE Nike, Inc |
| Sector: Services & Goods | |
| SubSector: Footwear & Accessories | |
| MarketCap: 109158 Millions | |
| Recent Price: 72.33 Smart Investing & Trading Score: 30 | |
| Day Percent Change: 0.0276587% Day Change: 0.02 | |
| Week Change: -2.58586% Year-to-date Change: -0.7% | |
| NKE Links: Profile News Message Board | |
| Charts:- Daily , Weekly | |
| Add NKE to Watchlist: View: Get Complete NKE Trend Analysis ➞ | |
 | DASH DoorDash Inc |
| Sector: Services & Goods | |
| SubSector: Internet Retail | |
| MarketCap: 105453 Millions | |
| Recent Price: 263.72 Smart Investing & Trading Score: 90 | |
| Day Percent Change: 1.7242% Day Change: 4.47 | |
| Week Change: 2.44338% Year-to-date Change: 54.5% | |
| DASH Links: Profile News Message Board | |
| Charts:- Daily , Weekly | |
| Add DASH to Watchlist: View: Get Complete DASH Trend Analysis ➞ | |
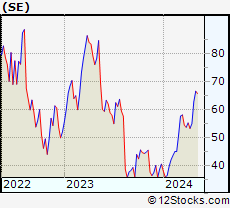 | SE Sea Ltd ADR |
| Sector: Services & Goods | |
| SubSector: Internet Retail | |
| MarketCap: 104718 Millions | |
| Recent Price: 186.89 Smart Investing & Trading Score: 30 | |
| Day Percent Change: -1.15301% Day Change: 0.86 | |
| Week Change: -2.99995% Year-to-date Change: 78.2% | |
| SE Links: Profile News Message Board | |
| Charts:- Daily , Weekly | |
| Add SE to Watchlist: View: Get Complete SE Trend Analysis ➞ | |
 | DADA Dada Nexus Limited |
| Sector: Services & Goods | |
| SubSector: Internet Retail | |
| MarketCap: 98527 Millions | |
| Recent Price: 1.96 Smart Investing & Trading Score: 10 | |
| Day Percent Change: -1.25945% Day Change: -9999 | |
| Week Change: -2.48756% Year-to-date Change: 47.4% | |
| DADA Links: Profile News Message Board | |
| Charts:- Daily , Weekly | |
| Add DADA to Watchlist: View: Get Complete DADA Trend Analysis ➞ | |
 | SBUX Starbucks Corp |
| Sector: Services & Goods | |
| SubSector: Restaurants | |
| MarketCap: 97108.3 Millions | |
| Recent Price: 82.94 Smart Investing & Trading Score: 20 | |
| Day Percent Change: -0.336458% Day Change: -0.28 | |
| Week Change: 0.0723938% Year-to-date Change: -8.9% | |
| SBUX Links: Profile News Message Board | |
| Charts:- Daily , Weekly | |
| Add SBUX to Watchlist: View: Get Complete SBUX Trend Analysis ➞ | |
 | RCL Royal Caribbean Group |
| Sector: Services & Goods | |
| SubSector: Travel Services | |
| MarketCap: 95686.3 Millions | |
| Recent Price: 322.74 Smart Investing & Trading Score: 20 | |
| Day Percent Change: -0.102145% Day Change: -0.33 | |
| Week Change: -5.49341% Year-to-date Change: 41.8% | |
| RCL Links: Profile News Message Board | |
| Charts:- Daily , Weekly | |
| Add RCL to Watchlist: View: Get Complete RCL Trend Analysis ➞ | |
 | ORLY O'Reilly Automotive, Inc |
| Sector: Services & Goods | |
| SubSector: Auto Parts | |
| MarketCap: 88956.4 Millions | |
| Recent Price: 104.98 Smart Investing & Trading Score: 40 | |
| Day Percent Change: 0.411286% Day Change: 0.43 | |
| Week Change: -0.12368% Year-to-date Change: 32.6% | |
| ORLY Links: Profile News Message Board | |
| Charts:- Daily , Weekly | |
| Add ORLY to Watchlist: View: Get Complete ORLY Trend Analysis ➞ | |
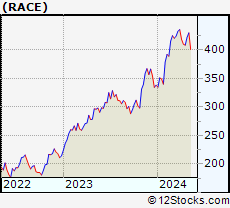 | RACE Ferrari N.V |
| Sector: Services & Goods | |
| SubSector: Auto Manufacturers | |
| MarketCap: 87108.6 Millions | |
| Recent Price: 470.03 Smart Investing & Trading Score: 10 | |
| Day Percent Change: -2.14436% Day Change: -1.4 | |
| Week Change: -1.9995% Year-to-date Change: 14.6% | |
| RACE Links: Profile News Message Board | |
| Charts:- Daily , Weekly | |
| Add RACE to Watchlist: View: Get Complete RACE Trend Analysis ➞ | |
 | CVNA Carvana Co |
| Sector: Services & Goods | |
| SubSector: Auto & Truck Dealerships | |
| MarketCap: 79384.2 Millions | |
| Recent Price: 378.06 Smart Investing & Trading Score: 80 | |
| Day Percent Change: 3.69456% Day Change: 0.46 | |
| Week Change: 0.816% Year-to-date Change: 89.4% | |
| CVNA Links: Profile News Message Board | |
| Charts:- Daily , Weekly | |
| Add CVNA to Watchlist: View: Get Complete CVNA Trend Analysis ➞ | |
 | ABNB Airbnb Inc |
| Sector: Services & Goods | |
| SubSector: Travel Services | |
| MarketCap: 76940 Millions | |
| Recent Price: 124.68 Smart Investing & Trading Score: 50 | |
| Day Percent Change: 1.2013% Day Change: 1.48 | |
| Week Change: 1.02909% Year-to-date Change: -5.2% | |
| ABNB Links: Profile News Message Board | |
| Charts:- Daily , Weekly | |
| Add ABNB to Watchlist: View: Get Complete ABNB Trend Analysis ➞ | |
 | TWX Time Warner Inc. |
| Sector: Services & Goods | |
| SubSector: Entertainment - Diversified | |
| MarketCap: 76341.8 Millions | |
| Recent Price: 56.25 Smart Investing & Trading Score: 100 | |
| Day Percent Change: 0.26738% Day Change: -9999 | |
| Week Change: 12.3427% Year-to-date Change: 0.0% | |
| TWX Links: Profile News Message Board | |
| Charts:- Daily , Weekly | |
| Add TWX to Watchlist: View: Get Complete TWX Trend Analysis ➞ | |
 | MAR Marriott International, Inc |
| Sector: Services & Goods | |
| SubSector: Lodging | |
| MarketCap: 71854.9 Millions | |
| Recent Price: 265.63 Smart Investing & Trading Score: 20 | |
| Day Percent Change: 1.36615% Day Change: 3.58 | |
| Week Change: 1.22323% Year-to-date Change: -2.7% | |
| MAR Links: Profile News Message Board | |
| Charts:- Daily , Weekly | |
| Add MAR to Watchlist: View: Get Complete MAR Trend Analysis ➞ | |
 | AZO Autozone Inc |
| Sector: Services & Goods | |
| SubSector: Auto Parts | |
| MarketCap: 70585.3 Millions | |
| Recent Price: 4232.57 Smart Investing & Trading Score: 50 | |
| Day Percent Change: 0% Day Change: 0 | |
| Week Change: -0.478027% Year-to-date Change: 30.2% | |
| AZO Links: Profile News Message Board | |
| Charts:- Daily , Weekly | |
| Add AZO to Watchlist: View: Get Complete AZO Trend Analysis ➞ | |
 | HLT Hilton Worldwide Holdings Inc |
| Sector: Services & Goods | |
| SubSector: Lodging | |
| MarketCap: 64043.3 Millions | |
| Recent Price: 267.89 Smart Investing & Trading Score: 10 | |
| Day Percent Change: 0.555535% Day Change: 1.48 | |
| Week Change: -1.90773% Year-to-date Change: 9.4% | |
| HLT Links: Profile News Message Board | |
| Charts:- Daily , Weekly | |
| Add HLT to Watchlist: View: Get Complete HLT Trend Analysis ➞ | |
| For tabular summary view of above stock list: Summary View ➞ 0 - 25 , 25 - 50 , 50 - 75 , 75 - 100 , 100 - 125 , 125 - 150 , 150 - 175 , 175 - 200 , 200 - 225 , 225 - 250 , 250 - 275 , 275 - 300 , 300 - 325 , 325 - 350 , 350 - 375 , 375 - 400 , 400 - 425 , 425 - 450 , 450 - 475 , 475 - 500 , 500 - 525 , 525 - 550 , 550 - 575 , 575 - 600 , 600 - 625 | ||
| Click To Change The Sort Order: By Market Cap or Company Size Performance: Year-to-date, Week and Day | |
| Select Chart Type: | ||
|
Best Stocks Today 12Stocks.com |
© 2025 12Stocks.com Terms & Conditions Privacy Contact Us
All Information Provided Only For Education And Not To Be Used For Investing or Trading. See Terms & Conditions


One More Thing ... Get Best Stocks Delivered Daily!
Never Ever Miss A Move With Our Top Ten Stocks Lists
Find Best Stocks In Any Market - Bull or Bear Market
Take A Peek At Our Top Ten Stocks Lists: Daily, Weekly, Year-to-Date & Top Trends
Find Best Stocks In Any Market - Bull or Bear Market
Take A Peek At Our Top Ten Stocks Lists: Daily, Weekly, Year-to-Date & Top Trends
Consumer Services Stocks With Best Up Trends [0-bearish to 100-bullish]: Whole Foods[100], Net 1[100], NIO [100], Resources Connection[100], ECARX [100], Therealreal [100], Kohl's Corp[100], KapStone Paper[100], H World[100], Steven Madden[100], Vipshop [100]
Best Consumer Services Stocks Year-to-Date:
WW [2036.36%], Nova Lifestyle[685.77%], ThredUp [641.135%], Lucid [571.947%], Vroom [455.146%], China Yuchai[316.32%], Luxottica [210.802%], Jumia Technologies[204.359%], Cooper-Standard [186.821%], Niu Technologies[154.023%], Masterbeef [138.293%] Best Consumer Services Stocks This Week:
Party City[37593.9%], Companhia Brasileira[18587.4%], Conn s[16420.1%], Rite Aid[10214.6%], Arctic Cat[2387.5%], Chico s[2120.53%], Multi-Color [2063.68%], Reis [1734.59%], Quotient Technology[954.386%], Express [946.725%], Volt Information[705.085%] Best Consumer Services Stocks Daily:
Container Store[22.6852%], SUPERVALU [20.4138%], World Wrestling[14.734%], Global Sources[13.1016%], Whole Foods[11.8363%], iClick Interactive[10%], Net 1[9.46197%], Uxin [8.28221%], Kewaunee Scientific[7.96178%], Ascent Capital[7.28814%], Niu Technologies[7.02179%]