
 Login Sign Up


| |||||
 |  | ||||

| 12Stocks.com Market Intelligence |
Best Consumer Services Stocks
| In a hurry? Services & Goods Stocks: Performance Trends Table, Stock Charts
Sort Consumer Services: Daily, Weekly, Year-to-Date, Market Cap & Trends. Filter Services & Goods stocks list by size: All Large Mid-Range Small |
| 12Stocks.com Consumer Services Stocks Performances & Trends Daily | |||||||||
|
|  The overall Smart Investing & Trading Score is 100 (0-bearish to 100-bullish) which puts Consumer Services sector in short term bullish trend. The Smart Investing & Trading Score from previous trading session is 65 and an improvement of trend continues.
| ||||||||
Here are the Smart Investing & Trading Scores of the most requested Consumer Services stocks at 12Stocks.com (click stock name for detailed review):
|


| Consider signing up for our daily 12Stocks.com "Best Stocks Newsletter". You will never ever miss a big stock move again! |
| 12Stocks.com: Investing in Consumer Services sector with Stocks | |
|
The following table helps investors and traders sort through current performance and trends (as measured by Smart Investing & Trading Score) of various
stocks in the Consumer Services sector. Quick View: Move mouse or cursor over stock symbol (ticker) to view short-term Technical chart and over stock name to view long term chart. Click on  to add stock symbol to your watchlist and to add stock symbol to your watchlist and  to view watchlist. Click on any ticker or stock name for detailed market intelligence report for that stock. to view watchlist. Click on any ticker or stock name for detailed market intelligence report for that stock. |
12Stocks.com Performance of Stocks in Consumer Services Sector
| Ticker | Stock Name | Watchlist | Category | Recent Price | Smart Investing & Trading Score | Change % | YTD Change% |
| TDUP | ThredUp |   | Internet Retail | 7.08 | 63 | 3.66% | 409.35% |
| PAYS | PaySign | | Services | 7.85 | 63 | 0.51% | 159.93% |
| EYE | National Vision | | Retail | 24.46 | 58 | -0.33% | 134.74% |
| KTOS | Kratos Defense | | Security | 51.71 | 100 | 11.76% | 96.02% |
| WLDN | Willdan | | Services | 73.92 | 83 | 1.72% | 94.07% |
| SGHC | Super | | Gambling | 11.48 | 76 | -2.63% | 85.33% |
| RBLX | Roblox | | Electronic Gaming & Multimedia | 105.69 | 73 | 0.63% | 82.67% |
| QS | QuantumScape | | Auto Parts | 9.23 | 95 | 1.54% | 77.84% |
| GTN | Gray Television | | Broadcasting | 5.36 | 83 | -4.63% | 73.46% |
| SSP | E.W. Scripps | | Broadcasting | 3.76 | 83 | -9.40% | 70.14% |
| CVNA | Carvana Co | | Automobile | 343.67 | 61 | -0.54% | 69.00% |
| AMBP | Ardagh Metal | | Packaging | 4.74 | 88 | 0.42% | 63.38% |
| WNS | WNS () | | Services | 74.70 | 76 | -0.19% | 57.63% |
| EVI | EVI Industries | | Consumer Services | 25.53 | 68 | -1.92% | 56.15% |
| DG | Dollar General | | Retail | 113.14 | 76 | 0.78% | 51.36% |
| RCL | Royal Caribbean | | Casinos | 338.51 | 90 | -0.83% | 47.25% |
| APEI | American Public | | Education | 31.72 | 95 | 2.36% | 47.06% |
| DLTR | Dollar Tree | | Retail | 109.36 | 100 | 0.91% | 45.93% |
| NATH | Nathan s | | Restaurants | 113.47 | 66 | -1.63% | 45.08% |
| TITN | Titan Machinery | | Equipment | 19.93 | 58 | -2.40% | 41.05% |
| MELI | MercadoLibre | | Retail | 2387.45 | 34 | -0.61% | 40.40% |
| SAH | Sonic Automotive | | Automobile | 88.25 | 83 | 0.90% | 40.13% |
| CAKE | Cheesecake Factory | | Restaurants | 64.77 | 85 | 0.94% | 37.27% |
| CAH | Cardinal Health | | Pharmacy | 160.97 | 31 | -0.74% | 37.19% |
| CPNG | Coupang | | Internet Retail | 30.08 | 73 | -1.22% | 36.85% |
| For chart view version of above stock list: Chart View ➞ 0 - 25 , 25 - 50 , 50 - 75 , 75 - 100 , 100 - 125 , 125 - 150 , 150 - 175 , 175 - 200 , 200 - 225 , 225 - 250 , 250 - 275 , 275 - 300 , 300 - 325 , 325 - 350 | ||
 | Click To Change The Sort Order: By Market Cap or Company Size Performance: Year-to-date, Week and Day |  |
|
Get the most comprehensive stock market coverage daily at 12Stocks.com ➞ Best Stocks Today ➞ Best Stocks Weekly ➞ Best Stocks Year-to-Date ➞ Best Stocks Trends ➞  Best Stocks Today 12Stocks.com Best Nasdaq Stocks ➞ Best S&P 500 Stocks ➞ Best Tech Stocks ➞ Best Biotech Stocks ➞ |
| Detailed Overview of Consumer Services Stocks |
| Consumer Services Technical Overview, Leaders & Laggards, Top Consumer Services ETF Funds & Detailed Consumer Services Stocks List, Charts, Trends & More |
| Consumer Services Sector: Technical Analysis, Trends & YTD Performance | |
| Consumer Services sector is composed of stocks
from retail, entertainment, media/publishing, consumer goods
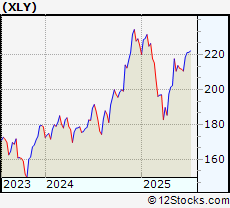
and services subsectors. Consumer Services sector, as represented by XLY, an exchange-traded fund [ETF] that holds basket of Consumer Services stocks (e.g, Walmart, Alibaba) is down by -1.03% and is currently underperforming the overall market by -7.34% year-to-date. Below is a quick view of Technical charts and trends: |
|
 XLY Weekly Chart |
|
| Long Term Trend: Very Good | |
| Medium Term Trend: Very Good | |
 XLY Daily Chart |
|
| Short Term Trend: Very Good | |
| Overall Trend Score: 100 | |
| YTD Performance: -1.03% | |
| **Trend Scores & Views Are Only For Educational Purposes And Not For Investing | |
| 12Stocks.com: Top Performing Consumer Services Sector Stocks | ||||||||||||||||||||||||||||||||||||||||||||||||
 The top performing Consumer Services sector stocks year to date are
Now, more recently, over last week, the top performing Consumer Services sector stocks on the move are


|
||||||||||||||||||||||||||||||||||||||||||||||||
| 12Stocks.com: Investing in Consumer Services Sector using Exchange Traded Funds | |
|
The following table shows list of key exchange traded funds (ETF) that
help investors track Consumer Services Index. For detailed view, check out our ETF Funds section of our website. Quick View: Move mouse or cursor over ETF symbol (ticker) to view short-term Technical chart and over ETF name to view long term chart. Click on ticker or stock name for detailed view. Click on to add stock symbol to your watchlist and to view watchlist. |
12Stocks.com List of ETFs that track Consumer Services Index
| Ticker | ETF Name | Watchlist | Recent Price | Smart Investing & Trading Score | Change % | Week % | Year-to-date % |
| XLY | Consumer Discret Sel | | 221.43 | 100 | 0.03 | 0.1 | -1.03% |
| RTH | Retail | | 238.66 | 56 | -0.24 | -0.9 | 6.44% |
| XRT | Retail | | 80.26 | 71 | -0.84 | -0.46 | 1.11% |
| UCC | Consumer Services | | 46.71 | 100 | 0.11 | -0.06 | -9.36% |
| SCC | Short Consumer Services | | 17.11 | 36 | 0.04 | 0.1 | 85.78% |
| UGE | Consumer Goods | | 18.40 | 8 | -0.6 | -3.19 | 2.28% |
| 12Stocks.com: Charts, Trends, Fundamental Data and Performances of Consumer Services Stocks | |
|
We now take in-depth look at all Consumer Services stocks including charts, multi-period performances and overall trends (as measured by Smart Investing & Trading Score). One can sort Consumer Services stocks (click link to choose) by Daily, Weekly and by Year-to-Date performances. Also, one can sort by size of the company or by market capitalization. |
| Select Your Default Chart Type: | |||||
| |||||
| Click on stock symbol or name for detailed view. Click on to add stock symbol to your watchlist and to view watchlist. Quick View: Move mouse or cursor over "Daily" to quickly view daily Technical stock chart and over "Weekly" to view weekly Technical stock chart. | |||||

 | TDUP ThredUp Inc. |
| Sector: Services & Goods | |
| SubSector: Internet Retail | |
| MarketCap: 258 Millions | |
| Recent Price: 7.08 Smart Investing & Trading Score: 63 | |
| Day Percent Change: 3.66% Day Change: 0.25 | |
| Week Change: -11.5% Year-to-date Change: 409.4% | |
| TDUP Links: Profile News Message Board | |
| Charts:- Daily , Weekly | |
| Add TDUP to Watchlist: View: Get Complete TDUP Trend Analysis ➞ | |
 | PAYS PaySign, Inc. |
| Sector: Services & Goods | |
| SubSector: Business Services | |
| MarketCap: 213.882 Millions | |
| Recent Price: 7.85 Smart Investing & Trading Score: 63 | |
| Day Percent Change: 0.51% Day Change: 0.04 | |
| Week Change: -3.09% Year-to-date Change: 159.9% | |
| PAYS Links: Profile News Message Board | |
| Charts:- Daily , Weekly | |
| Add PAYS to Watchlist: View: Get Complete PAYS Trend Analysis ➞ | |
 | EYE National Vision Holdings, Inc. |
| Sector: Services & Goods | |
| SubSector: Specialty Retail, Other | |
| MarketCap: 1290.84 Millions | |
| Recent Price: 24.46 Smart Investing & Trading Score: 58 | |
| Day Percent Change: -0.33% Day Change: -0.08 | |
| Week Change: 2.34% Year-to-date Change: 134.7% | |
| EYE Links: Profile News Message Board | |
| Charts:- Daily , Weekly | |
| Add EYE to Watchlist: View: Get Complete EYE Trend Analysis ➞ | |
 | KTOS Kratos Defense & Security Solutions, Inc. |
| Sector: Services & Goods | |
| SubSector: Security & Protection Services | |
| MarketCap: 1369.63 Millions | |
| Recent Price: 51.71 Smart Investing & Trading Score: 100 | |
| Day Percent Change: 11.76% Day Change: 5.44 | |
| Week Change: 15.79% Year-to-date Change: 96.0% | |
| KTOS Links: Profile News Message Board | |
| Charts:- Daily , Weekly | |
| Add KTOS to Watchlist: View: Get Complete KTOS Trend Analysis ➞ | |
 | WLDN Willdan Group, Inc. |
| Sector: Services & Goods | |
| SubSector: Technical Services | |
| MarketCap: 235.61 Millions | |
| Recent Price: 73.92 Smart Investing & Trading Score: 83 | |
| Day Percent Change: 1.72% Day Change: 1.25 | |
| Week Change: 2.24% Year-to-date Change: 94.1% | |
| WLDN Links: Profile News Message Board | |
| Charts:- Daily , Weekly | |
| Add WLDN to Watchlist: View: Get Complete WLDN Trend Analysis ➞ | |
 | SGHC Super Group (SGHC) Limited |
| Sector: Services & Goods | |
| SubSector: Gambling | |
| MarketCap: 1390 Millions | |
| Recent Price: 11.48 Smart Investing & Trading Score: 76 | |
| Day Percent Change: -2.63% Day Change: -0.31 | |
| Week Change: 0.79% Year-to-date Change: 85.3% | |
| SGHC Links: Profile News Message Board | |
| Charts:- Daily , Weekly | |
| Add SGHC to Watchlist: View: Get Complete SGHC Trend Analysis ➞ | |
 | RBLX Roblox Corporation |
| Sector: Services & Goods | |
| SubSector: Electronic Gaming & Multimedia | |
| MarketCap: 25420 Millions | |
| Recent Price: 105.69 Smart Investing & Trading Score: 73 | |
| Day Percent Change: 0.63% Day Change: 0.66 | |
| Week Change: 2.03% Year-to-date Change: 82.7% | |
| RBLX Links: Profile News Message Board | |
| Charts:- Daily , Weekly | |
| Add RBLX to Watchlist: View: Get Complete RBLX Trend Analysis ➞ | |
 | QS QuantumScape Corporation |
| Sector: Services & Goods | |
| SubSector: Auto Parts | |
| MarketCap: 13137 Millions | |
| Recent Price: 9.23 Smart Investing & Trading Score: 95 | |
| Day Percent Change: 1.54% Day Change: 0.14 | |
| Week Change: 31.48% Year-to-date Change: 77.8% | |
| QS Links: Profile News Message Board | |
| Charts:- Daily , Weekly | |
| Add QS to Watchlist: View: Get Complete QS Trend Analysis ➞ | |
 | GTN Gray Television, Inc. |
| Sector: Services & Goods | |
| SubSector: Broadcasting - TV | |
| MarketCap: 1144.63 Millions | |
| Recent Price: 5.36 Smart Investing & Trading Score: 83 | |
| Day Percent Change: -4.63% Day Change: -0.26 | |
| Week Change: 8.94% Year-to-date Change: 73.5% | |
| GTN Links: Profile News Message Board | |
| Charts:- Daily , Weekly | |
| Add GTN to Watchlist: View: Get Complete GTN Trend Analysis ➞ | |
 | SSP The E.W. Scripps Company |
| Sector: Services & Goods | |
| SubSector: Broadcasting - TV | |
| MarketCap: 766.163 Millions | |
| Recent Price: 3.76 Smart Investing & Trading Score: 83 | |
| Day Percent Change: -9.4% Day Change: -0.39 | |
| Week Change: 13.25% Year-to-date Change: 70.1% | |
| SSP Links: Profile News Message Board | |
| Charts:- Daily , Weekly | |
| Add SSP to Watchlist: View: Get Complete SSP Trend Analysis ➞ | |
 | CVNA Carvana Co. |
| Sector: Services & Goods | |
| SubSector: Auto Dealerships | |
| MarketCap: 5585.31 Millions | |
| Recent Price: 343.67 Smart Investing & Trading Score: 61 | |
| Day Percent Change: -0.54% Day Change: -1.88 | |
| Week Change: -1.34% Year-to-date Change: 69.0% | |
| CVNA Links: Profile News Message Board | |
| Charts:- Daily , Weekly | |
| Add CVNA to Watchlist: View: Get Complete CVNA Trend Analysis ➞ | |
 | AMBP Ardagh Metal Packaging S.A. |
| Sector: Services & Goods | |
| SubSector: Packaging & Containers | |
| MarketCap: 2170 Millions | |
| Recent Price: 4.74 Smart Investing & Trading Score: 88 | |
| Day Percent Change: 0.42% Day Change: 0.02 | |
| Week Change: 5.1% Year-to-date Change: 63.4% | |
| AMBP Links: Profile News Message Board | |
| Charts:- Daily , Weekly | |
| Add AMBP to Watchlist: View: Get Complete AMBP Trend Analysis ➞ | |
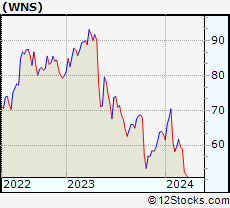 | WNS WNS (Holdings) Limited |
| Sector: Services & Goods | |
| SubSector: Business Services | |
| MarketCap: 2410.72 Millions | |
| Recent Price: 74.70 Smart Investing & Trading Score: 76 | |
| Day Percent Change: -0.19% Day Change: -0.14 | |
| Week Change: 14.26% Year-to-date Change: 57.6% | |
| WNS Links: Profile News Message Board | |
| Charts:- Daily , Weekly | |
| Add WNS to Watchlist: View: Get Complete WNS Trend Analysis ➞ | |
 | EVI EVI Industries, Inc. |
| Sector: Services & Goods | |
| SubSector: Consumer Services | |
| MarketCap: 207.448 Millions | |
| Recent Price: 25.53 Smart Investing & Trading Score: 68 | |
| Day Percent Change: -1.92% Day Change: -0.5 | |
| Week Change: 2.2% Year-to-date Change: 56.2% | |
| EVI Links: Profile News Message Board | |
| Charts:- Daily , Weekly | |
| Add EVI to Watchlist: View: Get Complete EVI Trend Analysis ➞ | |
 | DG Dollar General Corporation |
| Sector: Services & Goods | |
| SubSector: Discount, Variety Stores | |
| MarketCap: 39611.9 Millions | |
| Recent Price: 113.14 Smart Investing & Trading Score: 76 | |
| Day Percent Change: 0.78% Day Change: 0.88 | |
| Week Change: -0.85% Year-to-date Change: 51.4% | |
| DG Links: Profile News Message Board | |
| Charts:- Daily , Weekly | |
| Add DG to Watchlist: View: Get Complete DG Trend Analysis ➞ | |
 | RCL Royal Caribbean Cruises Ltd. |
| Sector: Services & Goods | |
| SubSector: Resorts & Casinos | |
| MarketCap: 7294.14 Millions | |
| Recent Price: 338.51 Smart Investing & Trading Score: 90 | |
| Day Percent Change: -0.83% Day Change: -2.85 | |
| Week Change: 1.2% Year-to-date Change: 47.3% | |
| RCL Links: Profile News Message Board | |
| Charts:- Daily , Weekly | |
| Add RCL to Watchlist: View: Get Complete RCL Trend Analysis ➞ | |
 | APEI American Public Education, Inc. |
| Sector: Services & Goods | |
| SubSector: Education & Training Services | |
| MarketCap: 361.306 Millions | |
| Recent Price: 31.72 Smart Investing & Trading Score: 95 | |
| Day Percent Change: 2.36% Day Change: 0.73 | |
| Week Change: 5% Year-to-date Change: 47.1% | |
| APEI Links: Profile News Message Board | |
| Charts:- Daily , Weekly | |
| Add APEI to Watchlist: View: Get Complete APEI Trend Analysis ➞ | |
 | DLTR Dollar Tree, Inc. |
| Sector: Services & Goods | |
| SubSector: Discount, Variety Stores | |
| MarketCap: 21383.2 Millions | |
| Recent Price: 109.36 Smart Investing & Trading Score: 100 | |
| Day Percent Change: 0.91% Day Change: 0.99 | |
| Week Change: 7.31% Year-to-date Change: 45.9% | |
| DLTR Links: Profile News Message Board | |
| Charts:- Daily , Weekly | |
| Add DLTR to Watchlist: View: Get Complete DLTR Trend Analysis ➞ | |
 | NATH Nathan s Famous, Inc. |
| Sector: Services & Goods | |
| SubSector: Restaurants | |
| MarketCap: 211.77 Millions | |
| Recent Price: 113.47 Smart Investing & Trading Score: 66 | |
| Day Percent Change: -1.63% Day Change: -1.88 | |
| Week Change: 0.62% Year-to-date Change: 45.1% | |
| NATH Links: Profile News Message Board | |
| Charts:- Daily , Weekly | |
| Add NATH to Watchlist: View: Get Complete NATH Trend Analysis ➞ | |
 | TITN Titan Machinery Inc. |
| Sector: Services & Goods | |
| SubSector: Industrial Equipment Wholesale | |
| MarketCap: 208.958 Millions | |
| Recent Price: 19.93 Smart Investing & Trading Score: 58 | |
| Day Percent Change: -2.4% Day Change: -0.49 | |
| Week Change: -7.73% Year-to-date Change: 41.1% | |
| TITN Links: Profile News Message Board | |
| Charts:- Daily , Weekly | |
| Add TITN to Watchlist: View: Get Complete TITN Trend Analysis ➞ | |
 | MELI MercadoLibre, Inc. |
| Sector: Services & Goods | |
| SubSector: Catalog & Mail Order Houses | |
| MarketCap: 24695.5 Millions | |
| Recent Price: 2387.45 Smart Investing & Trading Score: 34 | |
| Day Percent Change: -0.61% Day Change: -14.65 | |
| Week Change: -5.04% Year-to-date Change: 40.4% | |
| MELI Links: Profile News Message Board | |
| Charts:- Daily , Weekly | |
| Add MELI to Watchlist: View: Get Complete MELI Trend Analysis ➞ | |
 | SAH Sonic Automotive, Inc. |
| Sector: Services & Goods | |
| SubSector: Auto Dealerships | |
| MarketCap: 581.321 Millions | |
| Recent Price: 88.25 Smart Investing & Trading Score: 83 | |
| Day Percent Change: 0.9% Day Change: 0.79 | |
| Week Change: 0.78% Year-to-date Change: 40.1% | |
| SAH Links: Profile News Message Board | |
| Charts:- Daily , Weekly | |
| Add SAH to Watchlist: View: Get Complete SAH Trend Analysis ➞ | |
 | CAKE The Cheesecake Factory Incorporated |
| Sector: Services & Goods | |
| SubSector: Restaurants | |
| MarketCap: 829 Millions | |
| Recent Price: 64.77 Smart Investing & Trading Score: 85 | |
| Day Percent Change: 0.94% Day Change: 0.6 | |
| Week Change: -1.42% Year-to-date Change: 37.3% | |
| CAKE Links: Profile News Message Board | |
| Charts:- Daily , Weekly | |
| Add CAKE to Watchlist: View: Get Complete CAKE Trend Analysis ➞ | |
 | CAH Cardinal Health, Inc. |
| Sector: Services & Goods | |
| SubSector: Drugs Wholesale | |
| MarketCap: 14509.9 Millions | |
| Recent Price: 160.97 Smart Investing & Trading Score: 31 | |
| Day Percent Change: -0.74% Day Change: -1.2 | |
| Week Change: -2.4% Year-to-date Change: 37.2% | |
| CAH Links: Profile News Message Board | |
| Charts:- Daily , Weekly | |
| Add CAH to Watchlist: View: Get Complete CAH Trend Analysis ➞ | |
 | CPNG Coupang, Inc. |
| Sector: Services & Goods | |
| SubSector: Internet Retail | |
| MarketCap: 30840 Millions | |
| Recent Price: 30.08 Smart Investing & Trading Score: 73 | |
| Day Percent Change: -1.22% Day Change: -0.37 | |
| Week Change: -0.69% Year-to-date Change: 36.9% | |
| CPNG Links: Profile News Message Board | |
| Charts:- Daily , Weekly | |
| Add CPNG to Watchlist: View: Get Complete CPNG Trend Analysis ➞ | |
| For tabular summary view of above stock list: Summary View ➞ 0 - 25 , 25 - 50 , 50 - 75 , 75 - 100 , 100 - 125 , 125 - 150 , 150 - 175 , 175 - 200 , 200 - 225 , 225 - 250 , 250 - 275 , 275 - 300 , 300 - 325 , 325 - 350 | ||
| Click To Change The Sort Order: By Market Cap or Company Size Performance: Year-to-date, Week and Day | |
| Select Chart Type: | ||
|
Best Stocks Today 12Stocks.com |
© 2025 12Stocks.com Terms & Conditions Privacy Contact Us
All Information Provided Only For Education And Not To Be Used For Investing or Trading. See Terms & Conditions


One More Thing ... Get Best Stocks Delivered Daily!
Never Ever Miss A Move With Our Top Ten Stocks Lists
Find Best Stocks In Any Market - Bull or Bear Market
Take A Peek At Our Top Ten Stocks Lists: Daily, Weekly, Year-to-Date & Top Trends
Find Best Stocks In Any Market - Bull or Bear Market
Take A Peek At Our Top Ten Stocks Lists: Daily, Weekly, Year-to-Date & Top Trends
Consumer Services Stocks With Best Up Trends [0-bearish to 100-bullish]: Kratos Defense[100], AMC Entertainment[100], Advance Auto[100], Performance Food[100], Acacia Research[100], Designer Brands[100], Baker Hughes[100], Wyndham Hotels[100], Amazon.com [100], Hilton Grand[100], Ameresco [100]
Best Consumer Services Stocks Year-to-Date:
ThredUp [409.35%], PaySign [159.93%], National Vision[134.74%], Kratos Defense[96.02%], Willdan [94.07%], Super [85.33%], Roblox [82.67%], QuantumScape [77.84%], Gray Television[73.46%], E.W. Scripps[70.14%], Carvana Co[69%] Best Consumer Services Stocks This Week:
QuantumScape [31.48%], Advance Auto[21.19%], Kratos Defense[15.79%], WNS ()[14.26%], E.W. Scripps[13.25%], AMC Entertainment[12.88%], Jack in[11.68%], Gray Television[8.94%], United Homes[8.42%], Dream Finders[8.35%], Hilton Grand[8.18%] Best Consumer Services Stocks Daily:
Kratos Defense[11.76%], AMC Entertainment[11%], PriceSmart [5.33%], Advance Auto[4.97%], Performance Food[4.84%], CompX [4.84%], ThredUp [3.66%], Acacia Research[3.39%], United Homes[3.34%], Grocery Outlet[3.03%], IMAX [2.9%]