
 Login Sign Up


| |||||
 |  | ||||

| 12Stocks.com Market Intelligence |
Best Consumer Services Stocks
| In a hurry? Services & Goods Stocks: Performance Trends Table, Stock Charts
Sort Consumer Services: Daily, Weekly, Year-to-Date, Market Cap & Trends. Filter Services & Goods stocks list by size: All Large Mid-Range Small |
| 12Stocks.com Consumer Services Stocks Performances & Trends Daily | |||||||||
|
|  The overall Smart Investing & Trading Score is 58 (0-bearish to 100-bullish) which puts Consumer Services sector in short term neutral trend. The Smart Investing & Trading Score from previous trading session is 23 and hence an improvement of trend.
| ||||||||
Here are the Smart Investing & Trading Scores of the most requested Consumer Services stocks at 12Stocks.com (click stock name for detailed review):
|


| Consider signing up for our daily 12Stocks.com "Best Stocks Newsletter". You will never ever miss a big stock move again! |
| 12Stocks.com: Investing in Consumer Services sector with Stocks | |
|
The following table helps investors and traders sort through current performance and trends (as measured by Smart Investing & Trading Score) of various
stocks in the Consumer Services sector. Quick View: Move mouse or cursor over stock symbol (ticker) to view short-term Technical chart and over stock name to view long term chart. Click on  to add stock symbol to your watchlist and to add stock symbol to your watchlist and  to view watchlist. Click on any ticker or stock name for detailed market intelligence report for that stock. to view watchlist. Click on any ticker or stock name for detailed market intelligence report for that stock. |
12Stocks.com Performance of Stocks in Consumer Services Sector
| Ticker | Stock Name | Watchlist | Category | Recent Price | Smart Investing & Trading Score | Change % | YTD Change% |
| WMT | Walmart |   | Retail | 59.09 | 34 | -1.75% | 12.45% |
| BJ | BJ s | | Retail | 74.92 | 68 | 1.22% | 12.39% |
| TW | Tradeweb Markets | | Services | 101.83 | 59 | 0.21% | 12.05% |
| PGRU | PropertyGuru | | Internet Content & Information | 3.75 | 83 | 3.02% | 11.77% |
| MSC | Studio City | | Casinos | 7.23 | 36 | -3.46% | 11.57% |
| J | Jacobs Engineering | | Services | 144.63 | 63 | 0.36% | 11.43% |
| EAT | Brinker | | Restaurants | 48.00 | 100 | 3.87% | 11.16% |
| HGV | Hilton Grand | | Casinos | 44.64 | 68 | 1.87% | 11.10% |
| EDR | Endeavor | | Entertainment | 26.35 | 43 | -0.26% | 11.04% |
| GLP | Global Partners | | Basic Materials Wholesale | 46.95 | 75 | 1.54% | 10.97% |
| CPRT | Copart | | Automobile | 54.31 | 58 | 1.89% | 10.84% |
| CTAS | Cintas | | Services | 666.33 | 51 | 0.20% | 10.56% |
| OUT | Outfront Media | | Marketing | 15.42 | 68 | 2.05% | 10.46% |
| KELYA | Kelly Services | | Staffing | 23.88 | 63 | 1.27% | 10.45% |
| FWONK | Formula One | | Broadcasting | 69.68 | 100 | 1.18% | 10.38% |
| URBN | Urban Outfitters | | Apparel | 39.36 | 75 | 2.07% | 10.28% |
| DDS | Dillard s | | Department | 444.10 | 100 | 6.45% | 10.02% |
| IHG | InterContinental Hotels | | Lodging | 100.13 | 73 | 1.89% | 9.82% |
| RBA | Ritchie Bros. | | Services | 73.24 | 63 | 0.58% | 9.49% |
| DBI | Designer Brands | | Apparel | 9.69 | 75 | 9.49% | 9.49% |
| COST | Costco Wholesale | | Retail | 722.68 | 80 | 1.01% | 9.48% |
| AEO | American Eagle | | Apparel | 23.14 | 63 | 2.75% | 9.36% |
| PK | Park Hotels | | Lodging | 16.73 | 63 | 2.32% | 9.35% |
| PTVE | Pactiv Evergreen | | Packaging | 15.00 | 93 | 2.04% | 9.33% |
| KRT | Karat Packaging | | Packaging | 27.19 | 51 | 3.23% | 9.15% |
| For chart view version of above stock list: Chart View ➞ 0 - 25 , 25 - 50 , 50 - 75 , 75 - 100 , 100 - 125 , 125 - 150 , 150 - 175 , 175 - 200 , 200 - 225 , 225 - 250 , 250 - 275 , 275 - 300 , 300 - 325 , 325 - 350 , 350 - 375 , 375 - 400 , 400 - 425 , 425 - 450 , 450 - 475 | ||
 | Click To Change The Sort Order: By Market Cap or Company Size Performance: Year-to-date, Week and Day |  |
|
Get the most comprehensive stock market coverage daily at 12Stocks.com ➞ Best Stocks Today ➞ Best Stocks Weekly ➞ Best Stocks Year-to-Date ➞ Best Stocks Trends ➞  Best Stocks Today 12Stocks.com Best Nasdaq Stocks ➞ Best S&P 500 Stocks ➞ Best Tech Stocks ➞ Best Biotech Stocks ➞ |
| Detailed Overview of Consumer Services Stocks |
| Consumer Services Technical Overview, Leaders & Laggards, Top Consumer Services ETF Funds & Detailed Consumer Services Stocks List, Charts, Trends & More |
| Consumer Services Sector: Technical Analysis, Trends & YTD Performance | |
| Consumer Services sector is composed of stocks
from retail, entertainment, media/publishing, consumer goods
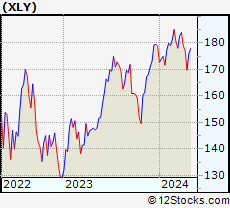
and services subsectors. Consumer Services sector, as represented by XLY, an exchange-traded fund [ETF] that holds basket of Consumer Services stocks (e.g, Walmart, Alibaba) is down by -3.51% and is currently underperforming the overall market by -9.15% year-to-date. Below is a quick view of Technical charts and trends: |
|
 XLY Weekly Chart |
|
| Long Term Trend: Good | |
| Medium Term Trend: Not Good | |
 XLY Daily Chart |
|
| Short Term Trend: Very Good | |
| Overall Trend Score: 58 | |
| YTD Performance: -3.51% | |
| **Trend Scores & Views Are Only For Educational Purposes And Not For Investing | |
| 12Stocks.com: Top Performing Consumer Services Sector Stocks | ||||||||||||||||||||||||||||||||||||||||||||||||
 The top performing Consumer Services sector stocks year to date are
Now, more recently, over last week, the top performing Consumer Services sector stocks on the move are


|
||||||||||||||||||||||||||||||||||||||||||||||||
| 12Stocks.com: Investing in Consumer Services Sector using Exchange Traded Funds | |
|
The following table shows list of key exchange traded funds (ETF) that
help investors track Consumer Services Index. For detailed view, check out our ETF Funds section of our website. Quick View: Move mouse or cursor over ETF symbol (ticker) to view short-term Technical chart and over ETF name to view long term chart. Click on ticker or stock name for detailed view. Click on to add stock symbol to your watchlist and to view watchlist. |
12Stocks.com List of ETFs that track Consumer Services Index
| Ticker | ETF Name | Watchlist | Recent Price | Smart Investing & Trading Score | Change % | Week % | Year-to-date % |
| XLY | Consumer Discret Sel | | 172.54 | 58 | 1.19 | 1.64 | -3.51% |
| RTH | Retail | | 200.49 | 58 | 0.15 | 0.94 | 6.51% |
| IYC | Consumer Services | | 77.59 | 51 | 1.27 | 1.73 | 2.4% |
| XRT | Retail | | 73.04 | 70 | 2.20 | 2.63 | 1% |
| IYK | Consumer Goods | | 66.54 | 100 | 0.18 | 1.11 | 4.13% |
| UCC | Consumer Services | | 32.68 | 45 | 1.64 | 3.49 | -8.99% |
| RETL | Retail Bull 3X | | 8.73 | 70 | 5.95 | 7.51 | -4.28% |
| RXI | Globl Consumer Discretionary | | 159.29 | 58 | 1.23 | 1.36 | 0.14% |
| SCC | Short Consumer Services | | 16.43 | 42 | -2.23 | -3.12 | 7.19% |
| UGE | Consumer Goods | | 17.03 | 80 | 0.29 | 2.42 | 8.19% |
| 12Stocks.com: Charts, Trends, Fundamental Data and Performances of Consumer Services Stocks | |
|
We now take in-depth look at all Consumer Services stocks including charts, multi-period performances and overall trends (as measured by Smart Investing & Trading Score). One can sort Consumer Services stocks (click link to choose) by Daily, Weekly and by Year-to-Date performances. Also, one can sort by size of the company or by market capitalization. |
| Select Your Default Chart Type: | |||||
| |||||
| Click on stock symbol or name for detailed view. Click on to add stock symbol to your watchlist and to view watchlist. Quick View: Move mouse or cursor over "Daily" to quickly view daily Technical stock chart and over "Weekly" to view weekly Technical stock chart. | |||||

 | WMT Walmart Inc. |
| Sector: Services & Goods | |
| SubSector: Discount, Variety Stores | |
| MarketCap: 355610 Millions | |
| Recent Price: 59.09 Smart Investing & Trading Score: 34 | |
| Day Percent Change: -1.75% Day Change: -1.05 | |
| Week Change: -0.74% Year-to-date Change: 12.5% | |
| WMT Links: Profile News Message Board | |
| Charts:- Daily , Weekly | |
| Add WMT to Watchlist: View: Get Complete WMT Trend Analysis ➞ | |
 | BJ BJ s Wholesale Club Holdings, Inc. |
| Sector: Services & Goods | |
| SubSector: Discount, Variety Stores | |
| MarketCap: 3346.02 Millions | |
| Recent Price: 74.92 Smart Investing & Trading Score: 68 | |
| Day Percent Change: 1.22% Day Change: 0.90 | |
| Week Change: 1.6% Year-to-date Change: 12.4% | |
| BJ Links: Profile News Message Board | |
| Charts:- Daily , Weekly | |
| Add BJ to Watchlist: View: Get Complete BJ Trend Analysis ➞ | |
 | TW Tradeweb Markets Inc. |
| Sector: Services & Goods | |
| SubSector: Management Services | |
| MarketCap: 9913.35 Millions | |
| Recent Price: 101.83 Smart Investing & Trading Score: 59 | |
| Day Percent Change: 0.21% Day Change: 0.21 | |
| Week Change: 0.79% Year-to-date Change: 12.1% | |
| TW Links: Profile News Message Board | |
| Charts:- Daily , Weekly | |
| Add TW to Watchlist: View: Get Complete TW Trend Analysis ➞ | |
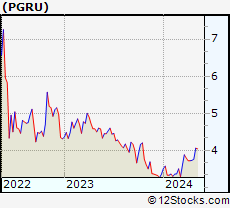 | PGRU PropertyGuru Group Limited |
| Sector: Services & Goods | |
| SubSector: Internet Content & Information | |
| MarketCap: 720 Millions | |
| Recent Price: 3.75 Smart Investing & Trading Score: 83 | |
| Day Percent Change: 3.02% Day Change: 0.11 | |
| Week Change: 0.54% Year-to-date Change: 11.8% | |
| PGRU Links: Profile News Message Board | |
| Charts:- Daily , Weekly | |
| Add PGRU to Watchlist: View: Get Complete PGRU Trend Analysis ➞ | |
 | MSC Studio City International Holdings Limited |
| Sector: Services & Goods | |
| SubSector: Resorts & Casinos | |
| MarketCap: 1420.54 Millions | |
| Recent Price: 7.23 Smart Investing & Trading Score: 36 | |
| Day Percent Change: -3.46% Day Change: -0.26 | |
| Week Change: -3.47% Year-to-date Change: 11.6% | |
| MSC Links: Profile News Message Board | |
| Charts:- Daily , Weekly | |
| Add MSC to Watchlist: View: Get Complete MSC Trend Analysis ➞ | |
 | J Jacobs Engineering Group Inc. |
| Sector: Services & Goods | |
| SubSector: Technical Services | |
| MarketCap: 9714.8 Millions | |
| Recent Price: 144.63 Smart Investing & Trading Score: 63 | |
| Day Percent Change: 0.36% Day Change: 0.52 | |
| Week Change: 0.56% Year-to-date Change: 11.4% | |
| J Links: Profile News Message Board | |
| Charts:- Daily , Weekly | |
| Add J to Watchlist: View: Get Complete J Trend Analysis ➞ | |
 | EAT Brinker International, Inc. |
| Sector: Services & Goods | |
| SubSector: Restaurants | |
| MarketCap: 435.97 Millions | |
| Recent Price: 48.00 Smart Investing & Trading Score: 100 | |
| Day Percent Change: 3.87% Day Change: 1.79 | |
| Week Change: 6.12% Year-to-date Change: 11.2% | |
| EAT Links: Profile News Message Board | |
| Charts:- Daily , Weekly | |
| Add EAT to Watchlist: View: Get Complete EAT Trend Analysis ➞ | |
 | HGV Hilton Grand Vacations Inc. |
| Sector: Services & Goods | |
| SubSector: Resorts & Casinos | |
| MarketCap: 1333.04 Millions | |
| Recent Price: 44.64 Smart Investing & Trading Score: 68 | |
| Day Percent Change: 1.87% Day Change: 0.82 | |
| Week Change: 3.31% Year-to-date Change: 11.1% | |
| HGV Links: Profile News Message Board | |
| Charts:- Daily , Weekly | |
| Add HGV to Watchlist: View: Get Complete HGV Trend Analysis ➞ | |
 | EDR Endeavor Group Holdings, Inc. |
| Sector: Services & Goods | |
| SubSector: Entertainment | |
| MarketCap: 11310 Millions | |
| Recent Price: 26.35 Smart Investing & Trading Score: 43 | |
| Day Percent Change: -0.26% Day Change: -0.07 | |
| Week Change: -0.57% Year-to-date Change: 11.0% | |
| EDR Links: Profile News Message Board | |
| Charts:- Daily , Weekly | |
| Add EDR to Watchlist: View: Get Complete EDR Trend Analysis ➞ | |
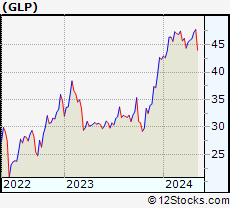 | GLP Global Partners LP |
| Sector: Services & Goods | |
| SubSector: Basic Materials Wholesale | |
| MarketCap: 416.73 Millions | |
| Recent Price: 46.95 Smart Investing & Trading Score: 75 | |
| Day Percent Change: 1.54% Day Change: 0.71 | |
| Week Change: 1.84% Year-to-date Change: 11.0% | |
| GLP Links: Profile News Message Board | |
| Charts:- Daily , Weekly | |
| Add GLP to Watchlist: View: Get Complete GLP Trend Analysis ➞ | |
 | CPRT Copart, Inc. |
| Sector: Services & Goods | |
| SubSector: Auto Dealerships | |
| MarketCap: 15462.1 Millions | |
| Recent Price: 54.31 Smart Investing & Trading Score: 58 | |
| Day Percent Change: 1.89% Day Change: 1.01 | |
| Week Change: 2.7% Year-to-date Change: 10.8% | |
| CPRT Links: Profile News Message Board | |
| Charts:- Daily , Weekly | |
| Add CPRT to Watchlist: View: Get Complete CPRT Trend Analysis ➞ | |
 | CTAS Cintas Corporation |
| Sector: Services & Goods | |
| SubSector: Business Services | |
| MarketCap: 20154.6 Millions | |
| Recent Price: 666.33 Smart Investing & Trading Score: 51 | |
| Day Percent Change: 0.20% Day Change: 1.33 | |
| Week Change: 0.76% Year-to-date Change: 10.6% | |
| CTAS Links: Profile News Message Board | |
| Charts:- Daily , Weekly | |
| Add CTAS to Watchlist: View: Get Complete CTAS Trend Analysis ➞ | |
 | OUT Outfront Media Inc. |
| Sector: Services & Goods | |
| SubSector: Marketing Services | |
| MarketCap: 1388.15 Millions | |
| Recent Price: 15.42 Smart Investing & Trading Score: 68 | |
| Day Percent Change: 2.05% Day Change: 0.31 | |
| Week Change: 3.98% Year-to-date Change: 10.5% | |
| OUT Links: Profile News Message Board | |
| Charts:- Daily , Weekly | |
| Add OUT to Watchlist: View: Get Complete OUT Trend Analysis ➞ | |
 | KELYA Kelly Services, Inc. |
| Sector: Services & Goods | |
| SubSector: Staffing & Outsourcing Services | |
| MarketCap: 587.228 Millions | |
| Recent Price: 23.88 Smart Investing & Trading Score: 63 | |
| Day Percent Change: 1.27% Day Change: 0.30 | |
| Week Change: 0.72% Year-to-date Change: 10.5% | |
| KELYA Links: Profile News Message Board | |
| Charts:- Daily , Weekly | |
| Add KELYA to Watchlist: View: Get Complete KELYA Trend Analysis ➞ | |
 | FWONK Formula One Group |
| Sector: Services & Goods | |
| SubSector: Broadcasting - TV | |
| MarketCap: 4677.53 Millions | |
| Recent Price: 69.68 Smart Investing & Trading Score: 100 | |
| Day Percent Change: 1.18% Day Change: 0.81 | |
| Week Change: 2.35% Year-to-date Change: 10.4% | |
| FWONK Links: Profile News Message Board | |
| Charts:- Daily , Weekly | |
| Add FWONK to Watchlist: View: Get Complete FWONK Trend Analysis ➞ | |
 | URBN Urban Outfitters, Inc. |
| Sector: Services & Goods | |
| SubSector: Apparel Stores | |
| MarketCap: 1638.08 Millions | |
| Recent Price: 39.36 Smart Investing & Trading Score: 75 | |
| Day Percent Change: 2.07% Day Change: 0.80 | |
| Week Change: 6.44% Year-to-date Change: 10.3% | |
| URBN Links: Profile News Message Board | |
| Charts:- Daily , Weekly | |
| Add URBN to Watchlist: View: Get Complete URBN Trend Analysis ➞ | |
 | DDS Dillard s, Inc. |
| Sector: Services & Goods | |
| SubSector: Department Stores | |
| MarketCap: 1170.82 Millions | |
| Recent Price: 444.10 Smart Investing & Trading Score: 100 | |
| Day Percent Change: 6.45% Day Change: 26.89 | |
| Week Change: 8.73% Year-to-date Change: 10.0% | |
| DDS Links: Profile News Message Board | |
| Charts:- Daily , Weekly | |
| Add DDS to Watchlist: View: Get Complete DDS Trend Analysis ➞ | |
 | IHG InterContinental Hotels Group PLC |
| Sector: Services & Goods | |
| SubSector: Lodging | |
| MarketCap: 6387.46 Millions | |
| Recent Price: 100.13 Smart Investing & Trading Score: 73 | |
| Day Percent Change: 1.89% Day Change: 1.86 | |
| Week Change: 2.81% Year-to-date Change: 9.8% | |
| IHG Links: Profile News Message Board | |
| Charts:- Daily , Weekly | |
| Add IHG to Watchlist: View: Get Complete IHG Trend Analysis ➞ | |
 | RBA Ritchie Bros. Auctioneers Incorporated |
| Sector: Services & Goods | |
| SubSector: Business Services | |
| MarketCap: 3491.02 Millions | |
| Recent Price: 73.24 Smart Investing & Trading Score: 63 | |
| Day Percent Change: 0.58% Day Change: 0.42 | |
| Week Change: 0.87% Year-to-date Change: 9.5% | |
| RBA Links: Profile News Message Board | |
| Charts:- Daily , Weekly | |
| Add RBA to Watchlist: View: Get Complete RBA Trend Analysis ➞ | |
 | DBI Designer Brands Inc. |
| Sector: Services & Goods | |
| SubSector: Apparel Stores | |
| MarketCap: 467.308 Millions | |
| Recent Price: 9.69 Smart Investing & Trading Score: 75 | |
| Day Percent Change: 9.49% Day Change: 0.84 | |
| Week Change: 10.24% Year-to-date Change: 9.5% | |
| DBI Links: Profile News Message Board | |
| Charts:- Daily , Weekly | |
| Add DBI to Watchlist: View: Get Complete DBI Trend Analysis ➞ | |
 | COST Costco Wholesale Corporation |
| Sector: Services & Goods | |
| SubSector: Discount, Variety Stores | |
| MarketCap: 136355 Millions | |
| Recent Price: 722.68 Smart Investing & Trading Score: 80 | |
| Day Percent Change: 1.01% Day Change: 7.22 | |
| Week Change: 1.86% Year-to-date Change: 9.5% | |
| COST Links: Profile News Message Board | |
| Charts:- Daily , Weekly | |
| Add COST to Watchlist: View: Get Complete COST Trend Analysis ➞ | |
 | AEO American Eagle Outfitters, Inc. |
| Sector: Services & Goods | |
| SubSector: Apparel Stores | |
| MarketCap: 1577.08 Millions | |
| Recent Price: 23.14 Smart Investing & Trading Score: 63 | |
| Day Percent Change: 2.75% Day Change: 0.62 | |
| Week Change: 3.4% Year-to-date Change: 9.4% | |
| AEO Links: Profile News Message Board | |
| Charts:- Daily , Weekly | |
| Add AEO to Watchlist: View: Get Complete AEO Trend Analysis ➞ | |
 | PK Park Hotels & Resorts Inc. |
| Sector: Services & Goods | |
| SubSector: Lodging | |
| MarketCap: 2221.06 Millions | |
| Recent Price: 16.73 Smart Investing & Trading Score: 63 | |
| Day Percent Change: 2.32% Day Change: 0.38 | |
| Week Change: 3.59% Year-to-date Change: 9.4% | |
| PK Links: Profile News Message Board | |
| Charts:- Daily , Weekly | |
| Add PK to Watchlist: View: Get Complete PK Trend Analysis ➞ | |
 | PTVE Pactiv Evergreen Inc. |
| Sector: Services & Goods | |
| SubSector: Packaging & Containers | |
| MarketCap: 33427 Millions | |
| Recent Price: 15.00 Smart Investing & Trading Score: 93 | |
| Day Percent Change: 2.04% Day Change: 0.30 | |
| Week Change: 4.09% Year-to-date Change: 9.3% | |
| PTVE Links: Profile News Message Board | |
| Charts:- Daily , Weekly | |
| Add PTVE to Watchlist: View: Get Complete PTVE Trend Analysis ➞ | |
 | KRT Karat Packaging Inc. |
| Sector: Services & Goods | |
| SubSector: Packaging & Containers | |
| MarketCap: 357 Millions | |
| Recent Price: 27.19 Smart Investing & Trading Score: 51 | |
| Day Percent Change: 3.23% Day Change: 0.85 | |
| Week Change: 1.34% Year-to-date Change: 9.2% | |
| KRT Links: Profile News Message Board | |
| Charts:- Daily , Weekly | |
| Add KRT to Watchlist: View: Get Complete KRT Trend Analysis ➞ | |
| For tabular summary view of above stock list: Summary View ➞ 0 - 25 , 25 - 50 , 50 - 75 , 75 - 100 , 100 - 125 , 125 - 150 , 150 - 175 , 175 - 200 , 200 - 225 , 225 - 250 , 250 - 275 , 275 - 300 , 300 - 325 , 325 - 350 , 350 - 375 , 375 - 400 , 400 - 425 , 425 - 450 , 450 - 475 | ||
| Click To Change The Sort Order: By Market Cap or Company Size Performance: Year-to-date, Week and Day | |
| Select Chart Type: | ||
|
Best Stocks Today 12Stocks.com |
© 2024 12Stocks.com Terms & Conditions Privacy Contact Us
All Information Provided Only For Education And Not To Be Used For Investing or Trading. See Terms & Conditions


One More Thing ... Get Best Stocks Delivered Daily!
Never Ever Miss A Move With Our Top Ten Stocks Lists
Find Best Stocks In Any Market - Bull or Bear Market
Take A Peek At Our Top Ten Stocks Lists: Daily, Weekly, Year-to-Date & Top Trends
Find Best Stocks In Any Market - Bull or Bear Market
Take A Peek At Our Top Ten Stocks Lists: Daily, Weekly, Year-to-Date & Top Trends
Consumer Services Stocks With Best Up Trends [0-bearish to 100-bullish]: Hibbett Sports[100], Gannett Co[100], MYT Netherlands[100], Dillard s[100], Napco Security[100], Lands [100], MINISO [100], Brinker [100], Boot Barn[100], Cheesecake Factory[100], Deluxe [100]
Best Consumer Services Stocks Year-to-Date:
U Power[2801.79%], Vroom [1827.73%], Yatsen Holding[437.18%], Fluent [289.55%], Codere Online[134.25%], Research[101.58%], Sweetgreen [96.9%], RealReal [71.64%], Bright Scholar[64.8%], Spotify Technology[61.41%], PaySign [59.64%] Best Consumer Services Stocks This Week:
Hibbett Sports[21.1%], Noodles & [17.65%], Jumia Technologies[17.51%], Allbirds [15.68%], DoubleDown Interactive[15.06%], Pinduoduo [12.8%], MYT Netherlands[12.01%], China Online[11.9%], iHeartMedia [11.58%], Zumiez [11.4%], Ameresco [11.12%] Best Consumer Services Stocks Daily:
Hibbett Sports[18.84%], SES AI[12.17%], Golden Heaven[11.75%], Spotify Technology[11.41%], Jumia Technologies[11.30%], Sweetgreen [9.50%], Designer Brands[9.49%], Ameresco [9.43%], China Online[9.37%], iHeartMedia [9.00%], Noodles & [8.95%]