
 Login Sign Up


| |||||
 |  | ||||

| 12Stocks.com Market Intelligence |
Best Consumer Services Stocks
| In a hurry? Services & Goods Stocks: Performance Trends Table, Stock Charts
Sort Consumer Services: Daily, Weekly, Year-to-Date, Market Cap & Trends. Filter Services & Goods stocks list by size: All Large Mid-Range Small |
| 12Stocks.com Consumer Services Stocks Performances & Trends Daily | |||||||||
|
|  The overall Smart Investing & Trading Score is 100 (0-bearish to 100-bullish) which puts Consumer Services sector in short term bullish trend. The Smart Investing & Trading Score from previous trading session is 65 and an improvement of trend continues.
| ||||||||
Here are the Smart Investing & Trading Scores of the most requested Consumer Services stocks at 12Stocks.com (click stock name for detailed review):
|


| Consider signing up for our daily 12Stocks.com "Best Stocks Newsletter". You will never ever miss a big stock move again! |
| 12Stocks.com: Investing in Consumer Services sector with Stocks | |
|
The following table helps investors and traders sort through current performance and trends (as measured by Smart Investing & Trading Score) of various
stocks in the Consumer Services sector. Quick View: Move mouse or cursor over stock symbol (ticker) to view short-term Technical chart and over stock name to view long term chart. Click on  to add stock symbol to your watchlist and to add stock symbol to your watchlist and  to view watchlist. Click on any ticker or stock name for detailed market intelligence report for that stock. to view watchlist. Click on any ticker or stock name for detailed market intelligence report for that stock. |
12Stocks.com Performance of Stocks in Consumer Services Sector
| Ticker | Stock Name | Watchlist | Category | Recent Price | Smart Investing & Trading Score | Change % | YTD Change% |
| KTOS | Kratos Defense |   | Security | 51.71 | 100 | 11.76 | 96.02% |
| AMC | AMC Entertainment | | Entertainment | 3.33 | 100 | 11.00 | -16.33% |
| PSMT | PriceSmart | | Retail | 108.17 | 90 | 5.33 | 18.18% |
| AAP | Advance Auto | | Auto Parts | 62.56 | 100 | 4.97 | 34.05% |
| PFGC | Performance Food | | Restaurants | 94.81 | 100 | 4.84 | 12.13% |
| CIX | CompX | | Security | 27.08 | 80 | 4.84 | 4.96% |
| TDUP | ThredUp | | Internet Retail | 7.08 | 63 | 3.66 | 409.35% |
| ACTG | Acacia Research | | Services | 3.97 | 100 | 3.39 | -8.53% |
| UHG | United Homes | | Residential Construction | 3.09 | 68 | 3.34 | -26.95% |
| GO | Grocery Outlet | | Grocery | 13.27 | 52 | 3.03 | -14.99% |
| IMAX | IMAX | | Entertainment | 26.93 | 51 | 2.90 | 5.20% |
| DBI | Designer Brands | | Apparel | 3.12 | 100 | 2.63 | -40.83% |
| BKR | Baker Hughes | | Services | 40.70 | 100 | 2.49 | -0.30% |
| APEI | American Public | | Education | 31.72 | 95 | 2.36 | 47.06% |
| CURV | Torrid | | Apparel Retail | 3.04 | 32 | 2.01 | -41.87% |
| PLNT | Planet Fitness | | Sporting | 110.43 | 95 | 1.99 | 11.69% |
| NCMI | National CineMedia | | Marketing | 4.86 | 42 | 1.89 | -26.42% |
| WH | Wyndham Hotels | | Lodging | 91.00 | 100 | 1.86 | -9.30% |
| WLDN | Willdan | | Services | 73.92 | 83 | 1.72 | 94.07% |
| QS | QuantumScape | | Auto Parts | 9.23 | 95 | 1.54 | 77.84% |
| ANF | Abercrombie & Fitch Co | | Apparel | 89.34 | 90 | 1.25 | -40.23% |
| AMZN | Amazon.com | | Retail | 225.02 | 100 | 1.24 | 2.57% |
| HGV | Hilton Grand | | Casinos | 48.53 | 100 | 1.17 | 24.60% |
| AMRC | Ameresco | | Services | 17.96 | 100 | 1.13 | -23.51% |
| GWW | W.W. Grainger | | Equipment | 1059.49 | 88 | 1.11 | 0.72% |
| For chart view version of above stock list: Chart View ➞ 0 - 25 , 25 - 50 , 50 - 75 , 75 - 100 , 100 - 125 , 125 - 150 , 150 - 175 , 175 - 200 , 200 - 225 , 225 - 250 , 250 - 275 , 275 - 300 , 300 - 325 , 325 - 350 | ||
 | Click To Change The Sort Order: By Market Cap or Company Size Performance: Year-to-date, Week and Day |  |
|
Get the most comprehensive stock market coverage daily at 12Stocks.com ➞ Best Stocks Today ➞ Best Stocks Weekly ➞ Best Stocks Year-to-Date ➞ Best Stocks Trends ➞  Best Stocks Today 12Stocks.com Best Nasdaq Stocks ➞ Best S&P 500 Stocks ➞ Best Tech Stocks ➞ Best Biotech Stocks ➞ |
| Detailed Overview of Consumer Services Stocks |
| Consumer Services Technical Overview, Leaders & Laggards, Top Consumer Services ETF Funds & Detailed Consumer Services Stocks List, Charts, Trends & More |
| Consumer Services Sector: Technical Analysis, Trends & YTD Performance | |
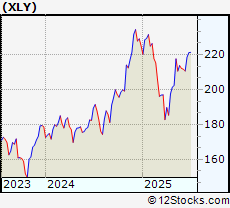
| Consumer Services sector is composed of stocks
from retail, entertainment, media/publishing, consumer goods
and services subsectors. Consumer Services sector, as represented by XLY, an exchange-traded fund [ETF] that holds basket of Consumer Services stocks (e.g, Walmart, Alibaba) is down by -1.03% and is currently underperforming the overall market by -7.34% year-to-date. Below is a quick view of Technical charts and trends: |
|
 XLY Weekly Chart |
|
| Long Term Trend: Very Good | |
| Medium Term Trend: Very Good | |
 XLY Daily Chart |
|
| Short Term Trend: Very Good | |
| Overall Trend Score: 100 | |
| YTD Performance: -1.03% | |
| **Trend Scores & Views Are Only For Educational Purposes And Not For Investing | |
| 12Stocks.com: Top Performing Consumer Services Sector Stocks | ||||||||||||||||||||||||||||||||||||||||||||||||
 The top performing Consumer Services sector stocks year to date are
Now, more recently, over last week, the top performing Consumer Services sector stocks on the move are


|
||||||||||||||||||||||||||||||||||||||||||||||||
| 12Stocks.com: Investing in Consumer Services Sector using Exchange Traded Funds | |
|
The following table shows list of key exchange traded funds (ETF) that
help investors track Consumer Services Index. For detailed view, check out our ETF Funds section of our website. Quick View: Move mouse or cursor over ETF symbol (ticker) to view short-term Technical chart and over ETF name to view long term chart. Click on ticker or stock name for detailed view. Click on to add stock symbol to your watchlist and to view watchlist. |
12Stocks.com List of ETFs that track Consumer Services Index
| Ticker | ETF Name | Watchlist | Recent Price | Smart Investing & Trading Score | Change % | Week % | Year-to-date % |
| XLY | Consumer Discret Sel | | 221.43 | 100 | 0.03 | 0.1 | -1.03% |
| RTH | Retail | | 238.66 | 56 | -0.24 | -0.9 | 6.44% |
| XRT | Retail | | 80.26 | 71 | -0.84 | -0.46 | 1.11% |
| UCC | Consumer Services | | 46.71 | 100 | 0.11 | -0.06 | -9.36% |
| SCC | Short Consumer Services | | 17.11 | 36 | 0.04 | 0.1 | 85.78% |
| UGE | Consumer Goods | | 18.40 | 8 | -0.6 | -3.19 | 2.28% |
| 12Stocks.com: Charts, Trends, Fundamental Data and Performances of Consumer Services Stocks | |
|
We now take in-depth look at all Consumer Services stocks including charts, multi-period performances and overall trends (as measured by Smart Investing & Trading Score). One can sort Consumer Services stocks (click link to choose) by Daily, Weekly and by Year-to-Date performances. Also, one can sort by size of the company or by market capitalization. |
| Select Your Default Chart Type: | |||||
| |||||
| Click on stock symbol or name for detailed view. Click on to add stock symbol to your watchlist and to view watchlist. Quick View: Move mouse or cursor over "Daily" to quickly view daily Technical stock chart and over "Weekly" to view weekly Technical stock chart. | |||||

 | KTOS Kratos Defense & Security Solutions, Inc. |
| Sector: Services & Goods | |
| SubSector: Security & Protection Services | |
| MarketCap: 1369.63 Millions | |
| Recent Price: 51.71 Smart Investing & Trading Score: 100 | |
| Day Percent Change: 11.76% Day Change: 5.44 | |
| Week Change: 15.79% Year-to-date Change: 96.0% | |
| KTOS Links: Profile News Message Board | |
| Charts:- Daily , Weekly | |
| Add KTOS to Watchlist: View: Get Complete KTOS Trend Analysis ➞ | |
 | AMC AMC Entertainment Holdings, Inc. |
| Sector: Services & Goods | |
| SubSector: Movie Production, Theaters | |
| MarketCap: 415.929 Millions | |
| Recent Price: 3.33 Smart Investing & Trading Score: 100 | |
| Day Percent Change: 11% Day Change: 0.33 | |
| Week Change: 12.88% Year-to-date Change: -16.3% | |
| AMC Links: Profile News Message Board | |
| Charts:- Daily , Weekly | |
| Add AMC to Watchlist: View: Get Complete AMC Trend Analysis ➞ | |
 | PSMT PriceSmart, Inc. |
| Sector: Services & Goods | |
| SubSector: Discount, Variety Stores | |
| MarketCap: 1655.72 Millions | |
| Recent Price: 108.17 Smart Investing & Trading Score: 90 | |
| Day Percent Change: 5.33% Day Change: 5.47 | |
| Week Change: 1.46% Year-to-date Change: 18.2% | |
| PSMT Links: Profile News Message Board | |
| Charts:- Daily , Weekly | |
| Add PSMT to Watchlist: View: Get Complete PSMT Trend Analysis ➞ | |
 | AAP Advance Auto Parts, Inc. |
| Sector: Services & Goods | |
| SubSector: Auto Parts Stores | |
| MarketCap: 5977.7 Millions | |
| Recent Price: 62.56 Smart Investing & Trading Score: 100 | |
| Day Percent Change: 4.97% Day Change: 2.96 | |
| Week Change: 21.19% Year-to-date Change: 34.1% | |
| AAP Links: Profile News Message Board | |
| Charts:- Daily , Weekly | |
| Add AAP to Watchlist: View: Get Complete AAP Trend Analysis ➞ | |
 | PFGC Performance Food Group Company |
| Sector: Services & Goods | |
| SubSector: Restaurants | |
| MarketCap: 2457.5 Millions | |
| Recent Price: 94.81 Smart Investing & Trading Score: 100 | |
| Day Percent Change: 4.84% Day Change: 4.38 | |
| Week Change: 6.68% Year-to-date Change: 12.1% | |
| PFGC Links: Profile News Message Board | |
| Charts:- Daily , Weekly | |
| Add PFGC to Watchlist: View: Get Complete PFGC Trend Analysis ➞ | |
 | CIX CompX International Inc. |
| Sector: Services & Goods | |
| SubSector: Security & Protection Services | |
| MarketCap: 189.603 Millions | |
| Recent Price: 27.08 Smart Investing & Trading Score: 80 | |
| Day Percent Change: 4.84% Day Change: 1.25 | |
| Week Change: 2.61% Year-to-date Change: 5.0% | |
| CIX Links: Profile News Message Board | |
| Charts:- Daily , Weekly | |
| Add CIX to Watchlist: View: Get Complete CIX Trend Analysis ➞ | |
 | TDUP ThredUp Inc. |
| Sector: Services & Goods | |
| SubSector: Internet Retail | |
| MarketCap: 258 Millions | |
| Recent Price: 7.08 Smart Investing & Trading Score: 63 | |
| Day Percent Change: 3.66% Day Change: 0.25 | |
| Week Change: -11.5% Year-to-date Change: 409.4% | |
| TDUP Links: Profile News Message Board | |
| Charts:- Daily , Weekly | |
| Add TDUP to Watchlist: View: Get Complete TDUP Trend Analysis ➞ | |
 | ACTG Acacia Research Corporation |
| Sector: Services & Goods | |
| SubSector: Business Services | |
| MarketCap: 112.782 Millions | |
| Recent Price: 3.97 Smart Investing & Trading Score: 100 | |
| Day Percent Change: 3.39% Day Change: 0.13 | |
| Week Change: 6.15% Year-to-date Change: -8.5% | |
| ACTG Links: Profile News Message Board | |
| Charts:- Daily , Weekly | |
| Add ACTG to Watchlist: View: Get Complete ACTG Trend Analysis ➞ | |
 | UHG United Homes Group, Inc. |
| Sector: Services & Goods | |
| SubSector: Residential Construction | |
| MarketCap: 566 Millions | |
| Recent Price: 3.09 Smart Investing & Trading Score: 68 | |
| Day Percent Change: 3.34% Day Change: 0.1 | |
| Week Change: 8.42% Year-to-date Change: -27.0% | |
| UHG Links: Profile News Message Board | |
| Charts:- Daily , Weekly | |
| Add UHG to Watchlist: View: Get Complete UHG Trend Analysis ➞ | |
 | GO Grocery Outlet Holding Corp. |
| Sector: Services & Goods | |
| SubSector: Grocery Stores | |
| MarketCap: 3065.95 Millions | |
| Recent Price: 13.27 Smart Investing & Trading Score: 52 | |
| Day Percent Change: 3.03% Day Change: 0.39 | |
| Week Change: -0.9% Year-to-date Change: -15.0% | |
| GO Links: Profile News Message Board | |
| Charts:- Daily , Weekly | |
| Add GO to Watchlist: View: Get Complete GO Trend Analysis ➞ | |
 | IMAX IMAX Corporation |
| Sector: Services & Goods | |
| SubSector: Entertainment - Diversified | |
| MarketCap: 874.237 Millions | |
| Recent Price: 26.93 Smart Investing & Trading Score: 51 | |
| Day Percent Change: 2.9% Day Change: 0.76 | |
| Week Change: -1.54% Year-to-date Change: 5.2% | |
| IMAX Links: Profile News Message Board | |
| Charts:- Daily , Weekly | |
| Add IMAX to Watchlist: View: Get Complete IMAX Trend Analysis ➞ | |
 | DBI Designer Brands Inc. |
| Sector: Services & Goods | |
| SubSector: Apparel Stores | |
| MarketCap: 467.308 Millions | |
| Recent Price: 3.12 Smart Investing & Trading Score: 100 | |
| Day Percent Change: 2.63% Day Change: 0.08 | |
| Week Change: 2.63% Year-to-date Change: -40.8% | |
| DBI Links: Profile News Message Board | |
| Charts:- Daily , Weekly | |
| Add DBI to Watchlist: View: Get Complete DBI Trend Analysis ➞ | |
 | BKR Baker Hughes Company |
| Sector: Services & Goods | |
| SubSector: Technical Services | |
| MarketCap: 1330 Millions | |
| Recent Price: 40.70 Smart Investing & Trading Score: 100 | |
| Day Percent Change: 2.49% Day Change: 0.99 | |
| Week Change: 2.67% Year-to-date Change: -0.3% | |
| BKR Links: Profile News Message Board | |
| Charts:- Daily , Weekly | |
| Add BKR to Watchlist: View: Get Complete BKR Trend Analysis ➞ | |
 | APEI American Public Education, Inc. |
| Sector: Services & Goods | |
| SubSector: Education & Training Services | |
| MarketCap: 361.306 Millions | |
| Recent Price: 31.72 Smart Investing & Trading Score: 95 | |
| Day Percent Change: 2.36% Day Change: 0.73 | |
| Week Change: 5% Year-to-date Change: 47.1% | |
| APEI Links: Profile News Message Board | |
| Charts:- Daily , Weekly | |
| Add APEI to Watchlist: View: Get Complete APEI Trend Analysis ➞ | |
 | CURV Torrid Holdings Inc. |
| Sector: Services & Goods | |
| SubSector: Apparel Retail | |
| MarketCap: 278 Millions | |
| Recent Price: 3.04 Smart Investing & Trading Score: 32 | |
| Day Percent Change: 2.01% Day Change: 0.06 | |
| Week Change: 4.83% Year-to-date Change: -41.9% | |
| CURV Links: Profile News Message Board | |
| Charts:- Daily , Weekly | |
| Add CURV to Watchlist: View: Get Complete CURV Trend Analysis ➞ | |
 | PLNT Planet Fitness, Inc. |
| Sector: Services & Goods | |
| SubSector: Sporting Activities | |
| MarketCap: 3485.94 Millions | |
| Recent Price: 110.43 Smart Investing & Trading Score: 95 | |
| Day Percent Change: 1.99% Day Change: 2.15 | |
| Week Change: 2.49% Year-to-date Change: 11.7% | |
| PLNT Links: Profile News Message Board | |
| Charts:- Daily , Weekly | |
| Add PLNT to Watchlist: View: Get Complete PLNT Trend Analysis ➞ | |
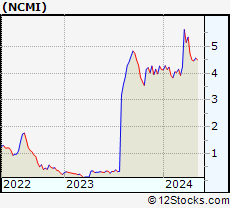 | NCMI National CineMedia, Inc. |
| Sector: Services & Goods | |
| SubSector: Marketing Services | |
| MarketCap: 298.015 Millions | |
| Recent Price: 4.86 Smart Investing & Trading Score: 42 | |
| Day Percent Change: 1.89% Day Change: 0.09 | |
| Week Change: 1.46% Year-to-date Change: -26.4% | |
| NCMI Links: Profile News Message Board | |
| Charts:- Daily , Weekly | |
| Add NCMI to Watchlist: View: Get Complete NCMI Trend Analysis ➞ | |
 | WH Wyndham Hotels & Resorts, Inc. |
| Sector: Services & Goods | |
| SubSector: Lodging | |
| MarketCap: 2656.66 Millions | |
| Recent Price: 91.00 Smart Investing & Trading Score: 100 | |
| Day Percent Change: 1.86% Day Change: 1.66 | |
| Week Change: 7.69% Year-to-date Change: -9.3% | |
| WH Links: Profile News Message Board | |
| Charts:- Daily , Weekly | |
| Add WH to Watchlist: View: Get Complete WH Trend Analysis ➞ | |
 | WLDN Willdan Group, Inc. |
| Sector: Services & Goods | |
| SubSector: Technical Services | |
| MarketCap: 235.61 Millions | |
| Recent Price: 73.92 Smart Investing & Trading Score: 83 | |
| Day Percent Change: 1.72% Day Change: 1.25 | |
| Week Change: 2.24% Year-to-date Change: 94.1% | |
| WLDN Links: Profile News Message Board | |
| Charts:- Daily , Weekly | |
| Add WLDN to Watchlist: View: Get Complete WLDN Trend Analysis ➞ | |
 | QS QuantumScape Corporation |
| Sector: Services & Goods | |
| SubSector: Auto Parts | |
| MarketCap: 13137 Millions | |
| Recent Price: 9.23 Smart Investing & Trading Score: 95 | |
| Day Percent Change: 1.54% Day Change: 0.14 | |
| Week Change: 31.48% Year-to-date Change: 77.8% | |
| QS Links: Profile News Message Board | |
| Charts:- Daily , Weekly | |
| Add QS to Watchlist: View: Get Complete QS Trend Analysis ➞ | |
 | ANF Abercrombie & Fitch Co. |
| Sector: Services & Goods | |
| SubSector: Apparel Stores | |
| MarketCap: 589.108 Millions | |
| Recent Price: 89.34 Smart Investing & Trading Score: 90 | |
| Day Percent Change: 1.25% Day Change: 1.1 | |
| Week Change: -2.47% Year-to-date Change: -40.2% | |
| ANF Links: Profile News Message Board | |
| Charts:- Daily , Weekly | |
| Add ANF to Watchlist: View: Get Complete ANF Trend Analysis ➞ | |
 | AMZN Amazon.com, Inc. |
| Sector: Services & Goods | |
| SubSector: Catalog & Mail Order Houses | |
| MarketCap: 998070 Millions | |
| Recent Price: 225.02 Smart Investing & Trading Score: 100 | |
| Day Percent Change: 1.24% Day Change: 2.76 | |
| Week Change: 0.72% Year-to-date Change: 2.6% | |
| AMZN Links: Profile News Message Board | |
| Charts:- Daily , Weekly | |
| Add AMZN to Watchlist: View: Get Complete AMZN Trend Analysis ➞ | |
 | HGV Hilton Grand Vacations Inc. |
| Sector: Services & Goods | |
| SubSector: Resorts & Casinos | |
| MarketCap: 1333.04 Millions | |
| Recent Price: 48.53 Smart Investing & Trading Score: 100 | |
| Day Percent Change: 1.17% Day Change: 0.56 | |
| Week Change: 8.18% Year-to-date Change: 24.6% | |
| HGV Links: Profile News Message Board | |
| Charts:- Daily , Weekly | |
| Add HGV to Watchlist: View: Get Complete HGV Trend Analysis ➞ | |
 | AMRC Ameresco, Inc. |
| Sector: Services & Goods | |
| SubSector: Technical Services | |
| MarketCap: 898.91 Millions | |
| Recent Price: 17.96 Smart Investing & Trading Score: 100 | |
| Day Percent Change: 1.13% Day Change: 0.2 | |
| Week Change: 6.84% Year-to-date Change: -23.5% | |
| AMRC Links: Profile News Message Board | |
| Charts:- Daily , Weekly | |
| Add AMRC to Watchlist: View: Get Complete AMRC Trend Analysis ➞ | |
 | GWW W.W. Grainger, Inc. |
| Sector: Services & Goods | |
| SubSector: Industrial Equipment Wholesale | |
| MarketCap: 12794.8 Millions | |
| Recent Price: 1059.49 Smart Investing & Trading Score: 88 | |
| Day Percent Change: 1.11% Day Change: 11.62 | |
| Week Change: 0.86% Year-to-date Change: 0.7% | |
| GWW Links: Profile News Message Board | |
| Charts:- Daily , Weekly | |
| Add GWW to Watchlist: View: Get Complete GWW Trend Analysis ➞ | |
| For tabular summary view of above stock list: Summary View ➞ 0 - 25 , 25 - 50 , 50 - 75 , 75 - 100 , 100 - 125 , 125 - 150 , 150 - 175 , 175 - 200 , 200 - 225 , 225 - 250 , 250 - 275 , 275 - 300 , 300 - 325 , 325 - 350 | ||
| Click To Change The Sort Order: By Market Cap or Company Size Performance: Year-to-date, Week and Day | |
| Select Chart Type: | ||
|
Best Stocks Today 12Stocks.com |
© 2025 12Stocks.com Terms & Conditions Privacy Contact Us
All Information Provided Only For Education And Not To Be Used For Investing or Trading. See Terms & Conditions


One More Thing ... Get Best Stocks Delivered Daily!
Never Ever Miss A Move With Our Top Ten Stocks Lists
Find Best Stocks In Any Market - Bull or Bear Market
Take A Peek At Our Top Ten Stocks Lists: Daily, Weekly, Year-to-Date & Top Trends
Find Best Stocks In Any Market - Bull or Bear Market
Take A Peek At Our Top Ten Stocks Lists: Daily, Weekly, Year-to-Date & Top Trends
Consumer Services Stocks With Best Up Trends [0-bearish to 100-bullish]: Kratos Defense[100], AMC Entertainment[100], Advance Auto[100], Performance Food[100], Acacia Research[100], Designer Brands[100], Baker Hughes[100], Wyndham Hotels[100], Amazon.com [100], Hilton Grand[100], Ameresco [100]
Best Consumer Services Stocks Year-to-Date:
ThredUp [409.35%], PaySign [159.93%], National Vision[134.74%], Kratos Defense[96.02%], Willdan [94.07%], Super [85.33%], Roblox [82.67%], QuantumScape [77.84%], Gray Television[73.46%], E.W. Scripps[70.14%], Carvana Co[69%] Best Consumer Services Stocks This Week:
QuantumScape [31.48%], Advance Auto[21.19%], Kratos Defense[15.79%], WNS ()[14.26%], E.W. Scripps[13.25%], AMC Entertainment[12.88%], Jack in[11.68%], Gray Television[8.94%], United Homes[8.42%], Dream Finders[8.35%], Hilton Grand[8.18%] Best Consumer Services Stocks Daily:
Kratos Defense[11.76%], AMC Entertainment[11%], PriceSmart [5.33%], Advance Auto[4.97%], Performance Food[4.84%], CompX [4.84%], ThredUp [3.66%], Acacia Research[3.39%], United Homes[3.34%], Grocery Outlet[3.03%], IMAX [2.9%]