
 Login Sign Up


| |||||
 |  | ||||

| 12Stocks.com Market Intelligence |
Best Consumer Services Stocks
| In a hurry? Services & Goods Stocks: Performance Trends Table, Stock Charts
Sort Consumer Services: Daily, Weekly, Year-to-Date, Market Cap & Trends. Filter Services & Goods stocks list by size: All Large Mid-Range Small |
| 12Stocks.com Consumer Services Stocks Performances & Trends Daily | |||||||||
|
|  The overall Smart Investing & Trading Score is 58 (0-bearish to 100-bullish) which puts Consumer Services sector in short term neutral trend. The Smart Investing & Trading Score from previous trading session is 23 and an improvement of trend continues.
| ||||||||
Here are the Smart Investing & Trading Scores of the most requested Consumer Services stocks at 12Stocks.com (click stock name for detailed review):
|


| Consider signing up for our daily 12Stocks.com "Best Stocks Newsletter". You will never ever miss a big stock move again! |
| 12Stocks.com: Investing in Consumer Services sector with Stocks | |
|
The following table helps investors and traders sort through current performance and trends (as measured by Smart Investing & Trading Score) of various
stocks in the Consumer Services sector. Quick View: Move mouse or cursor over stock symbol (ticker) to view short-term Technical chart and over stock name to view long term chart. Click on  to add stock symbol to your watchlist and to add stock symbol to your watchlist and  to view watchlist. Click on any ticker or stock name for detailed market intelligence report for that stock. to view watchlist. Click on any ticker or stock name for detailed market intelligence report for that stock. |
12Stocks.com Performance of Stocks in Consumer Services Sector
| Ticker | Stock Name | Watchlist | Category | Recent Price | Smart Investing & Trading Score | Change % | YTD Change% |
| ACVA | ACV Auctions |   | Auto & Truck Dealerships | 18.22 | 71 | -0.74 | 20.95% |
| PENN | Penn National | | Casinos | 17.30 | 57 | -0.75 | -33.51% |
| CAKE | Cheesecake Factory | | Restaurants | 35.21 | 100 | -0.76 | 0.57% |
| CRAI | CRA | | Services | 147.91 | 90 | -0.76 | 49.63% |
| CAVA | CAVA | | Restaurants | 60.73 | 68 | -0.76 | 39.66% |
| MCO | Moody s | | Services | 379.19 | 42 | -0.78 | -2.91% |
| AEO | American Eagle | | Apparel | 22.96 | 58 | -0.78 | 8.51% |
| SIRI | Sirius XM | | Broadcasting | 3.13 | 42 | -0.79 | -42.69% |
| PZZA | Papa John | | Restaurants | 63.74 | 64 | -0.80 | -16.38% |
| CURV | Torrid | | Apparel Retail | 4.98 | 69 | -0.80 | -14.87% |
| VRSK | Verisk Analytics | | Services | 220.37 | 28 | -0.85 | -7.74% |
| BLMN | Bloomin | | Restaurants | 27.06 | 85 | -0.86 | -3.87% |
| M | Macy s | | Department | 18.85 | 83 | -0.89 | -6.31% |
| ALLE | Allegion | | Security | 125.83 | 58 | -0.90 | -0.68% |
| RRGB | Red Robin | | Restaurants | 6.54 | 64 | -0.91 | -47.55% |
| RH | RH | | Retail | 246.26 | 42 | -0.92 | -15.51% |
| IGT | Game | | Gaming | 20.32 | 49 | -0.93 | -25.87% |
| BH | Biglari | | Restaurants | 200.07 | 95 | -0.94 | 21.30% |
| FUN | Cedar Fair | | Entertainment | 38.26 | 25 | -0.97 | -3.88% |
| QS | QuantumScape | | Auto Parts | 5.54 | 52 | -0.98 | -20.36% |
| MED | Medifast | | Retail | 33.09 | 74 | -0.99 | -50.77% |
| KFY | Korn Ferry | | Staffing | 62.55 | 83 | -1.01 | 5.39% |
| TBI | TrueBlue | | Staffing | 10.76 | 52 | -1.01 | -29.86% |
| PAYS | PaySign | | Services | 4.42 | 88 | -1.01 | 58.04% |
| VSCO | Victorias Secret | | Apparel Retail | 17.39 | 42 | -1.02 | -34.67% |
| For chart view version of above stock list: Chart View ➞ 0 - 25 , 25 - 50 , 50 - 75 , 75 - 100 , 100 - 125 , 125 - 150 , 150 - 175 , 175 - 200 , 200 - 225 , 225 - 250 , 250 - 275 , 275 - 300 , 300 - 325 , 325 - 350 , 350 - 375 , 375 - 400 , 400 - 425 | ||
 | Click To Change The Sort Order: By Market Cap or Company Size Performance: Year-to-date, Week and Day |  |
|
Get the most comprehensive stock market coverage daily at 12Stocks.com ➞ Best Stocks Today ➞ Best Stocks Weekly ➞ Best Stocks Year-to-Date ➞ Best Stocks Trends ➞  Best Stocks Today 12Stocks.com Best Nasdaq Stocks ➞ Best S&P 500 Stocks ➞ Best Tech Stocks ➞ Best Biotech Stocks ➞ |
| Detailed Overview of Consumer Services Stocks |
| Consumer Services Technical Overview, Leaders & Laggards, Top Consumer Services ETF Funds & Detailed Consumer Services Stocks List, Charts, Trends & More |
| Consumer Services Sector: Technical Analysis, Trends & YTD Performance | |
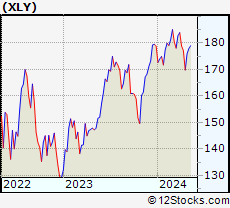
| Consumer Services sector is composed of stocks
from retail, entertainment, media/publishing, consumer goods
and services subsectors. Consumer Services sector, as represented by XLY, an exchange-traded fund [ETF] that holds basket of Consumer Services stocks (e.g, Walmart, Alibaba) is down by -2.61% and is currently underperforming the overall market by -7.95% year-to-date. Below is a quick view of Technical charts and trends: |
|
 XLY Weekly Chart |
|
| Long Term Trend: Good | |
| Medium Term Trend: Not Good | |
 XLY Daily Chart |
|
| Short Term Trend: Very Good | |
| Overall Trend Score: 58 | |
| YTD Performance: -2.61% | |
| **Trend Scores & Views Are Only For Educational Purposes And Not For Investing | |
| 12Stocks.com: Top Performing Consumer Services Sector Stocks | ||||||||||||||||||||||||||||||||||||||||||||||||
 The top performing Consumer Services sector stocks year to date are
Now, more recently, over last week, the top performing Consumer Services sector stocks on the move are


|
||||||||||||||||||||||||||||||||||||||||||||||||
| 12Stocks.com: Investing in Consumer Services Sector using Exchange Traded Funds | |
|
The following table shows list of key exchange traded funds (ETF) that
help investors track Consumer Services Index. For detailed view, check out our ETF Funds section of our website. Quick View: Move mouse or cursor over ETF symbol (ticker) to view short-term Technical chart and over ETF name to view long term chart. Click on ticker or stock name for detailed view. Click on to add stock symbol to your watchlist and to view watchlist. |
12Stocks.com List of ETFs that track Consumer Services Index
| Ticker | ETF Name | Watchlist | Recent Price | Smart Investing & Trading Score | Change % | Week % | Year-to-date % |
| XLY | Consumer Discret Sel | | 174.14 | 58 | 0.93 | 2.58 | -2.61% |
| RTH | Retail | | 200.56 | 58 | 0.03 | 0.97 | 6.55% |
| XRT | Retail | | 72.48 | 65 | -0.76 | 1.85 | 0.23% |
| UCC | Consumer Services | | 33.37 | 73 | 2.12 | 5.68 | -7.07% |
| SCC | Short Consumer Services | | 16.06 | 35 | -2.22 | -5.27 | 4.8% |
| UGE | Consumer Goods | | 17.02 | 73 | -0.09 | 2.33 | 8.09% |
| 12Stocks.com: Charts, Trends, Fundamental Data and Performances of Consumer Services Stocks | |
|
We now take in-depth look at all Consumer Services stocks including charts, multi-period performances and overall trends (as measured by Smart Investing & Trading Score). One can sort Consumer Services stocks (click link to choose) by Daily, Weekly and by Year-to-Date performances. Also, one can sort by size of the company or by market capitalization. |
| Select Your Default Chart Type: | |||||
| |||||
| Click on stock symbol or name for detailed view. Click on to add stock symbol to your watchlist and to view watchlist. Quick View: Move mouse or cursor over "Daily" to quickly view daily Technical stock chart and over "Weekly" to view weekly Technical stock chart. | |||||

 | ACVA ACV Auctions Inc. |
| Sector: Services & Goods | |
| SubSector: Auto & Truck Dealerships | |
| MarketCap: 2680 Millions | |
| Recent Price: 18.22 Smart Investing & Trading Score: 71 | |
| Day Percent Change: -0.74% Day Change: -0.14 | |
| Week Change: 5.23% Year-to-date Change: 21.0% | |
| ACVA Links: Profile News Message Board | |
| Charts:- Daily , Weekly | |
| Add ACVA to Watchlist: View: Get Complete ACVA Trend Analysis ➞ | |
 | PENN Penn National Gaming, Inc. |
| Sector: Services & Goods | |
| SubSector: Resorts & Casinos | |
| MarketCap: 1183.84 Millions | |
| Recent Price: 17.30 Smart Investing & Trading Score: 57 | |
| Day Percent Change: -0.75% Day Change: -0.13 | |
| Week Change: 4.59% Year-to-date Change: -33.5% | |
| PENN Links: Profile News Message Board | |
| Charts:- Daily , Weekly | |
| Add PENN to Watchlist: View: Get Complete PENN Trend Analysis ➞ | |
 | CAKE The Cheesecake Factory Incorporated |
| Sector: Services & Goods | |
| SubSector: Restaurants | |
| MarketCap: 829 Millions | |
| Recent Price: 35.21 Smart Investing & Trading Score: 100 | |
| Day Percent Change: -0.76% Day Change: -0.27 | |
| Week Change: 3.56% Year-to-date Change: 0.6% | |
| CAKE Links: Profile News Message Board | |
| Charts:- Daily , Weekly | |
| Add CAKE to Watchlist: View: Get Complete CAKE Trend Analysis ➞ | |
 | CRAI CRA International, Inc. |
| Sector: Services & Goods | |
| SubSector: Management Services | |
| MarketCap: 209.645 Millions | |
| Recent Price: 147.91 Smart Investing & Trading Score: 90 | |
| Day Percent Change: -0.76% Day Change: -1.14 | |
| Week Change: 1.55% Year-to-date Change: 49.6% | |
| CRAI Links: Profile News Message Board | |
| Charts:- Daily , Weekly | |
| Add CRAI to Watchlist: View: Get Complete CRAI Trend Analysis ➞ | |
 | CAVA CAVA Group, Inc. |
| Sector: Services & Goods | |
| SubSector: Restaurants | |
| MarketCap: 4510 Millions | |
| Recent Price: 60.73 Smart Investing & Trading Score: 68 | |
| Day Percent Change: -0.76% Day Change: -0.46 | |
| Week Change: 1.77% Year-to-date Change: 39.7% | |
| CAVA Links: Profile News Message Board | |
| Charts:- Daily , Weekly | |
| Add CAVA to Watchlist: View: Get Complete CAVA Trend Analysis ➞ | |
 | MCO Moody s Corporation |
| Sector: Services & Goods | |
| SubSector: Business Services | |
| MarketCap: 35998.5 Millions | |
| Recent Price: 379.19 Smart Investing & Trading Score: 42 | |
| Day Percent Change: -0.78% Day Change: -2.98 | |
| Week Change: 1.21% Year-to-date Change: -2.9% | |
| MCO Links: Profile News Message Board | |
| Charts:- Daily , Weekly | |
| Add MCO to Watchlist: View: Get Complete MCO Trend Analysis ➞ | |
 | AEO American Eagle Outfitters, Inc. |
| Sector: Services & Goods | |
| SubSector: Apparel Stores | |
| MarketCap: 1577.08 Millions | |
| Recent Price: 22.96 Smart Investing & Trading Score: 58 | |
| Day Percent Change: -0.78% Day Change: -0.18 | |
| Week Change: 2.59% Year-to-date Change: 8.5% | |
| AEO Links: Profile News Message Board | |
| Charts:- Daily , Weekly | |
| Add AEO to Watchlist: View: Get Complete AEO Trend Analysis ➞ | |
 | SIRI Sirius XM Holdings Inc. |
| Sector: Services & Goods | |
| SubSector: Broadcasting - Radio | |
| MarketCap: 21325.5 Millions | |
| Recent Price: 3.13 Smart Investing & Trading Score: 42 | |
| Day Percent Change: -0.79% Day Change: -0.03 | |
| Week Change: 1.46% Year-to-date Change: -42.7% | |
| SIRI Links: Profile News Message Board | |
| Charts:- Daily , Weekly | |
| Add SIRI to Watchlist: View: Get Complete SIRI Trend Analysis ➞ | |
 | PZZA Papa John s International, Inc. |
| Sector: Services & Goods | |
| SubSector: Specialty Eateries | |
| MarketCap: 1925.27 Millions | |
| Recent Price: 63.74 Smart Investing & Trading Score: 64 | |
| Day Percent Change: -0.80% Day Change: -0.52 | |
| Week Change: 1.99% Year-to-date Change: -16.4% | |
| PZZA Links: Profile News Message Board | |
| Charts:- Daily , Weekly | |
| Add PZZA to Watchlist: View: Get Complete PZZA Trend Analysis ➞ | |
 | CURV Torrid Holdings Inc. |
| Sector: Services & Goods | |
| SubSector: Apparel Retail | |
| MarketCap: 278 Millions | |
| Recent Price: 4.98 Smart Investing & Trading Score: 69 | |
| Day Percent Change: -0.80% Day Change: -0.04 | |
| Week Change: 3.11% Year-to-date Change: -14.9% | |
| CURV Links: Profile News Message Board | |
| Charts:- Daily , Weekly | |
| Add CURV to Watchlist: View: Get Complete CURV Trend Analysis ➞ | |
 | VRSK Verisk Analytics, Inc. |
| Sector: Services & Goods | |
| SubSector: Business Services | |
| MarketCap: 22033.2 Millions | |
| Recent Price: 220.37 Smart Investing & Trading Score: 28 | |
| Day Percent Change: -0.85% Day Change: -1.88 | |
| Week Change: -0.97% Year-to-date Change: -7.7% | |
| VRSK Links: Profile News Message Board | |
| Charts:- Daily , Weekly | |
| Add VRSK to Watchlist: View: Get Complete VRSK Trend Analysis ➞ | |
 | BLMN Bloomin Brands, Inc. |
| Sector: Services & Goods | |
| SubSector: Restaurants | |
| MarketCap: 503.47 Millions | |
| Recent Price: 27.06 Smart Investing & Trading Score: 85 | |
| Day Percent Change: -0.86% Day Change: -0.24 | |
| Week Change: 0.07% Year-to-date Change: -3.9% | |
| BLMN Links: Profile News Message Board | |
| Charts:- Daily , Weekly | |
| Add BLMN to Watchlist: View: Get Complete BLMN Trend Analysis ➞ | |
 | M Macy s, Inc. |
| Sector: Services & Goods | |
| SubSector: Department Stores | |
| MarketCap: 2391.72 Millions | |
| Recent Price: 18.85 Smart Investing & Trading Score: 83 | |
| Day Percent Change: -0.89% Day Change: -0.17 | |
| Week Change: 1.73% Year-to-date Change: -6.3% | |
| M Links: Profile News Message Board | |
| Charts:- Daily , Weekly | |
| Add M to Watchlist: View: Get Complete M Trend Analysis ➞ | |
 | ALLE Allegion plc |
| Sector: Services & Goods | |
| SubSector: Security & Protection Services | |
| MarketCap: 8515.93 Millions | |
| Recent Price: 125.83 Smart Investing & Trading Score: 58 | |
| Day Percent Change: -0.90% Day Change: -1.14 | |
| Week Change: 0.5% Year-to-date Change: -0.7% | |
| ALLE Links: Profile News Message Board | |
| Charts:- Daily , Weekly | |
| Add ALLE to Watchlist: View: Get Complete ALLE Trend Analysis ➞ | |
 | RRGB Red Robin Gourmet Burgers, Inc. |
| Sector: Services & Goods | |
| SubSector: Restaurants | |
| MarketCap: 121.57 Millions | |
| Recent Price: 6.54 Smart Investing & Trading Score: 64 | |
| Day Percent Change: -0.91% Day Change: -0.06 | |
| Week Change: 2.19% Year-to-date Change: -47.6% | |
| RRGB Links: Profile News Message Board | |
| Charts:- Daily , Weekly | |
| Add RRGB to Watchlist: View: Get Complete RRGB Trend Analysis ➞ | |
 | RH RH |
| Sector: Services & Goods | |
| SubSector: Home Furnishing Stores | |
| MarketCap: 1828.25 Millions | |
| Recent Price: 246.26 Smart Investing & Trading Score: 42 | |
| Day Percent Change: -0.92% Day Change: -2.30 | |
| Week Change: 2.44% Year-to-date Change: -15.5% | |
| RH Links: Profile News Message Board | |
| Charts:- Daily , Weekly | |
| Add RH to Watchlist: View: Get Complete RH Trend Analysis ➞ | |
 | IGT International Game Technology PLC |
| Sector: Services & Goods | |
| SubSector: Gaming Activities | |
| MarketCap: 1030.89 Millions | |
| Recent Price: 20.32 Smart Investing & Trading Score: 49 | |
| Day Percent Change: -0.93% Day Change: -0.19 | |
| Week Change: 0.59% Year-to-date Change: -25.9% | |
| IGT Links: Profile News Message Board | |
| Charts:- Daily , Weekly | |
| Add IGT to Watchlist: View: Get Complete IGT Trend Analysis ➞ | |
 | BH Biglari Holdings Inc. |
| Sector: Services & Goods | |
| SubSector: Restaurants | |
| MarketCap: 149.07 Millions | |
| Recent Price: 200.07 Smart Investing & Trading Score: 95 | |
| Day Percent Change: -0.94% Day Change: -1.90 | |
| Week Change: 0.17% Year-to-date Change: 21.3% | |
| BH Links: Profile News Message Board | |
| Charts:- Daily , Weekly | |
| Add BH to Watchlist: View: Get Complete BH Trend Analysis ➞ | |
 | FUN Cedar Fair, L.P. |
| Sector: Services & Goods | |
| SubSector: General Entertainment | |
| MarketCap: 1440.49 Millions | |
| Recent Price: 38.26 Smart Investing & Trading Score: 25 | |
| Day Percent Change: -0.97% Day Change: -0.38 | |
| Week Change: 0.46% Year-to-date Change: -3.9% | |
| FUN Links: Profile News Message Board | |
| Charts:- Daily , Weekly | |
| Add FUN to Watchlist: View: Get Complete FUN Trend Analysis ➞ | |
 | QS QuantumScape Corporation |
| Sector: Services & Goods | |
| SubSector: Auto Parts | |
| MarketCap: 13137 Millions | |
| Recent Price: 5.54 Smart Investing & Trading Score: 52 | |
| Day Percent Change: -0.98% Day Change: -0.05 | |
| Week Change: 1.56% Year-to-date Change: -20.4% | |
| QS Links: Profile News Message Board | |
| Charts:- Daily , Weekly | |
| Add QS to Watchlist: View: Get Complete QS Trend Analysis ➞ | |
 | MED Medifast, Inc. |
| Sector: Services & Goods | |
| SubSector: Specialty Retail, Other | |
| MarketCap: 681.044 Millions | |
| Recent Price: 33.09 Smart Investing & Trading Score: 74 | |
| Day Percent Change: -0.99% Day Change: -0.33 | |
| Week Change: 2% Year-to-date Change: -50.8% | |
| MED Links: Profile News Message Board | |
| Charts:- Daily , Weekly | |
| Add MED to Watchlist: View: Get Complete MED Trend Analysis ➞ | |
 | KFY Korn Ferry |
| Sector: Services & Goods | |
| SubSector: Staffing & Outsourcing Services | |
| MarketCap: 1534.28 Millions | |
| Recent Price: 62.55 Smart Investing & Trading Score: 83 | |
| Day Percent Change: -1.01% Day Change: -0.64 | |
| Week Change: 2.06% Year-to-date Change: 5.4% | |
| KFY Links: Profile News Message Board | |
| Charts:- Daily , Weekly | |
| Add KFY to Watchlist: View: Get Complete KFY Trend Analysis ➞ | |
 | TBI TrueBlue, Inc. |
| Sector: Services & Goods | |
| SubSector: Staffing & Outsourcing Services | |
| MarketCap: 563.228 Millions | |
| Recent Price: 10.76 Smart Investing & Trading Score: 52 | |
| Day Percent Change: -1.01% Day Change: -0.11 | |
| Week Change: -0.65% Year-to-date Change: -29.9% | |
| TBI Links: Profile News Message Board | |
| Charts:- Daily , Weekly | |
| Add TBI to Watchlist: View: Get Complete TBI Trend Analysis ➞ | |
 | PAYS PaySign, Inc. |
| Sector: Services & Goods | |
| SubSector: Business Services | |
| MarketCap: 213.882 Millions | |
| Recent Price: 4.42 Smart Investing & Trading Score: 88 | |
| Day Percent Change: -1.01% Day Change: -0.04 | |
| Week Change: 1.49% Year-to-date Change: 58.0% | |
| PAYS Links: Profile News Message Board | |
| Charts:- Daily , Weekly | |
| Add PAYS to Watchlist: View: Get Complete PAYS Trend Analysis ➞ | |
 | VSCO Victorias Secret & Co. |
| Sector: Services & Goods | |
| SubSector: Apparel Retail | |
| MarketCap: 1340 Millions | |
| Recent Price: 17.39 Smart Investing & Trading Score: 42 | |
| Day Percent Change: -1.02% Day Change: -0.18 | |
| Week Change: 0.58% Year-to-date Change: -34.7% | |
| VSCO Links: Profile News Message Board | |
| Charts:- Daily , Weekly | |
| Add VSCO to Watchlist: View: Get Complete VSCO Trend Analysis ➞ | |
| For tabular summary view of above stock list: Summary View ➞ 0 - 25 , 25 - 50 , 50 - 75 , 75 - 100 , 100 - 125 , 125 - 150 , 150 - 175 , 175 - 200 , 200 - 225 , 225 - 250 , 250 - 275 , 275 - 300 , 300 - 325 , 325 - 350 , 350 - 375 , 375 - 400 , 400 - 425 | ||
| Click To Change The Sort Order: By Market Cap or Company Size Performance: Year-to-date, Week and Day | |
| Select Chart Type: | ||
|
Best Stocks Today 12Stocks.com |
© 2024 12Stocks.com Terms & Conditions Privacy Contact Us
All Information Provided Only For Education And Not To Be Used For Investing or Trading. See Terms & Conditions


One More Thing ... Get Best Stocks Delivered Daily!
Never Ever Miss A Move With Our Top Ten Stocks Lists
Find Best Stocks In Any Market - Bull or Bear Market
Take A Peek At Our Top Ten Stocks Lists: Daily, Weekly, Year-to-Date & Top Trends
Find Best Stocks In Any Market - Bull or Bear Market
Take A Peek At Our Top Ten Stocks Lists: Daily, Weekly, Year-to-Date & Top Trends
Consumer Services Stocks With Best Up Trends [0-bearish to 100-bullish]: Yatsen Holding[100], Alibaba [100], Arrow Electronics[100], MINISO [100], MYT Netherlands[100], Napco Security[100], Reservoir Media[100], FTI Consulting[100], Avnet [100], Manpower [100], Brinker [100]
Best Consumer Services Stocks Year-to-Date:
U Power[2785.04%], Vroom [1864.2%], Yatsen Holding[473.4%], Fluent [288.06%], Codere Online[137.67%], Research[105.46%], PaySign [58.04%], DXP Enterprises[52.26%], Gaia [50.37%], CRA [49.63%], DoubleDown Interactive[41.63%] Best Consumer Services Stocks This Week:
Chicken Soup[124.57%], Hibbett Sports[21.01%], Yatsen Holding[16.04%], Jumia Technologies[15.36%], Ameresco [13.7%], MYT Netherlands[12.79%], Baozun [12.72%], 1[11.49%], K12 [11.41%], Zumiez [11.34%], Allbirds [10.46%] Best Consumer Services Stocks Daily:
Chicken Soup[113.88%], K12 [8.21%], Yatsen Holding[6.74%], Allego N.V[6.31%], Watsco [5.94%], 1[5.92%], Starbox [5.73%], Gaia [5.45%], Hilton Worldwide[5.33%], Olaplex [4.38%], Dada Nexus[4.03%]