
 Login Sign Up


| |||||
 |  | ||||

| 12Stocks.com Market Intelligence |
Best Consumer Services Stocks
| In a hurry? Services & Goods Stocks: Performance Trends Table, Stock Charts
Sort Consumer Services: Daily, Weekly, Year-to-Date, Market Cap & Trends. Filter Services & Goods stocks list by size: All Large Mid-Range Small |
| 12Stocks.com Consumer Services Stocks Performances & Trends Daily | |||||||||
|
|  The overall Smart Investing & Trading Score is 100 (0-bearish to 100-bullish) which puts Consumer Services sector in short term bullish trend. The Smart Investing & Trading Score from previous trading session is 93 and hence an improvement of trend.
| ||||||||
Here are the Smart Investing & Trading Scores of the most requested Consumer Services stocks at 12Stocks.com (click stock name for detailed review):
|


| Consider signing up for our daily 12Stocks.com "Best Stocks Newsletter". You will never ever miss a big stock move again! |
| 12Stocks.com: Investing in Consumer Services sector with Stocks | |
|
The following table helps investors and traders sort through current performance and trends (as measured by Smart Investing & Trading Score) of various
stocks in the Consumer Services sector. Quick View: Move mouse or cursor over stock symbol (ticker) to view short-term Technical chart and over stock name to view long term chart. Click on  to add stock symbol to your watchlist and to add stock symbol to your watchlist and  to view watchlist. Click on any ticker or stock name for detailed market intelligence report for that stock. to view watchlist. Click on any ticker or stock name for detailed market intelligence report for that stock. |
12Stocks.com Performance of Stocks in Consumer Services Sector
| Ticker | Stock Name | Watchlist | Category | Recent Price | Smart Investing & Trading Score | Change % | Weekly Change% |
| TLYS | Tilly s |   | Apparel | 1.73 | 100 | 8.13% | 38.40% |
| XPOF | Xponential Fitness | | Leisure | 10.10 | 100 | 35.39% | 32.89% |
| DBI | Designer Brands | | Apparel | 3.04 | 100 | 7.42% | 23.58% |
| JACK | Jack in | | Restaurants | 20.37 | 74 | -1.07% | 21.03% |
| SSP | E.W. Scripps | | Broadcasting | 3.32 | 100 | 5.06% | 19.00% |
| EVI | EVI Industries | | Consumer Services | 24.98 | 100 | 9.13% | 18.90% |
| BLMN | Bloomin | | Restaurants | 10.16 | 100 | -0.39% | 17.32% |
| SEAT | Vivid Seats | | Internet Content & Information | 1.86 | 60 | -1.06% | 16.25% |
| WLDN | Willdan | | Services | 72.30 | 100 | 6.61% | 16.05% |
| SBH | Sally Beauty | | Retail | 10.28 | 100 | 1.28% | 14.10% |
| PAYS | PaySign | | Services | 8.10 | 100 | 4.38% | 14.08% |
| PLAY | Dave & Buster s Entertainment | | Restaurants | 34.55 | 100 | 2.16% | 13.46% |
| IHRT | iHeartMedia | | Broadcasting | 1.95 | 100 | 3.72% | 13.37% |
| SFIX | Stitch Fix | | Retail | 4.00 | 90 | 2.56% | 13.31% |
| ZUMZ | Zumiez | | Retail | 14.52 | 100 | -0.95% | 12.56% |
| WYNN | Wynn Resorts | | Casinos | 105.63 | 100 | 0.91% | 11.57% |
| CRMT | America s | | Automobile | 62.05 | 100 | 1.12% | 11.42% |
| CAVA | CAVA | | Restaurants | 86.52 | 64 | 4.61% | 11.08% |
| AAP | Advance Auto | | Auto Parts | 51.62 | 95 | 5.33% | 11.01% |
| SCVL | Shoe Carnival | | Apparel | 21.35 | 100 | 1.28% | 10.91% |
| AMRC | Ameresco | | Services | 16.81 | 100 | 3.32% | 10.88% |
| W | Wayfair | | Retail | 56.79 | 100 | 0.58% | 10.87% |
| CHGG | Chegg | | Education | 1.44 | 83 | 2.86% | 10.77% |
| ANF | Abercrombie & Fitch Co | | Apparel | 91.60 | 100 | 1.95% | 10.74% |
| CBRL | Cracker Barrel | | Restaurants | 66.88 | 100 | -1.55% | 10.55% |
| For chart view version of above stock list: Chart View ➞ 0 - 25 , 25 - 50 , 50 - 75 , 75 - 100 , 100 - 125 , 125 - 150 , 150 - 175 , 175 - 200 , 200 - 225 , 225 - 250 , 250 - 275 , 275 - 300 , 300 - 325 , 325 - 350 | ||
 | Click To Change The Sort Order: By Market Cap or Company Size Performance: Year-to-date, Week and Day |  |
|
Get the most comprehensive stock market coverage daily at 12Stocks.com ➞ Best Stocks Today ➞ Best Stocks Weekly ➞ Best Stocks Year-to-Date ➞ Best Stocks Trends ➞  Best Stocks Today 12Stocks.com Best Nasdaq Stocks ➞ Best S&P 500 Stocks ➞ Best Tech Stocks ➞ Best Biotech Stocks ➞ |
| Detailed Overview of Consumer Services Stocks |
| Consumer Services Technical Overview, Leaders & Laggards, Top Consumer Services ETF Funds & Detailed Consumer Services Stocks List, Charts, Trends & More |
| Consumer Services Sector: Technical Analysis, Trends & YTD Performance | |
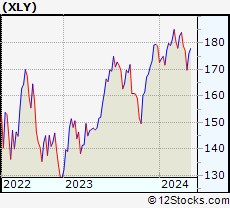
| Consumer Services sector is composed of stocks
from retail, entertainment, media/publishing, consumer goods
and services subsectors. Consumer Services sector, as represented by XLY, an exchange-traded fund [ETF] that holds basket of Consumer Services stocks (e.g, Walmart, Alibaba) is down by -1.13% and is currently underperforming the overall market by -7.79% year-to-date. Below is a quick view of Technical charts and trends: |
|
 XLY Weekly Chart |
|
| Long Term Trend: Very Good | |
| Medium Term Trend: Very Good | |
 XLY Daily Chart |
|
| Short Term Trend: Very Good | |
| Overall Trend Score: 100 | |
| YTD Performance: -1.13% | |
| **Trend Scores & Views Are Only For Educational Purposes And Not For Investing | |
| 12Stocks.com: Top Performing Consumer Services Sector Stocks | ||||||||||||||||||||||||||||||||||||||||||||||||
 The top performing Consumer Services sector stocks year to date are
Now, more recently, over last week, the top performing Consumer Services sector stocks on the move are


|
||||||||||||||||||||||||||||||||||||||||||||||||
| 12Stocks.com: Investing in Consumer Services Sector using Exchange Traded Funds | |
|
The following table shows list of key exchange traded funds (ETF) that
help investors track Consumer Services Index. For detailed view, check out our ETF Funds section of our website. Quick View: Move mouse or cursor over ETF symbol (ticker) to view short-term Technical chart and over ETF name to view long term chart. Click on ticker or stock name for detailed view. Click on to add stock symbol to your watchlist and to view watchlist. |
12Stocks.com List of ETFs that track Consumer Services Index
| Ticker | ETF Name | Watchlist | Recent Price | Smart Investing & Trading Score | Change % | Week % | Year-to-date % |
| XLY | Consumer Discret Sel | | 221.21 | 100 | 0.55 | 1.2 | -1.13% |
| RTH | Retail | | 240.82 | 90 | 0.76 | 1.05 | 7.41% |
| XRT | Retail | | 80.63 | 100 | 0.57 | 4.24 | 1.57% |
| UCC | Consumer Services | | 46.74 | 100 | 1.09 | 2.72 | -9.3% |
| SCC | Short Consumer Services | | 17.09 | 41 | -1.08 | -2.54 | 85.59% |
| UGE | Consumer Goods | | 19.01 | 77 | -0.4 | 3.37 | 5.65% |
| 12Stocks.com: Charts, Trends, Fundamental Data and Performances of Consumer Services Stocks | |
|
We now take in-depth look at all Consumer Services stocks including charts, multi-period performances and overall trends (as measured by Smart Investing & Trading Score). One can sort Consumer Services stocks (click link to choose) by Daily, Weekly and by Year-to-Date performances. Also, one can sort by size of the company or by market capitalization. |
| Select Your Default Chart Type: | |||||
| |||||
| Click on stock symbol or name for detailed view. Click on to add stock symbol to your watchlist and to view watchlist. Quick View: Move mouse or cursor over "Daily" to quickly view daily Technical stock chart and over "Weekly" to view weekly Technical stock chart. | |||||

 | TLYS Tilly s, Inc. |
| Sector: Services & Goods | |
| SubSector: Apparel Stores | |
| MarketCap: 127.408 Millions | |
| Recent Price: 1.73 Smart Investing & Trading Score: 100 | |
| Day Percent Change: 8.13% Day Change: 0.13 | |
| Week Change: 38.4% Year-to-date Change: -59.3% | |
| TLYS Links: Profile News Message Board | |
| Charts:- Daily , Weekly | |
| Add TLYS to Watchlist: View: Get Complete TLYS Trend Analysis ➞ | |
 | XPOF Xponential Fitness, Inc. |
| Sector: Services & Goods | |
| SubSector: Leisure | |
| MarketCap: 811 Millions | |
| Recent Price: 10.10 Smart Investing & Trading Score: 100 | |
| Day Percent Change: 35.39% Day Change: 2.64 | |
| Week Change: 32.89% Year-to-date Change: -24.9% | |
| XPOF Links: Profile News Message Board | |
| Charts:- Daily , Weekly | |
| Add XPOF to Watchlist: View: Get Complete XPOF Trend Analysis ➞ | |
 | DBI Designer Brands Inc. |
| Sector: Services & Goods | |
| SubSector: Apparel Stores | |
| MarketCap: 467.308 Millions | |
| Recent Price: 3.04 Smart Investing & Trading Score: 100 | |
| Day Percent Change: 7.42% Day Change: 0.21 | |
| Week Change: 23.58% Year-to-date Change: -42.3% | |
| DBI Links: Profile News Message Board | |
| Charts:- Daily , Weekly | |
| Add DBI to Watchlist: View: Get Complete DBI Trend Analysis ➞ | |
 | JACK Jack in the Box Inc. |
| Sector: Services & Goods | |
| SubSector: Restaurants | |
| MarketCap: 633.87 Millions | |
| Recent Price: 20.37 Smart Investing & Trading Score: 74 | |
| Day Percent Change: -1.07% Day Change: -0.22 | |
| Week Change: 21.03% Year-to-date Change: -50.4% | |
| JACK Links: Profile News Message Board | |
| Charts:- Daily , Weekly | |
| Add JACK to Watchlist: View: Get Complete JACK Trend Analysis ➞ | |
 | SSP The E.W. Scripps Company |
| Sector: Services & Goods | |
| SubSector: Broadcasting - TV | |
| MarketCap: 766.163 Millions | |
| Recent Price: 3.32 Smart Investing & Trading Score: 100 | |
| Day Percent Change: 5.06% Day Change: 0.16 | |
| Week Change: 19% Year-to-date Change: 50.2% | |
| SSP Links: Profile News Message Board | |
| Charts:- Daily , Weekly | |
| Add SSP to Watchlist: View: Get Complete SSP Trend Analysis ➞ | |
 | EVI EVI Industries, Inc. |
| Sector: Services & Goods | |
| SubSector: Consumer Services | |
| MarketCap: 207.448 Millions | |
| Recent Price: 24.98 Smart Investing & Trading Score: 100 | |
| Day Percent Change: 9.13% Day Change: 2.09 | |
| Week Change: 18.9% Year-to-date Change: 52.8% | |
| EVI Links: Profile News Message Board | |
| Charts:- Daily , Weekly | |
| Add EVI to Watchlist: View: Get Complete EVI Trend Analysis ➞ | |
 | BLMN Bloomin Brands, Inc. |
| Sector: Services & Goods | |
| SubSector: Restaurants | |
| MarketCap: 503.47 Millions | |
| Recent Price: 10.16 Smart Investing & Trading Score: 100 | |
| Day Percent Change: -0.39% Day Change: -0.04 | |
| Week Change: 17.32% Year-to-date Change: -15.4% | |
| BLMN Links: Profile News Message Board | |
| Charts:- Daily , Weekly | |
| Add BLMN to Watchlist: View: Get Complete BLMN Trend Analysis ➞ | |
 | SEAT Vivid Seats Inc. |
| Sector: Services & Goods | |
| SubSector: Internet Content & Information | |
| MarketCap: 1560 Millions | |
| Recent Price: 1.86 Smart Investing & Trading Score: 60 | |
| Day Percent Change: -1.06% Day Change: -0.02 | |
| Week Change: 16.25% Year-to-date Change: -59.8% | |
| SEAT Links: Profile News Message Board | |
| Charts:- Daily , Weekly | |
| Add SEAT to Watchlist: View: Get Complete SEAT Trend Analysis ➞ | |
 | WLDN Willdan Group, Inc. |
| Sector: Services & Goods | |
| SubSector: Technical Services | |
| MarketCap: 235.61 Millions | |
| Recent Price: 72.30 Smart Investing & Trading Score: 100 | |
| Day Percent Change: 6.61% Day Change: 4.48 | |
| Week Change: 16.05% Year-to-date Change: 89.8% | |
| WLDN Links: Profile News Message Board | |
| Charts:- Daily , Weekly | |
| Add WLDN to Watchlist: View: Get Complete WLDN Trend Analysis ➞ | |
 | SBH Sally Beauty Holdings, Inc. |
| Sector: Services & Goods | |
| SubSector: Specialty Retail, Other | |
| MarketCap: 1229.44 Millions | |
| Recent Price: 10.28 Smart Investing & Trading Score: 100 | |
| Day Percent Change: 1.28% Day Change: 0.13 | |
| Week Change: 14.1% Year-to-date Change: -1.6% | |
| SBH Links: Profile News Message Board | |
| Charts:- Daily , Weekly | |
| Add SBH to Watchlist: View: Get Complete SBH Trend Analysis ➞ | |
 | PAYS PaySign, Inc. |
| Sector: Services & Goods | |
| SubSector: Business Services | |
| MarketCap: 213.882 Millions | |
| Recent Price: 8.10 Smart Investing & Trading Score: 100 | |
| Day Percent Change: 4.38% Day Change: 0.34 | |
| Week Change: 14.08% Year-to-date Change: 168.2% | |
| PAYS Links: Profile News Message Board | |
| Charts:- Daily , Weekly | |
| Add PAYS to Watchlist: View: Get Complete PAYS Trend Analysis ➞ | |
 | PLAY Dave & Buster s Entertainment, Inc. |
| Sector: Services & Goods | |
| SubSector: Restaurants | |
| MarketCap: 283.07 Millions | |
| Recent Price: 34.55 Smart Investing & Trading Score: 100 | |
| Day Percent Change: 2.16% Day Change: 0.73 | |
| Week Change: 13.46% Year-to-date Change: 18.4% | |
| PLAY Links: Profile News Message Board | |
| Charts:- Daily , Weekly | |
| Add PLAY to Watchlist: View: Get Complete PLAY Trend Analysis ➞ | |
 | IHRT iHeartMedia, Inc. |
| Sector: Services & Goods | |
| SubSector: Broadcasting - Radio | |
| MarketCap: 694 Millions | |
| Recent Price: 1.95 Smart Investing & Trading Score: 100 | |
| Day Percent Change: 3.72% Day Change: 0.07 | |
| Week Change: 13.37% Year-to-date Change: -1.5% | |
| IHRT Links: Profile News Message Board | |
| Charts:- Daily , Weekly | |
| Add IHRT to Watchlist: View: Get Complete IHRT Trend Analysis ➞ | |
 | SFIX Stitch Fix, Inc. |
| Sector: Services & Goods | |
| SubSector: Specialty Retail, Other | |
| MarketCap: 1693.64 Millions | |
| Recent Price: 4.00 Smart Investing & Trading Score: 90 | |
| Day Percent Change: 2.56% Day Change: 0.1 | |
| Week Change: 13.31% Year-to-date Change: -7.2% | |
| SFIX Links: Profile News Message Board | |
| Charts:- Daily , Weekly | |
| Add SFIX to Watchlist: View: Get Complete SFIX Trend Analysis ➞ | |
 | ZUMZ Zumiez Inc. |
| Sector: Services & Goods | |
| SubSector: Specialty Retail, Other | |
| MarketCap: 526.244 Millions | |
| Recent Price: 14.52 Smart Investing & Trading Score: 100 | |
| Day Percent Change: -0.95% Day Change: -0.14 | |
| Week Change: 12.56% Year-to-date Change: -24.3% | |
| ZUMZ Links: Profile News Message Board | |
| Charts:- Daily , Weekly | |
| Add ZUMZ to Watchlist: View: Get Complete ZUMZ Trend Analysis ➞ | |
 | WYNN Wynn Resorts, Limited |
| Sector: Services & Goods | |
| SubSector: Resorts & Casinos | |
| MarketCap: 6643.34 Millions | |
| Recent Price: 105.63 Smart Investing & Trading Score: 100 | |
| Day Percent Change: 0.91% Day Change: 0.95 | |
| Week Change: 11.57% Year-to-date Change: 22.9% | |
| WYNN Links: Profile News Message Board | |
| Charts:- Daily , Weekly | |
| Add WYNN to Watchlist: View: Get Complete WYNN Trend Analysis ➞ | |
 | CRMT America s Car-Mart, Inc. |
| Sector: Services & Goods | |
| SubSector: Auto Dealerships | |
| MarketCap: 329.921 Millions | |
| Recent Price: 62.05 Smart Investing & Trading Score: 100 | |
| Day Percent Change: 1.12% Day Change: 0.69 | |
| Week Change: 11.42% Year-to-date Change: 21.1% | |
| CRMT Links: Profile News Message Board | |
| Charts:- Daily , Weekly | |
| Add CRMT to Watchlist: View: Get Complete CRMT Trend Analysis ➞ | |
 | CAVA CAVA Group, Inc. |
| Sector: Services & Goods | |
| SubSector: Restaurants | |
| MarketCap: 4510 Millions | |
| Recent Price: 86.52 Smart Investing & Trading Score: 64 | |
| Day Percent Change: 4.61% Day Change: 3.81 | |
| Week Change: 11.08% Year-to-date Change: -23.3% | |
| CAVA Links: Profile News Message Board | |
| Charts:- Daily , Weekly | |
| Add CAVA to Watchlist: View: Get Complete CAVA Trend Analysis ➞ | |
 | AAP Advance Auto Parts, Inc. |
| Sector: Services & Goods | |
| SubSector: Auto Parts Stores | |
| MarketCap: 5977.7 Millions | |
| Recent Price: 51.62 Smart Investing & Trading Score: 95 | |
| Day Percent Change: 5.33% Day Change: 2.61 | |
| Week Change: 11.01% Year-to-date Change: 10.6% | |
| AAP Links: Profile News Message Board | |
| Charts:- Daily , Weekly | |
| Add AAP to Watchlist: View: Get Complete AAP Trend Analysis ➞ | |
 | SCVL Shoe Carnival, Inc. |
| Sector: Services & Goods | |
| SubSector: Apparel Stores | |
| MarketCap: 252.508 Millions | |
| Recent Price: 21.35 Smart Investing & Trading Score: 100 | |
| Day Percent Change: 1.28% Day Change: 0.27 | |
| Week Change: 10.91% Year-to-date Change: -34.7% | |
| SCVL Links: Profile News Message Board | |
| Charts:- Daily , Weekly | |
| Add SCVL to Watchlist: View: Get Complete SCVL Trend Analysis ➞ | |
 | AMRC Ameresco, Inc. |
| Sector: Services & Goods | |
| SubSector: Technical Services | |
| MarketCap: 898.91 Millions | |
| Recent Price: 16.81 Smart Investing & Trading Score: 100 | |
| Day Percent Change: 3.32% Day Change: 0.54 | |
| Week Change: 10.88% Year-to-date Change: -28.4% | |
| AMRC Links: Profile News Message Board | |
| Charts:- Daily , Weekly | |
| Add AMRC to Watchlist: View: Get Complete AMRC Trend Analysis ➞ | |
 | W Wayfair Inc. |
| Sector: Services & Goods | |
| SubSector: Catalog & Mail Order Houses | |
| MarketCap: 3497.02 Millions | |
| Recent Price: 56.79 Smart Investing & Trading Score: 100 | |
| Day Percent Change: 0.58% Day Change: 0.33 | |
| Week Change: 10.87% Year-to-date Change: 28.1% | |
| W Links: Profile News Message Board | |
| Charts:- Daily , Weekly | |
| Add W to Watchlist: View: Get Complete W Trend Analysis ➞ | |
 | CHGG Chegg, Inc. |
| Sector: Services & Goods | |
| SubSector: Education & Training Services | |
| MarketCap: 3606.86 Millions | |
| Recent Price: 1.44 Smart Investing & Trading Score: 83 | |
| Day Percent Change: 2.86% Day Change: 0.04 | |
| Week Change: 10.77% Year-to-date Change: -10.6% | |
| CHGG Links: Profile News Message Board | |
| Charts:- Daily , Weekly | |
| Add CHGG to Watchlist: View: Get Complete CHGG Trend Analysis ➞ | |
 | ANF Abercrombie & Fitch Co. |
| Sector: Services & Goods | |
| SubSector: Apparel Stores | |
| MarketCap: 589.108 Millions | |
| Recent Price: 91.60 Smart Investing & Trading Score: 100 | |
| Day Percent Change: 1.95% Day Change: 1.75 | |
| Week Change: 10.74% Year-to-date Change: -38.7% | |
| ANF Links: Profile News Message Board | |
| Charts:- Daily , Weekly | |
| Add ANF to Watchlist: View: Get Complete ANF Trend Analysis ➞ | |
 | CBRL Cracker Barrel Old Country Store, Inc. |
| Sector: Services & Goods | |
| SubSector: Restaurants | |
| MarketCap: 1839.6 Millions | |
| Recent Price: 66.88 Smart Investing & Trading Score: 100 | |
| Day Percent Change: -1.55% Day Change: -1.05 | |
| Week Change: 10.55% Year-to-date Change: 27.9% | |
| CBRL Links: Profile News Message Board | |
| Charts:- Daily , Weekly | |
| Add CBRL to Watchlist: View: Get Complete CBRL Trend Analysis ➞ | |
| For tabular summary view of above stock list: Summary View ➞ 0 - 25 , 25 - 50 , 50 - 75 , 75 - 100 , 100 - 125 , 125 - 150 , 150 - 175 , 175 - 200 , 200 - 225 , 225 - 250 , 250 - 275 , 275 - 300 , 300 - 325 , 325 - 350 | ||
| Click To Change The Sort Order: By Market Cap or Company Size Performance: Year-to-date, Week and Day | |
| Select Chart Type: | ||
|
Best Stocks Today 12Stocks.com |
© 2025 12Stocks.com Terms & Conditions Privacy Contact Us
All Information Provided Only For Education And Not To Be Used For Investing or Trading. See Terms & Conditions


One More Thing ... Get Best Stocks Delivered Daily!
Never Ever Miss A Move With Our Top Ten Stocks Lists
Find Best Stocks In Any Market - Bull or Bear Market
Take A Peek At Our Top Ten Stocks Lists: Daily, Weekly, Year-to-Date & Top Trends
Find Best Stocks In Any Market - Bull or Bear Market
Take A Peek At Our Top Ten Stocks Lists: Daily, Weekly, Year-to-Date & Top Trends
Consumer Services Stocks With Best Up Trends [0-bearish to 100-bullish]: Xponential Fitness[100], EVI Industries[100], Tilly s[100], Designer Brands[100], Willdan [100], Forrester Research[100], E.W. Scripps[100], PaySign [100], Super [100], Emerald Holding[100], iHeartMedia [100]
Best Consumer Services Stocks Year-to-Date:
ThredUp [475.54%], PaySign [168.21%], National Vision[129.37%], Willdan [89.81%], Super [83.88%], Roblox [79.04%], Carvana Co[71.29%], Kratos Defense[69.29%], Gray Television[59.22%], Ardagh Metal[55.45%], Titan Machinery[52.87%] Best Consumer Services Stocks This Week:
Tilly s[38.4%], Xponential Fitness[32.89%], Designer Brands[23.58%], Jack in[21.03%], E.W. Scripps[19%], EVI Industries[18.9%], Bloomin [17.32%], Vivid Seats[16.25%], Willdan [16.05%], Sally Beauty[14.1%], PaySign [14.08%] Best Consumer Services Stocks Daily:
Xponential Fitness[35.39%], EVI Industries[9.13%], United Homes[8.78%], Tilly s[8.13%], Designer Brands[7.42%], Willdan [6.61%], Forrester Research[6.39%], ThredUp [5.68%], Lucid [5.37%], Advance Auto[5.33%], Torrid [5.07%]