
 Login Sign Up


| |||||
 |  | ||||

| 12Stocks.com Market Intelligence |
Best Consumer Services Stocks
| In a hurry? Services & Goods Stocks: Performance Trends Table, Stock Charts
Sort Consumer Services: Daily, Weekly, Year-to-Date, Market Cap & Trends. Filter Services & Goods stocks list by size: All Large Mid-Range Small |
| 12Stocks.com Consumer Services Stocks Performances & Trends Daily | |||||||||
|
|  The overall Smart Investing & Trading Score is 0 (0-bearish to 100-bullish) which puts Consumer Services sector in short term bearish trend. The Smart Investing & Trading Score from previous trading session is 13 and hence a deterioration of trend.
| ||||||||
Here are the Smart Investing & Trading Scores of the most requested Consumer Services stocks at 12Stocks.com (click stock name for detailed review):
|


| Consider signing up for our daily 12Stocks.com "Best Stocks Newsletter". You will never ever miss a big stock move again! |
| 12Stocks.com: Investing in Consumer Services sector with Stocks | |
|
The following table helps investors and traders sort through current performance and trends (as measured by Smart Investing & Trading Score) of various
stocks in the Consumer Services sector. Quick View: Move mouse or cursor over stock symbol (ticker) to view short-term Technical chart and over stock name to view long term chart. Click on  to add stock symbol to your watchlist and to add stock symbol to your watchlist and  to view watchlist. Click on any ticker or stock name for detailed market intelligence report for that stock. to view watchlist. Click on any ticker or stock name for detailed market intelligence report for that stock. |
12Stocks.com Performance of Stocks in Consumer Services Sector
| Ticker | Stock Name | Watchlist | Category | Recent Price | Smart Investing & Trading Score | Change % | Weekly Change% |
| CASY | Casey s |   | Grocery | 310.18 | 41 | 0.25% | 0.04% |
| VRSK | Verisk Analytics | | Services | 222.62 | 25 | -0.32% | 0.04% |
| HURN | Huron Consulting | | Services | 92.38 | 42 | 2.15% | -0.01% |
| EDR | Endeavor | | Entertainment | 26.41 | 43 | -0.13% | -0.02% |
| TNET | TriNet | | Services | 127.99 | 51 | -1.17% | -0.05% |
| J | Jacobs Engineering | | Services | 144.57 | 56 | 0.74% | -0.06% |
| DRI | Darden Restaurants | | Restaurants | 152.88 | 10 | 0.39% | -0.11% |
| ATGE | Adtalem Global | | Education | 46.20 | 35 | 0.13% | -0.13% |
| FTDR | frontdoor | | Services | 30.40 | 42 | 1.30% | -0.13% |
| CDRO | Codere Online | | Gambling | 6.95 | 61 | -0.43% | -0.14% |
| GLP | Global Partners | | Basic Materials Wholesale | 45.74 | 62 | 0.46% | -0.15% |
| YUMC | Yum China | | Restaurants | 37.22 | 68 | -0.01% | -0.33% |
| BOOT | Boot Barn | | Apparel | 98.80 | 63 | 0.19% | -0.38% |
| AN | AutoNation | | Automobile | 153.50 | 51 | -0.73% | -0.40% |
| HSIC | Henry Schein | | Medical | 70.72 | 25 | 1.07% | -0.41% |
| QGEN | QIAGEN N.V | | Research | 40.02 | 32 | 1.38% | -0.41% |
| STRA | Strategic Education | | Education | 98.03 | 51 | -0.09% | -0.43% |
| FLWS | 1-800-FLOWERS.COM | | Retail | 8.90 | 32 | 1.48% | -0.45% |
| EAT | Brinker | | Restaurants | 45.03 | 56 | -0.60% | -0.46% |
| CARS | Cars.com | | Automobile | 16.48 | 25 | 1.92% | -0.48% |
| MCW | Mister Car | | Services | 6.70 | 32 | -0.96% | -0.52% |
| APEI | American Public | | Education | 12.62 | 63 | 1.20% | -0.55% |
| SCHL | Scholastic | | Publishing | 35.56 | 25 | 2.10% | -0.56% |
| KBR | KBR | | Services | 62.38 | 61 | 0.41% | -0.57% |
| BCO | Brink s | | Security | 86.45 | 51 | 0.19% | -0.59% |
| For chart view version of above stock list: Chart View ➞ 0 - 25 , 25 - 50 , 50 - 75 , 75 - 100 , 100 - 125 , 125 - 150 , 150 - 175 , 175 - 200 , 200 - 225 , 225 - 250 , 250 - 275 , 275 - 300 , 300 - 325 , 325 - 350 , 350 - 375 , 375 - 400 , 400 - 425 , 425 - 450 , 450 - 475 | ||
 | Click To Change The Sort Order: By Market Cap or Company Size Performance: Year-to-date, Week and Day |  |
|
Get the most comprehensive stock market coverage daily at 12Stocks.com ➞ Best Stocks Today ➞ Best Stocks Weekly ➞ Best Stocks Year-to-Date ➞ Best Stocks Trends ➞  Best Stocks Today 12Stocks.com Best Nasdaq Stocks ➞ Best S&P 500 Stocks ➞ Best Tech Stocks ➞ Best Biotech Stocks ➞ |
| Detailed Overview of Consumer Services Stocks |
| Consumer Services Technical Overview, Leaders & Laggards, Top Consumer Services ETF Funds & Detailed Consumer Services Stocks List, Charts, Trends & More |
| Consumer Services Sector: Technical Analysis, Trends & YTD Performance | |
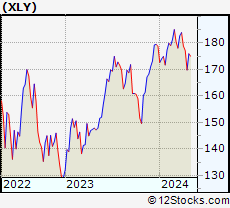
| Consumer Services sector is composed of stocks
from retail, entertainment, media/publishing, consumer goods
and services subsectors. Consumer Services sector, as represented by XLY, an exchange-traded fund [ETF] that holds basket of Consumer Services stocks (e.g, Walmart, Alibaba) is down by -5.4% and is currently underperforming the overall market by -8.55% year-to-date. Below is a quick view of Technical charts and trends: |
|
 XLY Weekly Chart |
|
| Long Term Trend: Not Good | |
| Medium Term Trend: Not Good | |
 XLY Daily Chart |
|
| Short Term Trend: Not Good | |
| Overall Trend Score: 0 | |
| YTD Performance: -5.4% | |
| **Trend Scores & Views Are Only For Educational Purposes And Not For Investing | |
| 12Stocks.com: Top Performing Consumer Services Sector Stocks | ||||||||||||||||||||||||||||||||||||||||||||||||
 The top performing Consumer Services sector stocks year to date are
Now, more recently, over last week, the top performing Consumer Services sector stocks on the move are


|
||||||||||||||||||||||||||||||||||||||||||||||||
| 12Stocks.com: Investing in Consumer Services Sector using Exchange Traded Funds | |
|
The following table shows list of key exchange traded funds (ETF) that
help investors track Consumer Services Index. For detailed view, check out our ETF Funds section of our website. Quick View: Move mouse or cursor over ETF symbol (ticker) to view short-term Technical chart and over ETF name to view long term chart. Click on ticker or stock name for detailed view. Click on to add stock symbol to your watchlist and to view watchlist. |
12Stocks.com List of ETFs that track Consumer Services Index
| Ticker | ETF Name | Watchlist | Recent Price | Smart Investing & Trading Score | Change % | Week % | Year-to-date % |
| XLY | Consumer Discret Sel | | 169.16 | 0 | -1.23 | -4.49 | -5.4% |
| RTH | Retail | | 198.09 | 44 | -0.27 | -1.78 | 5.24% |
| IYC | Consumer Services | | 76.02 | 36 | -1.35 | -4 | 0.33% |
| XRT | Retail | | 70.70 | 51 | 0.01 | -1.64 | -2.24% |
| IYK | Consumer Goods | | 65.61 | 53 | 0.99 | 2.26 | 2.67% |
| UCC | Consumer Services | | 31.90 | 33 | -2.27 | -7.34 | -11.16% |
| RETL | Retail Bull 3X | | 7.98 | 41 | 0.38 | -5.11 | -12.5% |
| RXI | Globl Consumer Discretionary | | 157.06 | 44 | -0.25 | -2.32 | -1.25% |
| SCC | Short Consumer Services | | 16.90 | 82 | 1.81 | 8.56 | 10.29% |
| UGE | Consumer Goods | | 16.53 | 73 | 1.66 | 2.11 | 5.01% |
| 12Stocks.com: Charts, Trends, Fundamental Data and Performances of Consumer Services Stocks | |
|
We now take in-depth look at all Consumer Services stocks including charts, multi-period performances and overall trends (as measured by Smart Investing & Trading Score). One can sort Consumer Services stocks (click link to choose) by Daily, Weekly and by Year-to-Date performances. Also, one can sort by size of the company or by market capitalization. |
| Select Your Default Chart Type: | |||||
| |||||
| Click on stock symbol or name for detailed view. Click on to add stock symbol to your watchlist and to view watchlist. Quick View: Move mouse or cursor over "Daily" to quickly view daily Technical stock chart and over "Weekly" to view weekly Technical stock chart. | |||||

 | CASY Casey s General Stores, Inc. |
| Sector: Services & Goods | |
| SubSector: Grocery Stores | |
| MarketCap: 5787.95 Millions | |
| Recent Price: 310.18 Smart Investing & Trading Score: 41 | |
| Day Percent Change: 0.25% Day Change: 0.78 | |
| Week Change: 0.04% Year-to-date Change: 12.9% | |
| CASY Links: Profile News Message Board | |
| Charts:- Daily , Weekly | |
| Add CASY to Watchlist: View: Get Complete CASY Trend Analysis ➞ | |
 | VRSK Verisk Analytics, Inc. |
| Sector: Services & Goods | |
| SubSector: Business Services | |
| MarketCap: 22033.2 Millions | |
| Recent Price: 222.62 Smart Investing & Trading Score: 25 | |
| Day Percent Change: -0.32% Day Change: -0.71 | |
| Week Change: 0.04% Year-to-date Change: -6.8% | |
| VRSK Links: Profile News Message Board | |
| Charts:- Daily , Weekly | |
| Add VRSK to Watchlist: View: Get Complete VRSK Trend Analysis ➞ | |
 | HURN Huron Consulting Group Inc. |
| Sector: Services & Goods | |
| SubSector: Management Services | |
| MarketCap: 968.645 Millions | |
| Recent Price: 92.38 Smart Investing & Trading Score: 42 | |
| Day Percent Change: 2.15% Day Change: 1.94 | |
| Week Change: -0.01% Year-to-date Change: -10.1% | |
| HURN Links: Profile News Message Board | |
| Charts:- Daily , Weekly | |
| Add HURN to Watchlist: View: Get Complete HURN Trend Analysis ➞ | |
 | EDR Endeavor Group Holdings, Inc. |
| Sector: Services & Goods | |
| SubSector: Entertainment | |
| MarketCap: 11310 Millions | |
| Recent Price: 26.41 Smart Investing & Trading Score: 43 | |
| Day Percent Change: -0.13% Day Change: -0.04 | |
| Week Change: -0.02% Year-to-date Change: 11.3% | |
| EDR Links: Profile News Message Board | |
| Charts:- Daily , Weekly | |
| Add EDR to Watchlist: View: Get Complete EDR Trend Analysis ➞ | |
 | TNET TriNet Group, Inc. |
| Sector: Services & Goods | |
| SubSector: Business Services | |
| MarketCap: 2648.72 Millions | |
| Recent Price: 127.99 Smart Investing & Trading Score: 51 | |
| Day Percent Change: -1.17% Day Change: -1.51 | |
| Week Change: -0.05% Year-to-date Change: 7.6% | |
| TNET Links: Profile News Message Board | |
| Charts:- Daily , Weekly | |
| Add TNET to Watchlist: View: Get Complete TNET Trend Analysis ➞ | |
 | J Jacobs Engineering Group Inc. |
| Sector: Services & Goods | |
| SubSector: Technical Services | |
| MarketCap: 9714.8 Millions | |
| Recent Price: 144.57 Smart Investing & Trading Score: 56 | |
| Day Percent Change: 0.74% Day Change: 1.06 | |
| Week Change: -0.06% Year-to-date Change: 11.4% | |
| J Links: Profile News Message Board | |
| Charts:- Daily , Weekly | |
| Add J to Watchlist: View: Get Complete J Trend Analysis ➞ | |
 | DRI Darden Restaurants, Inc. |
| Sector: Services & Goods | |
| SubSector: Restaurants | |
| MarketCap: 5623.1 Millions | |
| Recent Price: 152.88 Smart Investing & Trading Score: 10 | |
| Day Percent Change: 0.39% Day Change: 0.59 | |
| Week Change: -0.11% Year-to-date Change: -7.0% | |
| DRI Links: Profile News Message Board | |
| Charts:- Daily , Weekly | |
| Add DRI to Watchlist: View: Get Complete DRI Trend Analysis ➞ | |
 | ATGE Adtalem Global Education Inc. |
| Sector: Services & Goods | |
| SubSector: Education & Training Services | |
| MarketCap: 1273.86 Millions | |
| Recent Price: 46.20 Smart Investing & Trading Score: 35 | |
| Day Percent Change: 0.13% Day Change: 0.06 | |
| Week Change: -0.13% Year-to-date Change: -21.6% | |
| ATGE Links: Profile News Message Board | |
| Charts:- Daily , Weekly | |
| Add ATGE to Watchlist: View: Get Complete ATGE Trend Analysis ➞ | |
 | FTDR frontdoor, inc. |
| Sector: Services & Goods | |
| SubSector: Business Services | |
| MarketCap: 2974.22 Millions | |
| Recent Price: 30.40 Smart Investing & Trading Score: 42 | |
| Day Percent Change: 1.30% Day Change: 0.39 | |
| Week Change: -0.13% Year-to-date Change: -13.7% | |
| FTDR Links: Profile News Message Board | |
| Charts:- Daily , Weekly | |
| Add FTDR to Watchlist: View: Get Complete FTDR Trend Analysis ➞ | |
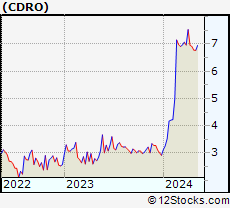 | CDRO Codere Online Luxembourg, S.A. |
| Sector: Services & Goods | |
| SubSector: Gambling | |
| MarketCap: 159 Millions | |
| Recent Price: 6.95 Smart Investing & Trading Score: 61 | |
| Day Percent Change: -0.43% Day Change: -0.03 | |
| Week Change: -0.14% Year-to-date Change: 138.0% | |
| CDRO Links: Profile News Message Board | |
| Charts:- Daily , Weekly | |
| Add CDRO to Watchlist: View: Get Complete CDRO Trend Analysis ➞ | |
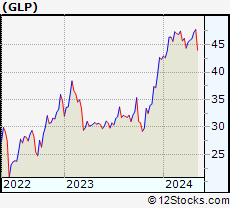 | GLP Global Partners LP |
| Sector: Services & Goods | |
| SubSector: Basic Materials Wholesale | |
| MarketCap: 416.73 Millions | |
| Recent Price: 45.74 Smart Investing & Trading Score: 62 | |
| Day Percent Change: 0.46% Day Change: 0.21 | |
| Week Change: -0.15% Year-to-date Change: 8.1% | |
| GLP Links: Profile News Message Board | |
| Charts:- Daily , Weekly | |
| Add GLP to Watchlist: View: Get Complete GLP Trend Analysis ➞ | |
 | YUMC Yum China Holdings, Inc. |
| Sector: Services & Goods | |
| SubSector: Restaurants | |
| MarketCap: 16284.5 Millions | |
| Recent Price: 37.22 Smart Investing & Trading Score: 68 | |
| Day Percent Change: -0.01% Day Change: 0.00 | |
| Week Change: -0.33% Year-to-date Change: -12.3% | |
| YUMC Links: Profile News Message Board | |
| Charts:- Daily , Weekly | |
| Add YUMC to Watchlist: View: Get Complete YUMC Trend Analysis ➞ | |
 | BOOT Boot Barn Holdings, Inc. |
| Sector: Services & Goods | |
| SubSector: Apparel Stores | |
| MarketCap: 360.608 Millions | |
| Recent Price: 98.80 Smart Investing & Trading Score: 63 | |
| Day Percent Change: 0.19% Day Change: 0.19 | |
| Week Change: -0.38% Year-to-date Change: 28.7% | |
| BOOT Links: Profile News Message Board | |
| Charts:- Daily , Weekly | |
| Add BOOT to Watchlist: View: Get Complete BOOT Trend Analysis ➞ | |
 | AN AutoNation, Inc. |
| Sector: Services & Goods | |
| SubSector: Auto Dealerships | |
| MarketCap: 2732.61 Millions | |
| Recent Price: 153.50 Smart Investing & Trading Score: 51 | |
| Day Percent Change: -0.73% Day Change: -1.13 | |
| Week Change: -0.4% Year-to-date Change: 2.2% | |
| AN Links: Profile News Message Board | |
| Charts:- Daily , Weekly | |
| Add AN to Watchlist: View: Get Complete AN Trend Analysis ➞ | |
 | HSIC Henry Schein, Inc. |
| Sector: Services & Goods | |
| SubSector: Medical Equipment Wholesale | |
| MarketCap: 6760.9 Millions | |
| Recent Price: 70.72 Smart Investing & Trading Score: 25 | |
| Day Percent Change: 1.07% Day Change: 0.75 | |
| Week Change: -0.41% Year-to-date Change: -6.6% | |
| HSIC Links: Profile News Message Board | |
| Charts:- Daily , Weekly | |
| Add HSIC to Watchlist: View: Get Complete HSIC Trend Analysis ➞ | |
 | QGEN QIAGEN N.V. |
| Sector: Services & Goods | |
| SubSector: Research Services | |
| MarketCap: 8698.94 Millions | |
| Recent Price: 40.02 Smart Investing & Trading Score: 32 | |
| Day Percent Change: 1.38% Day Change: 0.55 | |
| Week Change: -0.41% Year-to-date Change: -7.9% | |
| QGEN Links: Profile News Message Board | |
| Charts:- Daily , Weekly | |
| Add QGEN to Watchlist: View: Get Complete QGEN Trend Analysis ➞ | |
 | STRA Strategic Education, Inc. |
| Sector: Services & Goods | |
| SubSector: Education & Training Services | |
| MarketCap: 2621.56 Millions | |
| Recent Price: 98.03 Smart Investing & Trading Score: 51 | |
| Day Percent Change: -0.09% Day Change: -0.08 | |
| Week Change: -0.43% Year-to-date Change: 6.1% | |
| STRA Links: Profile News Message Board | |
| Charts:- Daily , Weekly | |
| Add STRA to Watchlist: View: Get Complete STRA Trend Analysis ➞ | |
 | FLWS 1-800-FLOWERS.COM, Inc. |
| Sector: Services & Goods | |
| SubSector: Specialty Retail, Other | |
| MarketCap: 940 Millions | |
| Recent Price: 8.90 Smart Investing & Trading Score: 32 | |
| Day Percent Change: 1.48% Day Change: 0.13 | |
| Week Change: -0.45% Year-to-date Change: -17.4% | |
| FLWS Links: Profile News Message Board | |
| Charts:- Daily , Weekly | |
| Add FLWS to Watchlist: View: Get Complete FLWS Trend Analysis ➞ | |
 | EAT Brinker International, Inc. |
| Sector: Services & Goods | |
| SubSector: Restaurants | |
| MarketCap: 435.97 Millions | |
| Recent Price: 45.03 Smart Investing & Trading Score: 56 | |
| Day Percent Change: -0.60% Day Change: -0.27 | |
| Week Change: -0.46% Year-to-date Change: 4.3% | |
| EAT Links: Profile News Message Board | |
| Charts:- Daily , Weekly | |
| Add EAT to Watchlist: View: Get Complete EAT Trend Analysis ➞ | |
 | CARS Cars.com Inc. |
| Sector: Services & Goods | |
| SubSector: Auto Dealerships | |
| MarketCap: 290.321 Millions | |
| Recent Price: 16.48 Smart Investing & Trading Score: 25 | |
| Day Percent Change: 1.92% Day Change: 0.31 | |
| Week Change: -0.48% Year-to-date Change: -13.1% | |
| CARS Links: Profile News Message Board | |
| Charts:- Daily , Weekly | |
| Add CARS to Watchlist: View: Get Complete CARS Trend Analysis ➞ | |
 | MCW Mister Car Wash, Inc. |
| Sector: Services & Goods | |
| SubSector: Personal Services | |
| MarketCap: 2790 Millions | |
| Recent Price: 6.70 Smart Investing & Trading Score: 32 | |
| Day Percent Change: -0.96% Day Change: -0.06 | |
| Week Change: -0.52% Year-to-date Change: -22.3% | |
| MCW Links: Profile News Message Board | |
| Charts:- Daily , Weekly | |
| Add MCW to Watchlist: View: Get Complete MCW Trend Analysis ➞ | |
 | APEI American Public Education, Inc. |
| Sector: Services & Goods | |
| SubSector: Education & Training Services | |
| MarketCap: 361.306 Millions | |
| Recent Price: 12.62 Smart Investing & Trading Score: 63 | |
| Day Percent Change: 1.20% Day Change: 0.15 | |
| Week Change: -0.55% Year-to-date Change: 30.8% | |
| APEI Links: Profile News Message Board | |
| Charts:- Daily , Weekly | |
| Add APEI to Watchlist: View: Get Complete APEI Trend Analysis ➞ | |
 | SCHL Scholastic Corporation |
| Sector: Services & Goods | |
| SubSector: Publishing - Books | |
| MarketCap: 791 Millions | |
| Recent Price: 35.56 Smart Investing & Trading Score: 25 | |
| Day Percent Change: 2.10% Day Change: 0.73 | |
| Week Change: -0.56% Year-to-date Change: -5.7% | |
| SCHL Links: Profile News Message Board | |
| Charts:- Daily , Weekly | |
| Add SCHL to Watchlist: View: Get Complete SCHL Trend Analysis ➞ | |
 | KBR KBR, Inc. |
| Sector: Services & Goods | |
| SubSector: Technical Services | |
| MarketCap: 2526.1 Millions | |
| Recent Price: 62.38 Smart Investing & Trading Score: 61 | |
| Day Percent Change: 0.41% Day Change: 0.25 | |
| Week Change: -0.57% Year-to-date Change: 12.6% | |
| KBR Links: Profile News Message Board | |
| Charts:- Daily , Weekly | |
| Add KBR to Watchlist: View: Get Complete KBR Trend Analysis ➞ | |
 | BCO The Brink s Company |
| Sector: Services & Goods | |
| SubSector: Security & Protection Services | |
| MarketCap: 2544.73 Millions | |
| Recent Price: 86.45 Smart Investing & Trading Score: 51 | |
| Day Percent Change: 0.19% Day Change: 0.16 | |
| Week Change: -0.59% Year-to-date Change: -1.7% | |
| BCO Links: Profile News Message Board | |
| Charts:- Daily , Weekly | |
| Add BCO to Watchlist: View: Get Complete BCO Trend Analysis ➞ | |
| For tabular summary view of above stock list: Summary View ➞ 0 - 25 , 25 - 50 , 50 - 75 , 75 - 100 , 100 - 125 , 125 - 150 , 150 - 175 , 175 - 200 , 200 - 225 , 225 - 250 , 250 - 275 , 275 - 300 , 300 - 325 , 325 - 350 , 350 - 375 , 375 - 400 , 400 - 425 , 425 - 450 , 450 - 475 | ||
| Click To Change The Sort Order: By Market Cap or Company Size Performance: Year-to-date, Week and Day | |
| Select Chart Type: | ||
|
Best Stocks Today 12Stocks.com |
© 2024 12Stocks.com Terms & Conditions Privacy Contact Us
All Information Provided Only For Education And Not To Be Used For Investing or Trading. See Terms & Conditions


One More Thing ... Get Best Stocks Delivered Daily!
Never Ever Miss A Move With Our Top Ten Stocks Lists
Find Best Stocks In Any Market - Bull or Bear Market
Take A Peek At Our Top Ten Stocks Lists: Daily, Weekly, Year-to-Date & Top Trends
Find Best Stocks In Any Market - Bull or Bear Market
Take A Peek At Our Top Ten Stocks Lists: Daily, Weekly, Year-to-Date & Top Trends
Consumer Services Stocks With Best Up Trends [0-bearish to 100-bullish]: Gaia [100], Gannett Co[100], Genuine Parts[100], ContextLogic [95], Biglari [95], MYT Netherlands[93], Envestnet [93], FTI Consulting[93], Bright Scholar[90], Winmark [90], Donnelley Financial[90]
Best Consumer Services Stocks Year-to-Date:
U Power[2812.95%], Vroom [1713.36%], Yatsen Holding[394.12%], Fluent [288.06%], Codere Online[138.01%], Research[96.93%], Sweetgreen [86.02%], Bright Scholar[68%], RealReal [57.96%], PaySign [52.5%], DXP Enterprises[48.69%] Best Consumer Services Stocks This Week:
Yatsen Holding[20.1%], AMC Entertainment[20%], ContextLogic [20%], Secoo Holding[15.24%], Bright Scholar[14.13%], Altisource Portfolio[11.49%], Genuine Parts[11.21%], E.W. Scripps[10.63%], Advance Auto[10.62%], TH [10%], Smart Share[9.26%] Best Consumer Services Stocks Daily:
Bright Scholar[11.70%], AMC Entertainment[8.90%], Lanvin [8.39%], Vision Marine[7.40%], Altisource Portfolio[7.14%], Allego N.V[5.94%], Allbirds [5.72%], Cumulus Media[5.56%], Entravision [5.30%], GreenTree Hospitality[4.56%], Zumiez [4.39%]