
 Login Sign Up


| |||||
 |  | ||||

| 12Stocks.com Market Intelligence |
Best Consumer Services Stocks
| In a hurry? Services & Goods Stocks: Performance Trends Table, Stock Charts
Sort Consumer Services: Daily, Weekly, Year-to-Date, Market Cap & Trends. Filter Services & Goods stocks list by size: All Large Mid-Range Small |
| 12Stocks.com Consumer Services Stocks Performances & Trends Daily | |||||||||
|
|  The overall Smart Investing & Trading Score is 51 (0-bearish to 100-bullish) which puts Consumer Services sector in short term neutral trend. The Smart Investing & Trading Score from previous trading session is 58 and hence a deterioration of trend.
| ||||||||
Here are the Smart Investing & Trading Scores of the most requested Consumer Services stocks at 12Stocks.com (click stock name for detailed review):
|


| Consider signing up for our daily 12Stocks.com "Best Stocks Newsletter". You will never ever miss a big stock move again! |
| 12Stocks.com: Investing in Consumer Services sector with Stocks | |
|
The following table helps investors and traders sort through current performance and trends (as measured by Smart Investing & Trading Score) of various
stocks in the Consumer Services sector. Quick View: Move mouse or cursor over stock symbol (ticker) to view short-term Technical chart and over stock name to view long term chart. Click on  to add stock symbol to your watchlist and to add stock symbol to your watchlist and  to view watchlist. Click on any ticker or stock name for detailed market intelligence report for that stock. to view watchlist. Click on any ticker or stock name for detailed market intelligence report for that stock. |
12Stocks.com Performance of Stocks in Consumer Services Sector
| Ticker | Stock Name | Watchlist | Category | Recent Price | Smart Investing & Trading Score | Change % | Weekly Change% |
| URBN | Urban Outfitters |   | Apparel | 38.78 | 51 | -1.05% | 4.87% |
| HLT | Hilton Worldwide | | Lodging | 203.93 | 58 | -0.38% | 4.86% |
| SPOT | Spotify Technology | | Broadcasting | 289.02 | 51 | 2.77% | 4.78% |
| KSS | Kohl s | | Department | 24.28 | 22 | -2.45% | 4.70% |
| DKS | DICK S | | Retail | 204.21 | 61 | -0.62% | 4.68% |
| ASO | Academy Sports | | Specialty Retail | 59.70 | 32 | 1.08% | 4.64% |
| CPNG | Coupang | | Internet Retail | 23.03 | 75 | 2.54% | 4.63% |
| ANF | Abercrombie & Fitch Co | | Apparel | 115.45 | 33 | 0.31% | 4.61% |
| DFH | Dream Finders | | Residential Construction | 35.34 | 51 | -2.38% | 4.59% |
| DPZ | Domino s | | Restaurants | 494.77 | 88 | 1.45% | 4.48% |
| TTEK | Tetra Tech | | Services | 192.92 | 68 | 1.92% | 4.47% |
| CPRT | Copart | | Automobile | 55.22 | 58 | 0.53% | 4.43% |
| OMC | Omnicom | | Advertising | 96.71 | 100 | 0.76% | 4.42% |
| SIG | Signet Jewelers | | Retail | 99.66 | 40 | 1.09% | 4.39% |
| INCR | Research | | Research | 2.64 | 29 | -1.12% | 4.35% |
| CASS | Cass Information | | Services | 43.44 | 51 | -0.62% | 4.30% |
| MATW | Matthews | | Services | 27.55 | 49 | 2.34% | 4.24% |
| FYBR | Frontier | | Telecom Services | 22.62 | 32 | 2.61% | 4.24% |
| TDUP | ThredUp | | Internet Retail | 1.63 | 35 | -1.22% | 4.17% |
| ROL | Rollins | | Services | 44.27 | 39 | 3.27% | 4.14% |
| KBR | KBR | | Services | 65.24 | 88 | 1.34% | 4.10% |
| PTVE | Pactiv Evergreen | | Packaging | 15.00 | 76 | -1.57% | 4.09% |
| TXRH | Texas Roadhouse | | Restaurants | 156.87 | 90 | 0.07% | 4.07% |
| AN | AutoNation | | Automobile | 160.38 | 81 | 0.54% | 4.05% |
| WPP | WPP | | Advertising | 50.11 | 73 | -0.28% | 4.01% |
| For chart view version of above stock list: Chart View ➞ 0 - 25 , 25 - 50 , 50 - 75 , 75 - 100 , 100 - 125 , 125 - 150 , 150 - 175 , 175 - 200 , 200 - 225 , 225 - 250 , 250 - 275 , 275 - 300 , 300 - 325 , 325 - 350 , 350 - 375 , 375 - 400 , 400 - 425 , 425 - 450 , 450 - 475 | ||
 | Click To Change The Sort Order: By Market Cap or Company Size Performance: Year-to-date, Week and Day |  |
|
Get the most comprehensive stock market coverage daily at 12Stocks.com ➞ Best Stocks Today ➞ Best Stocks Weekly ➞ Best Stocks Year-to-Date ➞ Best Stocks Trends ➞  Best Stocks Today 12Stocks.com Best Nasdaq Stocks ➞ Best S&P 500 Stocks ➞ Best Tech Stocks ➞ Best Biotech Stocks ➞ |
| Detailed Overview of Consumer Services Stocks |
| Consumer Services Technical Overview, Leaders & Laggards, Top Consumer Services ETF Funds & Detailed Consumer Services Stocks List, Charts, Trends & More |
| Consumer Services Sector: Technical Analysis, Trends & YTD Performance | |
| Consumer Services sector is composed of stocks
from retail, entertainment, media/publishing, consumer goods
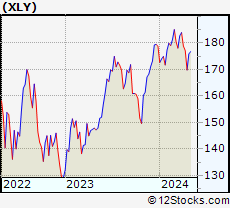
and services subsectors. Consumer Services sector, as represented by XLY, an exchange-traded fund [ETF] that holds basket of Consumer Services stocks (e.g, Walmart, Alibaba) is down by -2.5% and is currently underperforming the overall market by -7.66% year-to-date. Below is a quick view of Technical charts and trends: |
|
 XLY Weekly Chart |
|
| Long Term Trend: Good | |
| Medium Term Trend: Not Good | |
 XLY Daily Chart |
|
| Short Term Trend: Very Good | |
| Overall Trend Score: 51 | |
| YTD Performance: -2.5% | |
| **Trend Scores & Views Are Only For Educational Purposes And Not For Investing | |
| 12Stocks.com: Top Performing Consumer Services Sector Stocks | ||||||||||||||||||||||||||||||||||||||||||||||||
 The top performing Consumer Services sector stocks year to date are
Now, more recently, over last week, the top performing Consumer Services sector stocks on the move are


|
||||||||||||||||||||||||||||||||||||||||||||||||
| 12Stocks.com: Investing in Consumer Services Sector using Exchange Traded Funds | |
|
The following table shows list of key exchange traded funds (ETF) that
help investors track Consumer Services Index. For detailed view, check out our ETF Funds section of our website. Quick View: Move mouse or cursor over ETF symbol (ticker) to view short-term Technical chart and over ETF name to view long term chart. Click on ticker or stock name for detailed view. Click on to add stock symbol to your watchlist and to view watchlist. |
12Stocks.com List of ETFs that track Consumer Services Index
| Ticker | ETF Name | Watchlist | Recent Price | Smart Investing & Trading Score | Change % | Week % | Year-to-date % |
| XLY | Consumer Discret Sel | | 174.34 | 51 | 0.09 | 2.7 | -2.5% |
| RTH | Retail | | 198.66 | 44 | -0.57 | 0.02 | 5.54% |
| IYC | Consumer Services | | 77.87 | 36 | 0.05 | 2.1 | 2.77% |
| XRT | Retail | | 72.21 | 51 | -0.43 | 1.46 | -0.15% |
| IYK | Consumer Goods | | 66.98 | 75 | -0.33 | 1.78 | 4.81% |
| UCC | Consumer Services | | 33.25 | 66 | -0.36 | 5.3 | -7.4% |
| RETL | Retail Bull 3X | | 8.47 | 48 | -1.40 | 4.31 | -7.13% |
| RXI | Globl Consumer Discretionary | | 159.18 | 36 | -0.69 | 1.29 | 0.08% |
| SCC | Short Consumer Services | | 16.06 | 42 | -0.37 | -5.27 | 4.8% |
| UGE | Consumer Goods | | 17.12 | 90 | -0.70 | 2.96 | 8.76% |
| 12Stocks.com: Charts, Trends, Fundamental Data and Performances of Consumer Services Stocks | |
|
We now take in-depth look at all Consumer Services stocks including charts, multi-period performances and overall trends (as measured by Smart Investing & Trading Score). One can sort Consumer Services stocks (click link to choose) by Daily, Weekly and by Year-to-Date performances. Also, one can sort by size of the company or by market capitalization. |
| Select Your Default Chart Type: | |||||
| |||||
| Click on stock symbol or name for detailed view. Click on to add stock symbol to your watchlist and to view watchlist. Quick View: Move mouse or cursor over "Daily" to quickly view daily Technical stock chart and over "Weekly" to view weekly Technical stock chart. | |||||

 | URBN Urban Outfitters, Inc. |
| Sector: Services & Goods | |
| SubSector: Apparel Stores | |
| MarketCap: 1638.08 Millions | |
| Recent Price: 38.78 Smart Investing & Trading Score: 51 | |
| Day Percent Change: -1.05% Day Change: -0.41 | |
| Week Change: 4.87% Year-to-date Change: 8.7% | |
| URBN Links: Profile News Message Board | |
| Charts:- Daily , Weekly | |
| Add URBN to Watchlist: View: Get Complete URBN Trend Analysis ➞ | |
 | HLT Hilton Worldwide Holdings Inc. |
| Sector: Services & Goods | |
| SubSector: Lodging | |
| MarketCap: 18064.6 Millions | |
| Recent Price: 203.93 Smart Investing & Trading Score: 58 | |
| Day Percent Change: -0.38% Day Change: -0.77 | |
| Week Change: 4.86% Year-to-date Change: 12.0% | |
| HLT Links: Profile News Message Board | |
| Charts:- Daily , Weekly | |
| Add HLT to Watchlist: View: Get Complete HLT Trend Analysis ➞ | |
 | SPOT Spotify Technology S.A. |
| Sector: Services & Goods | |
| SubSector: Broadcasting - Radio | |
| MarketCap: 24379.5 Millions | |
| Recent Price: 289.02 Smart Investing & Trading Score: 51 | |
| Day Percent Change: 2.77% Day Change: 7.79 | |
| Week Change: 4.78% Year-to-date Change: 53.8% | |
| SPOT Links: Profile News Message Board | |
| Charts:- Daily , Weekly | |
| Add SPOT to Watchlist: View: Get Complete SPOT Trend Analysis ➞ | |
 | KSS Kohl s Corporation |
| Sector: Services & Goods | |
| SubSector: Department Stores | |
| MarketCap: 3068 Millions | |
| Recent Price: 24.28 Smart Investing & Trading Score: 22 | |
| Day Percent Change: -2.45% Day Change: -0.61 | |
| Week Change: 4.7% Year-to-date Change: -15.3% | |
| KSS Links: Profile News Message Board | |
| Charts:- Daily , Weekly | |
| Add KSS to Watchlist: View: Get Complete KSS Trend Analysis ➞ | |
 | DKS DICK S Sporting Goods, Inc. |
| Sector: Services & Goods | |
| SubSector: Sporting Goods Stores | |
| MarketCap: 1672.04 Millions | |
| Recent Price: 204.21 Smart Investing & Trading Score: 61 | |
| Day Percent Change: -0.62% Day Change: -1.27 | |
| Week Change: 4.68% Year-to-date Change: 39.0% | |
| DKS Links: Profile News Message Board | |
| Charts:- Daily , Weekly | |
| Add DKS to Watchlist: View: Get Complete DKS Trend Analysis ➞ | |
 | ASO Academy Sports and Outdoors, Inc. |
| Sector: Services & Goods | |
| SubSector: Specialty Retail | |
| MarketCap: 16027 Millions | |
| Recent Price: 59.70 Smart Investing & Trading Score: 32 | |
| Day Percent Change: 1.08% Day Change: 0.64 | |
| Week Change: 4.64% Year-to-date Change: -9.6% | |
| ASO Links: Profile News Message Board | |
| Charts:- Daily , Weekly | |
| Add ASO to Watchlist: View: Get Complete ASO Trend Analysis ➞ | |
 | CPNG Coupang, Inc. |
| Sector: Services & Goods | |
| SubSector: Internet Retail | |
| MarketCap: 30840 Millions | |
| Recent Price: 23.03 Smart Investing & Trading Score: 75 | |
| Day Percent Change: 2.54% Day Change: 0.57 | |
| Week Change: 4.63% Year-to-date Change: 42.2% | |
| CPNG Links: Profile News Message Board | |
| Charts:- Daily , Weekly | |
| Add CPNG to Watchlist: View: Get Complete CPNG Trend Analysis ➞ | |
 | ANF Abercrombie & Fitch Co. |
| Sector: Services & Goods | |
| SubSector: Apparel Stores | |
| MarketCap: 589.108 Millions | |
| Recent Price: 115.45 Smart Investing & Trading Score: 33 | |
| Day Percent Change: 0.31% Day Change: 0.36 | |
| Week Change: 4.61% Year-to-date Change: 30.9% | |
| ANF Links: Profile News Message Board | |
| Charts:- Daily , Weekly | |
| Add ANF to Watchlist: View: Get Complete ANF Trend Analysis ➞ | |
 | DFH Dream Finders Homes, Inc. |
| Sector: Services & Goods | |
| SubSector: Residential Construction | |
| MarketCap: 2270 Millions | |
| Recent Price: 35.34 Smart Investing & Trading Score: 51 | |
| Day Percent Change: -2.38% Day Change: -0.86 | |
| Week Change: 4.59% Year-to-date Change: -1.8% | |
| DFH Links: Profile News Message Board | |
| Charts:- Daily , Weekly | |
| Add DFH to Watchlist: View: Get Complete DFH Trend Analysis ➞ | |
 | DPZ Domino s Pizza, Inc. |
| Sector: Services & Goods | |
| SubSector: Restaurants | |
| MarketCap: 12166 Millions | |
| Recent Price: 494.77 Smart Investing & Trading Score: 88 | |
| Day Percent Change: 1.45% Day Change: 7.06 | |
| Week Change: 4.48% Year-to-date Change: 20.0% | |
| DPZ Links: Profile News Message Board | |
| Charts:- Daily , Weekly | |
| Add DPZ to Watchlist: View: Get Complete DPZ Trend Analysis ➞ | |
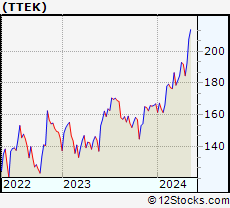 | TTEK Tetra Tech, Inc. |
| Sector: Services & Goods | |
| SubSector: Technical Services | |
| MarketCap: 3985.5 Millions | |
| Recent Price: 192.92 Smart Investing & Trading Score: 68 | |
| Day Percent Change: 1.92% Day Change: 3.63 | |
| Week Change: 4.47% Year-to-date Change: 15.6% | |
| TTEK Links: Profile News Message Board | |
| Charts:- Daily , Weekly | |
| Add TTEK to Watchlist: View: Get Complete TTEK Trend Analysis ➞ | |
 | CPRT Copart, Inc. |
| Sector: Services & Goods | |
| SubSector: Auto Dealerships | |
| MarketCap: 15462.1 Millions | |
| Recent Price: 55.22 Smart Investing & Trading Score: 58 | |
| Day Percent Change: 0.53% Day Change: 0.29 | |
| Week Change: 4.43% Year-to-date Change: 12.7% | |
| CPRT Links: Profile News Message Board | |
| Charts:- Daily , Weekly | |
| Add CPRT to Watchlist: View: Get Complete CPRT Trend Analysis ➞ | |
 | OMC Omnicom Group Inc. |
| Sector: Services & Goods | |
| SubSector: Advertising Agencies | |
| MarketCap: 11813.5 Millions | |
| Recent Price: 96.71 Smart Investing & Trading Score: 100 | |
| Day Percent Change: 0.76% Day Change: 0.73 | |
| Week Change: 4.42% Year-to-date Change: 11.8% | |
| OMC Links: Profile News Message Board | |
| Charts:- Daily , Weekly | |
| Add OMC to Watchlist: View: Get Complete OMC Trend Analysis ➞ | |
 | SIG Signet Jewelers Limited |
| Sector: Services & Goods | |
| SubSector: Jewelry Stores | |
| MarketCap: 518.1 Millions | |
| Recent Price: 99.66 Smart Investing & Trading Score: 40 | |
| Day Percent Change: 1.09% Day Change: 1.07 | |
| Week Change: 4.39% Year-to-date Change: -7.1% | |
| SIG Links: Profile News Message Board | |
| Charts:- Daily , Weekly | |
| Add SIG to Watchlist: View: Get Complete SIG Trend Analysis ➞ | |
 | INCR INC Research Holdings, Inc. |
| Sector: Services & Goods | |
| SubSector: Research Services | |
| MarketCap: 2486.94 Millions | |
| Recent Price: 2.64 Smart Investing & Trading Score: 29 | |
| Day Percent Change: -1.12% Day Change: -0.03 | |
| Week Change: 4.35% Year-to-date Change: 104.7% | |
| INCR Links: Profile News Message Board | |
| Charts:- Daily , Weekly | |
| Add INCR to Watchlist: View: Get Complete INCR Trend Analysis ➞ | |
 | CASS Cass Information Systems, Inc. |
| Sector: Services & Goods | |
| SubSector: Business Services | |
| MarketCap: 477.382 Millions | |
| Recent Price: 43.44 Smart Investing & Trading Score: 51 | |
| Day Percent Change: -0.62% Day Change: -0.27 | |
| Week Change: 4.3% Year-to-date Change: -3.6% | |
| CASS Links: Profile News Message Board | |
| Charts:- Daily , Weekly | |
| Add CASS to Watchlist: View: Get Complete CASS Trend Analysis ➞ | |
 | MATW Matthews International Corporation |
| Sector: Services & Goods | |
| SubSector: Personal Services | |
| MarketCap: 803.325 Millions | |
| Recent Price: 27.55 Smart Investing & Trading Score: 49 | |
| Day Percent Change: 2.34% Day Change: 0.63 | |
| Week Change: 4.24% Year-to-date Change: -24.8% | |
| MATW Links: Profile News Message Board | |
| Charts:- Daily , Weekly | |
| Add MATW to Watchlist: View: Get Complete MATW Trend Analysis ➞ | |
 | FYBR Frontier Communications Parent, Inc. |
| Sector: Services & Goods | |
| SubSector: Telecom Services | |
| MarketCap: 4460 Millions | |
| Recent Price: 22.62 Smart Investing & Trading Score: 32 | |
| Day Percent Change: 2.61% Day Change: 0.57 | |
| Week Change: 4.24% Year-to-date Change: -10.3% | |
| FYBR Links: Profile News Message Board | |
| Charts:- Daily , Weekly | |
| Add FYBR to Watchlist: View: Get Complete FYBR Trend Analysis ➞ | |
 | TDUP ThredUp Inc. |
| Sector: Services & Goods | |
| SubSector: Internet Retail | |
| MarketCap: 258 Millions | |
| Recent Price: 1.63 Smart Investing & Trading Score: 35 | |
| Day Percent Change: -1.22% Day Change: -0.02 | |
| Week Change: 4.17% Year-to-date Change: -28.1% | |
| TDUP Links: Profile News Message Board | |
| Charts:- Daily , Weekly | |
| Add TDUP to Watchlist: View: Get Complete TDUP Trend Analysis ➞ | |
 | ROL Rollins, Inc. |
| Sector: Services & Goods | |
| SubSector: Business Services | |
| MarketCap: 12827.4 Millions | |
| Recent Price: 44.27 Smart Investing & Trading Score: 39 | |
| Day Percent Change: 3.27% Day Change: 1.40 | |
| Week Change: 4.14% Year-to-date Change: 1.4% | |
| ROL Links: Profile News Message Board | |
| Charts:- Daily , Weekly | |
| Add ROL to Watchlist: View: Get Complete ROL Trend Analysis ➞ | |
 | KBR KBR, Inc. |
| Sector: Services & Goods | |
| SubSector: Technical Services | |
| MarketCap: 2526.1 Millions | |
| Recent Price: 65.24 Smart Investing & Trading Score: 88 | |
| Day Percent Change: 1.34% Day Change: 0.86 | |
| Week Change: 4.1% Year-to-date Change: 17.7% | |
| KBR Links: Profile News Message Board | |
| Charts:- Daily , Weekly | |
| Add KBR to Watchlist: View: Get Complete KBR Trend Analysis ➞ | |
 | PTVE Pactiv Evergreen Inc. |
| Sector: Services & Goods | |
| SubSector: Packaging & Containers | |
| MarketCap: 33427 Millions | |
| Recent Price: 15.00 Smart Investing & Trading Score: 76 | |
| Day Percent Change: -1.57% Day Change: -0.24 | |
| Week Change: 4.09% Year-to-date Change: 9.3% | |
| PTVE Links: Profile News Message Board | |
| Charts:- Daily , Weekly | |
| Add PTVE to Watchlist: View: Get Complete PTVE Trend Analysis ➞ | |
 | TXRH Texas Roadhouse, Inc. |
| Sector: Services & Goods | |
| SubSector: Restaurants | |
| MarketCap: 2569.4 Millions | |
| Recent Price: 156.87 Smart Investing & Trading Score: 90 | |
| Day Percent Change: 0.07% Day Change: 0.11 | |
| Week Change: 4.07% Year-to-date Change: 28.3% | |
| TXRH Links: Profile News Message Board | |
| Charts:- Daily , Weekly | |
| Add TXRH to Watchlist: View: Get Complete TXRH Trend Analysis ➞ | |
 | AN AutoNation, Inc. |
| Sector: Services & Goods | |
| SubSector: Auto Dealerships | |
| MarketCap: 2732.61 Millions | |
| Recent Price: 160.38 Smart Investing & Trading Score: 81 | |
| Day Percent Change: 0.54% Day Change: 0.86 | |
| Week Change: 4.05% Year-to-date Change: 6.8% | |
| AN Links: Profile News Message Board | |
| Charts:- Daily , Weekly | |
| Add AN to Watchlist: View: Get Complete AN Trend Analysis ➞ | |
 | WPP WPP plc |
| Sector: Services & Goods | |
| SubSector: Advertising Agencies | |
| MarketCap: 7840.25 Millions | |
| Recent Price: 50.11 Smart Investing & Trading Score: 73 | |
| Day Percent Change: -0.28% Day Change: -0.14 | |
| Week Change: 4.01% Year-to-date Change: 5.3% | |
| WPP Links: Profile News Message Board | |
| Charts:- Daily , Weekly | |
| Add WPP to Watchlist: View: Get Complete WPP Trend Analysis ➞ | |
| For tabular summary view of above stock list: Summary View ➞ 0 - 25 , 25 - 50 , 50 - 75 , 75 - 100 , 100 - 125 , 125 - 150 , 150 - 175 , 175 - 200 , 200 - 225 , 225 - 250 , 250 - 275 , 275 - 300 , 300 - 325 , 325 - 350 , 350 - 375 , 375 - 400 , 400 - 425 , 425 - 450 , 450 - 475 | ||
| Click To Change The Sort Order: By Market Cap or Company Size Performance: Year-to-date, Week and Day | |
| Select Chart Type: | ||
|
Best Stocks Today 12Stocks.com |
© 2024 12Stocks.com Terms & Conditions Privacy Contact Us
All Information Provided Only For Education And Not To Be Used For Investing or Trading. See Terms & Conditions


One More Thing ... Get Best Stocks Delivered Daily!
Never Ever Miss A Move With Our Top Ten Stocks Lists
Find Best Stocks In Any Market - Bull or Bear Market
Take A Peek At Our Top Ten Stocks Lists: Daily, Weekly, Year-to-Date & Top Trends
Find Best Stocks In Any Market - Bull or Bear Market
Take A Peek At Our Top Ten Stocks Lists: Daily, Weekly, Year-to-Date & Top Trends
Consumer Services Stocks With Best Up Trends [0-bearish to 100-bullish]: Ardagh Metal[100], Chipotle Mexican[100], Churchill Downs[100], Yatsen Holding[100], Tractor Supply[100], Omnicom [100], Dada Nexus[100], FTI Consulting[100], Avnet [100], Alibaba [100], 1[100]
Best Consumer Services Stocks Year-to-Date:
U Power[2852.01%], Vroom [1804.53%], Yatsen Holding[502.79%], Fluent [298.51%], Codere Online[133.9%], Research[104.68%], Sweetgreen [101.42%], RealReal [69.4%], PaySign [56.43%], Bright Scholar[56%], Spotify Technology[53.81%] Best Consumer Services Stocks This Week:
Chicken Soup[210%], Yatsen Holding[21.99%], Hibbett Sports[21.03%], Strategic Education[19.29%], Noodles & [18.07%], K12 [17.39%], TAL Education[16.8%], Sonic Automotive[16.56%], Golden Heaven[15.91%], Ardagh Metal[14.9%], Altisource Portfolio[13.33%] Best Consumer Services Stocks Daily:
Strategic Education[16.28%], Boqii Holding[15.69%], Sonic Automotive[10.86%], Altisource Portfolio[10.00%], TAL Education[8.89%], Ardagh Metal[8.82%], MOGU [8.43%], TransUnion [8.17%], Noodles & [8.08%], Chipotle Mexican[6.33%], Soho House[6.30%]