
 Login Sign Up


| |||||
 |  | ||||

| 12Stocks.com Market Intelligence |
Best Consumer Services Stocks
| In a hurry? Services & Goods Stocks: Performance Trends Table, Stock Charts
Sort Consumer Services: Daily, Weekly, Year-to-Date, Market Cap & Trends. Filter Services & Goods stocks list by size: All Large Mid-Range Small |
| 12Stocks.com Consumer Services Stocks Performances & Trends Daily | |||||||||
|
|  The overall Smart Investing & Trading Score is 23 (0-bearish to 100-bullish) which puts Consumer Services sector in short term bearish to neutral trend. The Smart Investing & Trading Score from previous trading session is 26 and hence a deterioration of trend.
| ||||||||
Here are the Smart Investing & Trading Scores of the most requested Consumer Services stocks at 12Stocks.com (click stock name for detailed review):
|


| Consider signing up for our daily 12Stocks.com "Best Stocks Newsletter". You will never ever miss a big stock move again! |
| 12Stocks.com: Investing in Consumer Services sector with Stocks | |
|
The following table helps investors and traders sort through current performance and trends (as measured by Smart Investing & Trading Score) of various
stocks in the Consumer Services sector. Quick View: Move mouse or cursor over stock symbol (ticker) to view short-term Technical chart and over stock name to view long term chart. Click on  to add stock symbol to your watchlist and to add stock symbol to your watchlist and  to view watchlist. Click on any ticker or stock name for detailed market intelligence report for that stock. to view watchlist. Click on any ticker or stock name for detailed market intelligence report for that stock. |
12Stocks.com Performance of Stocks in Consumer Services Sector
| Ticker | Stock Name | Watchlist | Category | Recent Price | Smart Investing & Trading Score | Change % | Weekly Change% |
| SAH | Sonic Automotive |   | Automobile | 49.19 | 17 | 1.17% | -1.42% |
| KFRC | Kforce | | Staffing | 63.92 | 10 | 0.77% | -1.45% |
| EDU | New Oriental | | Education | 85.29 | 58 | 0.88% | -1.47% |
| BATRA | Liberty Braves | | Broadcasting | 40.76 | 0 | 0.74% | -1.47% |
| LI | Li Auto | | Auto Manufacturers | 28.95 | 58 | 0.78% | -1.48% |
| MNSO | MINISO | | Specialty Retail | 20.86 | 76 | 1.43% | -1.49% |
| RRGB | Red Robin | | Restaurants | 5.91 | 27 | -0.67% | -1.50% |
| GLP | Global Partners | | Basic Materials Wholesale | 45.12 | 22 | -0.64% | -1.51% |
| YUMC | Yum China | | Restaurants | 36.77 | 36 | -0.28% | -1.51% |
| TGNA | TEGNA | | Broadcasting | 13.39 | 27 | 0.90% | -1.54% |
| MSM | MSC Industrial | | Equipment | 91.11 | 10 | 0.01% | -1.69% |
| QSR | Restaurant Brands | | Restaurants | 70.99 | 17 | 0.37% | -1.69% |
| ABG | Asbury Automotive | | Automobile | 213.78 | 26 | 0.90% | -1.71% |
| MCW | Mister Car | | Services | 6.62 | 18 | 1.93% | -1.71% |
| CMG | Chipotle Mexican | | Restaurants | 2906.87 | 51 | 0.13% | -1.72% |
| ARW | Arrow Electronics | | Retail | 122.10 | 36 | 0.11% | -1.73% |
| GDEV | GDEV | | Electronic Gaming & Multimedia | 2.27 | 37 | 0.89% | -1.73% |
| COST | Costco Wholesale | | Retail | 718.52 | 51 | 0.47% | -1.75% |
| AEO | American Eagle | | Apparel | 22.66 | 51 | 1.32% | -1.76% |
| KFY | Korn Ferry | | Staffing | 60.38 | 31 | 0.64% | -1.80% |
| ROST | Ross Stores | | Apparel | 133.53 | 18 | 0.56% | -1.81% |
| CHGG | Chegg | | Education | 7.02 | 22 | 1.74% | -1.82% |
| PZZA | Papa John | | Restaurants | 60.63 | 10 | -0.53% | -1.86% |
| MCS | Marcus | | Entertainment | 12.88 | 10 | 0.35% | -1.87% |
| M | Macy s | | Department | 18.94 | 68 | -0.37% | -1.87% |
| For chart view version of above stock list: Chart View ➞ 0 - 25 , 25 - 50 , 50 - 75 , 75 - 100 , 100 - 125 , 125 - 150 , 150 - 175 , 175 - 200 , 200 - 225 , 225 - 250 , 250 - 275 , 275 - 300 , 300 - 325 , 325 - 350 , 350 - 375 , 375 - 400 , 400 - 425 | ||
 | Click To Change The Sort Order: By Market Cap or Company Size Performance: Year-to-date, Week and Day |  |
|
Get the most comprehensive stock market coverage daily at 12Stocks.com ➞ Best Stocks Today ➞ Best Stocks Weekly ➞ Best Stocks Year-to-Date ➞ Best Stocks Trends ➞  Best Stocks Today 12Stocks.com Best Nasdaq Stocks ➞ Best S&P 500 Stocks ➞ Best Tech Stocks ➞ Best Biotech Stocks ➞ |
| Detailed Overview of Consumer Services Stocks |
| Consumer Services Technical Overview, Leaders & Laggards, Top Consumer Services ETF Funds & Detailed Consumer Services Stocks List, Charts, Trends & More |
| Consumer Services Sector: Technical Analysis, Trends & YTD Performance | |
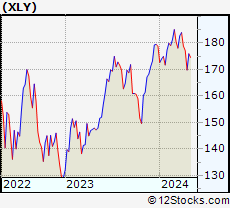
| Consumer Services sector is composed of stocks
from retail, entertainment, media/publishing, consumer goods
and services subsectors. Consumer Services sector, as represented by XLY, an exchange-traded fund [ETF] that holds basket of Consumer Services stocks (e.g, Walmart, Alibaba) is down by -3.69% and is currently underperforming the overall market by -8.24% year-to-date. Below is a quick view of Technical charts and trends: |
|
 XLY Weekly Chart |
|
| Long Term Trend: Good | |
| Medium Term Trend: Not Good | |
 XLY Daily Chart |
|
| Short Term Trend: Not Good | |
| Overall Trend Score: 23 | |
| YTD Performance: -3.69% | |
| **Trend Scores & Views Are Only For Educational Purposes And Not For Investing | |
| 12Stocks.com: Top Performing Consumer Services Sector Stocks | ||||||||||||||||||||||||||||||||||||||||||||||||
 The top performing Consumer Services sector stocks year to date are
Now, more recently, over last week, the top performing Consumer Services sector stocks on the move are


|
||||||||||||||||||||||||||||||||||||||||||||||||
| 12Stocks.com: Investing in Consumer Services Sector using Exchange Traded Funds | |
|
The following table shows list of key exchange traded funds (ETF) that
help investors track Consumer Services Index. For detailed view, check out our ETF Funds section of our website. Quick View: Move mouse or cursor over ETF symbol (ticker) to view short-term Technical chart and over ETF name to view long term chart. Click on ticker or stock name for detailed view. Click on to add stock symbol to your watchlist and to view watchlist. |
12Stocks.com List of ETFs that track Consumer Services Index
| Ticker | ETF Name | Watchlist | Recent Price | Smart Investing & Trading Score | Change % | Week % | Year-to-date % |
| XLY | Consumer Discret Sel | | 172.21 | 23 | -0.07 | -2.77 | -3.69% |
| RTH | Retail | | 199.17 | 44 | 0.08 | -1.25 | 5.81% |
| XRT | Retail | | 71.00 | 51 | 0.49 | -1.22 | -1.82% |
| UCC | Consumer Services | | 32.41 | 40 | -1.07 | -5.86 | -9.74% |
| SCC | Short Consumer Services | | 16.42 | 74 | -0.11 | 5.49 | 7.17% |
| UGE | Consumer Goods | | 16.19 | 60 | 0.39 | 0.03 | 2.87% |
| 12Stocks.com: Charts, Trends, Fundamental Data and Performances of Consumer Services Stocks | |
|
We now take in-depth look at all Consumer Services stocks including charts, multi-period performances and overall trends (as measured by Smart Investing & Trading Score). One can sort Consumer Services stocks (click link to choose) by Daily, Weekly and by Year-to-Date performances. Also, one can sort by size of the company or by market capitalization. |
| Select Your Default Chart Type: | |||||
| |||||
| Click on stock symbol or name for detailed view. Click on to add stock symbol to your watchlist and to view watchlist. Quick View: Move mouse or cursor over "Daily" to quickly view daily Technical stock chart and over "Weekly" to view weekly Technical stock chart. | |||||

 | SAH Sonic Automotive, Inc. |
| Sector: Services & Goods | |
| SubSector: Auto Dealerships | |
| MarketCap: 581.321 Millions | |
| Recent Price: 49.19 Smart Investing & Trading Score: 17 | |
| Day Percent Change: 1.17% Day Change: 0.57 | |
| Week Change: -1.42% Year-to-date Change: -12.5% | |
| SAH Links: Profile News Message Board | |
| Charts:- Daily , Weekly | |
| Add SAH to Watchlist: View: Get Complete SAH Trend Analysis ➞ | |
 | KFRC Kforce Inc. |
| Sector: Services & Goods | |
| SubSector: Staffing & Outsourcing Services | |
| MarketCap: 622.828 Millions | |
| Recent Price: 63.92 Smart Investing & Trading Score: 10 | |
| Day Percent Change: 0.77% Day Change: 0.49 | |
| Week Change: -1.45% Year-to-date Change: -5.4% | |
| KFRC Links: Profile News Message Board | |
| Charts:- Daily , Weekly | |
| Add KFRC to Watchlist: View: Get Complete KFRC Trend Analysis ➞ | |
 | EDU New Oriental Education & Technology Group Inc. |
| Sector: Services & Goods | |
| SubSector: Education & Training Services | |
| MarketCap: 18673.7 Millions | |
| Recent Price: 85.29 Smart Investing & Trading Score: 58 | |
| Day Percent Change: 0.88% Day Change: 0.74 | |
| Week Change: -1.47% Year-to-date Change: 16.4% | |
| EDU Links: Profile News Message Board | |
| Charts:- Daily , Weekly | |
| Add EDU to Watchlist: View: Get Complete EDU Trend Analysis ➞ | |
 | BATRA The Liberty Braves Group |
| Sector: Services & Goods | |
| SubSector: Broadcasting - TV | |
| MarketCap: 18873.5 Millions | |
| Recent Price: 40.76 Smart Investing & Trading Score: 0 | |
| Day Percent Change: 0.74% Day Change: 0.30 | |
| Week Change: -1.47% Year-to-date Change: -4.7% | |
| BATRA Links: Profile News Message Board | |
| Charts:- Daily , Weekly | |
| Add BATRA to Watchlist: View: Get Complete BATRA Trend Analysis ➞ | |
 | LI Li Auto Inc. |
| Sector: Services & Goods | |
| SubSector: Auto Manufacturers | |
| MarketCap: 29167 Millions | |
| Recent Price: 28.95 Smart Investing & Trading Score: 58 | |
| Day Percent Change: 0.78% Day Change: 0.22 | |
| Week Change: -1.48% Year-to-date Change: -22.7% | |
| LI Links: Profile News Message Board | |
| Charts:- Daily , Weekly | |
| Add LI to Watchlist: View: Get Complete LI Trend Analysis ➞ | |
 | MNSO MINISO Group Holding Limited |
| Sector: Services & Goods | |
| SubSector: Specialty Retail | |
| MarketCap: 69427 Millions | |
| Recent Price: 20.86 Smart Investing & Trading Score: 76 | |
| Day Percent Change: 1.43% Day Change: 0.30 | |
| Week Change: -1.49% Year-to-date Change: 2.2% | |
| MNSO Links: Profile News Message Board | |
| Charts:- Daily , Weekly | |
| Add MNSO to Watchlist: View: Get Complete MNSO Trend Analysis ➞ | |
 | RRGB Red Robin Gourmet Burgers, Inc. |
| Sector: Services & Goods | |
| SubSector: Restaurants | |
| MarketCap: 121.57 Millions | |
| Recent Price: 5.91 Smart Investing & Trading Score: 27 | |
| Day Percent Change: -0.67% Day Change: -0.04 | |
| Week Change: -1.5% Year-to-date Change: -52.6% | |
| RRGB Links: Profile News Message Board | |
| Charts:- Daily , Weekly | |
| Add RRGB to Watchlist: View: Get Complete RRGB Trend Analysis ➞ | |
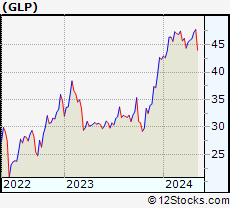 | GLP Global Partners LP |
| Sector: Services & Goods | |
| SubSector: Basic Materials Wholesale | |
| MarketCap: 416.73 Millions | |
| Recent Price: 45.12 Smart Investing & Trading Score: 22 | |
| Day Percent Change: -0.64% Day Change: -0.29 | |
| Week Change: -1.51% Year-to-date Change: 6.6% | |
| GLP Links: Profile News Message Board | |
| Charts:- Daily , Weekly | |
| Add GLP to Watchlist: View: Get Complete GLP Trend Analysis ➞ | |
 | YUMC Yum China Holdings, Inc. |
| Sector: Services & Goods | |
| SubSector: Restaurants | |
| MarketCap: 16284.5 Millions | |
| Recent Price: 36.77 Smart Investing & Trading Score: 36 | |
| Day Percent Change: -0.28% Day Change: -0.11 | |
| Week Change: -1.51% Year-to-date Change: -13.3% | |
| YUMC Links: Profile News Message Board | |
| Charts:- Daily , Weekly | |
| Add YUMC to Watchlist: View: Get Complete YUMC Trend Analysis ➞ | |
 | TGNA TEGNA Inc. |
| Sector: Services & Goods | |
| SubSector: Broadcasting - TV | |
| MarketCap: 2791.83 Millions | |
| Recent Price: 13.39 Smart Investing & Trading Score: 27 | |
| Day Percent Change: 0.90% Day Change: 0.12 | |
| Week Change: -1.54% Year-to-date Change: -12.5% | |
| TGNA Links: Profile News Message Board | |
| Charts:- Daily , Weekly | |
| Add TGNA to Watchlist: View: Get Complete TGNA Trend Analysis ➞ | |
 | MSM MSC Industrial Direct Co., Inc. |
| Sector: Services & Goods | |
| SubSector: Industrial Equipment Wholesale | |
| MarketCap: 2701.88 Millions | |
| Recent Price: 91.11 Smart Investing & Trading Score: 10 | |
| Day Percent Change: 0.01% Day Change: 0.01 | |
| Week Change: -1.69% Year-to-date Change: -10.0% | |
| MSM Links: Profile News Message Board | |
| Charts:- Daily , Weekly | |
| Add MSM to Watchlist: View: Get Complete MSM Trend Analysis ➞ | |
 | QSR Restaurant Brands International Inc. |
| Sector: Services & Goods | |
| SubSector: Restaurants | |
| MarketCap: 9551 Millions | |
| Recent Price: 70.99 Smart Investing & Trading Score: 17 | |
| Day Percent Change: 0.37% Day Change: 0.26 | |
| Week Change: -1.69% Year-to-date Change: -9.1% | |
| QSR Links: Profile News Message Board | |
| Charts:- Daily , Weekly | |
| Add QSR to Watchlist: View: Get Complete QSR Trend Analysis ➞ | |
 | ABG Asbury Automotive Group, Inc. |
| Sector: Services & Goods | |
| SubSector: Auto Dealerships | |
| MarketCap: 1203.21 Millions | |
| Recent Price: 213.78 Smart Investing & Trading Score: 26 | |
| Day Percent Change: 0.90% Day Change: 1.91 | |
| Week Change: -1.71% Year-to-date Change: -5.0% | |
| ABG Links: Profile News Message Board | |
| Charts:- Daily , Weekly | |
| Add ABG to Watchlist: View: Get Complete ABG Trend Analysis ➞ | |
 | MCW Mister Car Wash, Inc. |
| Sector: Services & Goods | |
| SubSector: Personal Services | |
| MarketCap: 2790 Millions | |
| Recent Price: 6.62 Smart Investing & Trading Score: 18 | |
| Day Percent Change: 1.93% Day Change: 0.13 | |
| Week Change: -1.71% Year-to-date Change: -23.2% | |
| MCW Links: Profile News Message Board | |
| Charts:- Daily , Weekly | |
| Add MCW to Watchlist: View: Get Complete MCW Trend Analysis ➞ | |
 | CMG Chipotle Mexican Grill, Inc. |
| Sector: Services & Goods | |
| SubSector: Restaurants | |
| MarketCap: 16849.9 Millions | |
| Recent Price: 2906.87 Smart Investing & Trading Score: 51 | |
| Day Percent Change: 0.13% Day Change: 3.91 | |
| Week Change: -1.72% Year-to-date Change: 27.1% | |
| CMG Links: Profile News Message Board | |
| Charts:- Daily , Weekly | |
| Add CMG to Watchlist: View: Get Complete CMG Trend Analysis ➞ | |
 | ARW Arrow Electronics, Inc. |
| Sector: Services & Goods | |
| SubSector: Electronics Wholesale | |
| MarketCap: 4155.03 Millions | |
| Recent Price: 122.10 Smart Investing & Trading Score: 36 | |
| Day Percent Change: 0.11% Day Change: 0.14 | |
| Week Change: -1.73% Year-to-date Change: -0.1% | |
| ARW Links: Profile News Message Board | |
| Charts:- Daily , Weekly | |
| Add ARW to Watchlist: View: Get Complete ARW Trend Analysis ➞ | |
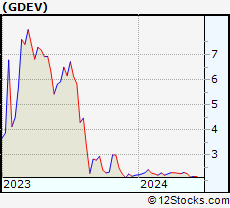 | GDEV GDEV Inc. |
| Sector: Services & Goods | |
| SubSector: Electronic Gaming & Multimedia | |
| MarketCap: 1300 Millions | |
| Recent Price: 2.27 Smart Investing & Trading Score: 37 | |
| Day Percent Change: 0.89% Day Change: 0.02 | |
| Week Change: -1.73% Year-to-date Change: 3.2% | |
| GDEV Links: Profile News Message Board | |
| Charts:- Daily , Weekly | |
| Add GDEV to Watchlist: View: Get Complete GDEV Trend Analysis ➞ | |
 | COST Costco Wholesale Corporation |
| Sector: Services & Goods | |
| SubSector: Discount, Variety Stores | |
| MarketCap: 136355 Millions | |
| Recent Price: 718.52 Smart Investing & Trading Score: 51 | |
| Day Percent Change: 0.47% Day Change: 3.33 | |
| Week Change: -1.75% Year-to-date Change: 8.9% | |
| COST Links: Profile News Message Board | |
| Charts:- Daily , Weekly | |
| Add COST to Watchlist: View: Get Complete COST Trend Analysis ➞ | |
 | AEO American Eagle Outfitters, Inc. |
| Sector: Services & Goods | |
| SubSector: Apparel Stores | |
| MarketCap: 1577.08 Millions | |
| Recent Price: 22.66 Smart Investing & Trading Score: 51 | |
| Day Percent Change: 1.32% Day Change: 0.29 | |
| Week Change: -1.76% Year-to-date Change: 7.1% | |
| AEO Links: Profile News Message Board | |
| Charts:- Daily , Weekly | |
| Add AEO to Watchlist: View: Get Complete AEO Trend Analysis ➞ | |
 | KFY Korn Ferry |
| Sector: Services & Goods | |
| SubSector: Staffing & Outsourcing Services | |
| MarketCap: 1534.28 Millions | |
| Recent Price: 60.38 Smart Investing & Trading Score: 31 | |
| Day Percent Change: 0.64% Day Change: 0.38 | |
| Week Change: -1.8% Year-to-date Change: 1.7% | |
| KFY Links: Profile News Message Board | |
| Charts:- Daily , Weekly | |
| Add KFY to Watchlist: View: Get Complete KFY Trend Analysis ➞ | |
 | ROST Ross Stores, Inc. |
| Sector: Services & Goods | |
| SubSector: Apparel Stores | |
| MarketCap: 24938.8 Millions | |
| Recent Price: 133.53 Smart Investing & Trading Score: 18 | |
| Day Percent Change: 0.56% Day Change: 0.74 | |
| Week Change: -1.81% Year-to-date Change: -3.5% | |
| ROST Links: Profile News Message Board | |
| Charts:- Daily , Weekly | |
| Add ROST to Watchlist: View: Get Complete ROST Trend Analysis ➞ | |
 | CHGG Chegg, Inc. |
| Sector: Services & Goods | |
| SubSector: Education & Training Services | |
| MarketCap: 3606.86 Millions | |
| Recent Price: 7.02 Smart Investing & Trading Score: 22 | |
| Day Percent Change: 1.74% Day Change: 0.12 | |
| Week Change: -1.82% Year-to-date Change: -38.2% | |
| CHGG Links: Profile News Message Board | |
| Charts:- Daily , Weekly | |
| Add CHGG to Watchlist: View: Get Complete CHGG Trend Analysis ➞ | |
 | PZZA Papa John s International, Inc. |
| Sector: Services & Goods | |
| SubSector: Specialty Eateries | |
| MarketCap: 1925.27 Millions | |
| Recent Price: 60.63 Smart Investing & Trading Score: 10 | |
| Day Percent Change: -0.53% Day Change: -0.32 | |
| Week Change: -1.86% Year-to-date Change: -20.5% | |
| PZZA Links: Profile News Message Board | |
| Charts:- Daily , Weekly | |
| Add PZZA to Watchlist: View: Get Complete PZZA Trend Analysis ➞ | |
 | MCS The Marcus Corporation |
| Sector: Services & Goods | |
| SubSector: Entertainment - Diversified | |
| MarketCap: 441.437 Millions | |
| Recent Price: 12.88 Smart Investing & Trading Score: 10 | |
| Day Percent Change: 0.35% Day Change: 0.04 | |
| Week Change: -1.87% Year-to-date Change: -11.7% | |
| MCS Links: Profile News Message Board | |
| Charts:- Daily , Weekly | |
| Add MCS to Watchlist: View: Get Complete MCS Trend Analysis ➞ | |
 | M Macy s, Inc. |
| Sector: Services & Goods | |
| SubSector: Department Stores | |
| MarketCap: 2391.72 Millions | |
| Recent Price: 18.94 Smart Investing & Trading Score: 68 | |
| Day Percent Change: -0.37% Day Change: -0.07 | |
| Week Change: -1.87% Year-to-date Change: -5.9% | |
| M Links: Profile News Message Board | |
| Charts:- Daily , Weekly | |
| Add M to Watchlist: View: Get Complete M Trend Analysis ➞ | |
| For tabular summary view of above stock list: Summary View ➞ 0 - 25 , 25 - 50 , 50 - 75 , 75 - 100 , 100 - 125 , 125 - 150 , 150 - 175 , 175 - 200 , 200 - 225 , 225 - 250 , 250 - 275 , 275 - 300 , 300 - 325 , 325 - 350 , 350 - 375 , 375 - 400 , 400 - 425 | ||
| Click To Change The Sort Order: By Market Cap or Company Size Performance: Year-to-date, Week and Day | |
| Select Chart Type: | ||
|
Best Stocks Today 12Stocks.com |
© 2024 12Stocks.com Terms & Conditions Privacy Contact Us
All Information Provided Only For Education And Not To Be Used For Investing or Trading. See Terms & Conditions


One More Thing ... Get Best Stocks Delivered Daily!
Never Ever Miss A Move With Our Top Ten Stocks Lists
Find Best Stocks In Any Market - Bull or Bear Market
Take A Peek At Our Top Ten Stocks Lists: Daily, Weekly, Year-to-Date & Top Trends
Find Best Stocks In Any Market - Bull or Bear Market
Take A Peek At Our Top Ten Stocks Lists: Daily, Weekly, Year-to-Date & Top Trends
Consumer Services Stocks With Best Up Trends [0-bearish to 100-bullish]: Genuine Parts[100], Envestnet [100], IMAX [100], Winmark [90], Lands [90], Coupang [90], Wendy s[87], Boot Barn[85], Cinemark [83], Yatsen Holding[83], Mastech Digital[81]
Best Consumer Services Stocks Year-to-Date:
U Power[2606.47%], Vroom [1734.91%], Yatsen Holding[374.3%], Fluent [261.19%], Codere Online[139.04%], Research[82.97%], DXP Enterprises[51.2%], CRA [43.7%], Williams-Sonoma [41.57%], Wingstop [40.39%], CAVA [40.2%] Best Consumer Services Stocks This Week:
TH [21.82%], Yatsen Holding[15.28%], Children s[11.86%], Envestnet [9.42%], Genuine Parts[9.13%], SunCar Technology[7.29%], Winmark [6.88%], Advance Auto[6.6%], United Homes[6.32%], AMC Entertainment[4.91%], Manpower [4.78%] Best Consumer Services Stocks Daily:
TH [28.85%], Faraday Future[10.60%], Genuine Parts[10.13%], Manpower [6.37%], Boqii Holding[5.61%], Children s[4.83%], Big Lots[4.37%], Reservoir Media[3.69%], Container Store[3.65%], Olaplex [3.09%], SunCar Technology[2.74%]