
 Login Sign Up


| |||||
 |  | ||||

| 12Stocks.com Market Intelligence |
Best Consumer Services Stocks
| In a hurry? Services & Goods Stocks: Performance Trends Table, Stock Charts
Sort Consumer Services: Daily, Weekly, Year-to-Date, Market Cap & Trends. Filter Services & Goods stocks list by size: All Large Mid-Range Small |
| 12Stocks.com Consumer Services Stocks Performances & Trends Daily | |||||||||
|
|  The overall Smart Investing & Trading Score is 0 (0-bearish to 100-bullish) which puts Consumer Services sector in short term bearish trend. The Smart Investing & Trading Score from previous trading session is 13 and hence a deterioration of trend.
| ||||||||
Here are the Smart Investing & Trading Scores of the most requested Consumer Services stocks at 12Stocks.com (click stock name for detailed review):
|


| Consider signing up for our daily 12Stocks.com "Best Stocks Newsletter". You will never ever miss a big stock move again! |
| 12Stocks.com: Investing in Consumer Services sector with Stocks | |
|
The following table helps investors and traders sort through current performance and trends (as measured by Smart Investing & Trading Score) of various
stocks in the Consumer Services sector. Quick View: Move mouse or cursor over stock symbol (ticker) to view short-term Technical chart and over stock name to view long term chart. Click on  to add stock symbol to your watchlist and to add stock symbol to your watchlist and  to view watchlist. Click on any ticker or stock name for detailed market intelligence report for that stock. to view watchlist. Click on any ticker or stock name for detailed market intelligence report for that stock. |
12Stocks.com Performance of Stocks in Consumer Services Sector
| Ticker | Stock Name | Watchlist | Category | Recent Price | Smart Investing & Trading Score | Change % | Weekly Change% |
| CAH | Cardinal Health |   | Pharmacy | 108.19 | 25 | 2.07% | 2.94% |
| NCLH | Norwegian Cruise | | Casinos | 18.29 | 51 | 0.66% | 2.93% |
| SEAT | Vivid Seats | | Internet Content & Information | 5.86 | 71 | -0.34% | 2.90% |
| UA | Under Armour | | Apparel | 6.47 | 42 | 1.73% | 2.86% |
| HCSG | Healthcare Services | | Services | 11.95 | 68 | 2.14% | 2.75% |
| LBRDK | Liberty Broadband | | Broadcasting | 49.89 | 42 | 2.11% | 2.70% |
| FCN | FTI Consulting | | Services | 211.25 | 93 | 1.74% | 2.65% |
| MANU | Manchester United | | Sporting | 15.10 | 64 | 1.48% | 2.65% |
| CRMT | America s | | Automobile | 58.15 | 32 | 3.54% | 2.63% |
| RVLV | Revolve | | Retail | 19.20 | 61 | 0.42% | 2.62% |
| GO | Grocery Outlet | | Grocery | 26.95 | 53 | 1.81% | 2.51% |
| AMBP | Ardagh Metal | | Packaging | 3.50 | 67 | 2.79% | 2.49% |
| KR | Kroger Co | | Grocery | 56.57 | 68 | 1.80% | 2.48% |
| ASGN | ASGN | | Staffing | 97.78 | 63 | 2.33% | 2.44% |
| CNK | Cinemark | | Entertainment | 18.22 | 69 | 0.55% | 2.42% |
| UCAR | U Power | | Auto & Truck Dealerships | 5.22 | 76 | -2.06% | 2.35% |
| RSVR | Reservoir Media | | Entertainment | 7.95 | 88 | 1.86% | 2.32% |
| NSP | Insperity | | Services | 108.35 | 52 | 1.45% | 2.29% |
| OLLI | Ollie s | | Retail | 73.14 | 58 | 1.18% | 2.27% |
| CMCSA | Comcast | | Entertainment | 40.26 | 32 | 1.62% | 2.26% |
| OMC | Omnicom | | Advertising | 92.62 | 61 | 1.22% | 2.24% |
| WBA | Walgreens Boots | | Drug Stores | 18.25 | 42 | 3.75% | 2.24% |
| FOX | Twenty-First Century | | Entertainment | 28.87 | 67 | 2.05% | 2.23% |
| PDCO | Patterson | | Medical | 26.02 | 42 | 2.16% | 2.20% |
| DLX | Deluxe | | Services | 19.71 | 63 | 4.01% | 2.12% |
| For chart view version of above stock list: Chart View ➞ 0 - 25 , 25 - 50 , 50 - 75 , 75 - 100 , 100 - 125 , 125 - 150 , 150 - 175 , 175 - 200 , 200 - 225 , 225 - 250 , 250 - 275 , 275 - 300 , 300 - 325 , 325 - 350 , 350 - 375 , 375 - 400 , 400 - 425 , 425 - 450 , 450 - 475 | ||
 | Click To Change The Sort Order: By Market Cap or Company Size Performance: Year-to-date, Week and Day |  |
|
Get the most comprehensive stock market coverage daily at 12Stocks.com ➞ Best Stocks Today ➞ Best Stocks Weekly ➞ Best Stocks Year-to-Date ➞ Best Stocks Trends ➞  Best Stocks Today 12Stocks.com Best Nasdaq Stocks ➞ Best S&P 500 Stocks ➞ Best Tech Stocks ➞ Best Biotech Stocks ➞ |
| Detailed Overview of Consumer Services Stocks |
| Consumer Services Technical Overview, Leaders & Laggards, Top Consumer Services ETF Funds & Detailed Consumer Services Stocks List, Charts, Trends & More |
| Consumer Services Sector: Technical Analysis, Trends & YTD Performance | |
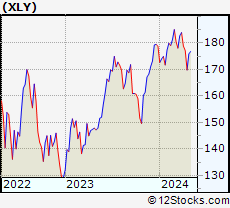
| Consumer Services sector is composed of stocks
from retail, entertainment, media/publishing, consumer goods
and services subsectors. Consumer Services sector, as represented by XLY, an exchange-traded fund [ETF] that holds basket of Consumer Services stocks (e.g, Walmart, Alibaba) is down by -5.06% and is currently underperforming the overall market by -8.44% year-to-date. Below is a quick view of Technical charts and trends: |
|
 XLY Weekly Chart |
|
| Long Term Trend: Not Good | |
| Medium Term Trend: Not Good | |
 XLY Daily Chart |
|
| Short Term Trend: Not Good | |
| Overall Trend Score: 0 | |
| YTD Performance: -5.06% | |
| **Trend Scores & Views Are Only For Educational Purposes And Not For Investing | |
| 12Stocks.com: Top Performing Consumer Services Sector Stocks | ||||||||||||||||||||||||||||||||||||||||||||||||
 The top performing Consumer Services sector stocks year to date are
Now, more recently, over last week, the top performing Consumer Services sector stocks on the move are


|
||||||||||||||||||||||||||||||||||||||||||||||||
| 12Stocks.com: Investing in Consumer Services Sector using Exchange Traded Funds | |
|
The following table shows list of key exchange traded funds (ETF) that
help investors track Consumer Services Index. For detailed view, check out our ETF Funds section of our website. Quick View: Move mouse or cursor over ETF symbol (ticker) to view short-term Technical chart and over ETF name to view long term chart. Click on ticker or stock name for detailed view. Click on to add stock symbol to your watchlist and to view watchlist. |
12Stocks.com List of ETFs that track Consumer Services Index
| Ticker | ETF Name | Watchlist | Recent Price | Smart Investing & Trading Score | Change % | Week % | Year-to-date % |
| XLY | Consumer Discret Sel | | 169.76 | 0 | -0.88 | -4.15 | -5.06% |
| RTH | Retail | | 198.08 | 44 | -0.28 | -1.79 | 5.23% |
| IYC | Consumer Services | | 76.27 | 36 | -1.03 | -3.69 | 0.66% |
| XRT | Retail | | 71.17 | 51 | 0.68 | -0.99 | -1.59% |
| IYK | Consumer Goods | | 65.81 | 60 | 1.29 | 2.57 | 2.98% |
| UCC | Consumer Services | | 31.53 | 33 | -3.40 | -8.42 | -12.19% |
| RETL | Retail Bull 3X | | 8.12 | 41 | 2.14 | -3.45 | -10.96% |
| RXI | Globl Consumer Discretionary | | 157.15 | 44 | -0.19 | -2.26 | -1.2% |
| SCC | Short Consumer Services | | 17.01 | 82 | 2.47 | 9.27 | 11% |
| UGE | Consumer Goods | | 16.53 | 73 | 1.66 | 2.11 | 5.01% |
| 12Stocks.com: Charts, Trends, Fundamental Data and Performances of Consumer Services Stocks | |
|
We now take in-depth look at all Consumer Services stocks including charts, multi-period performances and overall trends (as measured by Smart Investing & Trading Score). One can sort Consumer Services stocks (click link to choose) by Daily, Weekly and by Year-to-Date performances. Also, one can sort by size of the company or by market capitalization. |
| Select Your Default Chart Type: | |||||
| |||||
| Click on stock symbol or name for detailed view. Click on to add stock symbol to your watchlist and to view watchlist. Quick View: Move mouse or cursor over "Daily" to quickly view daily Technical stock chart and over "Weekly" to view weekly Technical stock chart. | |||||

 | CAH Cardinal Health, Inc. |
| Sector: Services & Goods | |
| SubSector: Drugs Wholesale | |
| MarketCap: 14509.9 Millions | |
| Recent Price: 108.19 Smart Investing & Trading Score: 25 | |
| Day Percent Change: 2.07% Day Change: 2.19 | |
| Week Change: 2.94% Year-to-date Change: 7.3% | |
| CAH Links: Profile News Message Board | |
| Charts:- Daily , Weekly | |
| Add CAH to Watchlist: View: Get Complete CAH Trend Analysis ➞ | |
 | NCLH Norwegian Cruise Line Holdings Ltd. |
| Sector: Services & Goods | |
| SubSector: Resorts & Casinos | |
| MarketCap: 2895.54 Millions | |
| Recent Price: 18.29 Smart Investing & Trading Score: 51 | |
| Day Percent Change: 0.66% Day Change: 0.12 | |
| Week Change: 2.93% Year-to-date Change: -8.7% | |
| NCLH Links: Profile News Message Board | |
| Charts:- Daily , Weekly | |
| Add NCLH to Watchlist: View: Get Complete NCLH Trend Analysis ➞ | |
 | SEAT Vivid Seats Inc. |
| Sector: Services & Goods | |
| SubSector: Internet Content & Information | |
| MarketCap: 1560 Millions | |
| Recent Price: 5.86 Smart Investing & Trading Score: 71 | |
| Day Percent Change: -0.34% Day Change: -0.02 | |
| Week Change: 2.9% Year-to-date Change: -6.2% | |
| SEAT Links: Profile News Message Board | |
| Charts:- Daily , Weekly | |
| Add SEAT to Watchlist: View: Get Complete SEAT Trend Analysis ➞ | |
 | UA Under Armour, Inc. |
| Sector: Services & Goods | |
| SubSector: Textile - Apparel Clothing | |
| MarketCap: 3926.93 Millions | |
| Recent Price: 6.47 Smart Investing & Trading Score: 42 | |
| Day Percent Change: 1.73% Day Change: 0.11 | |
| Week Change: 2.86% Year-to-date Change: -22.5% | |
| UA Links: Profile News Message Board | |
| Charts:- Daily , Weekly | |
| Add UA to Watchlist: View: Get Complete UA Trend Analysis ➞ | |
 | HCSG Healthcare Services Group, Inc. |
| Sector: Services & Goods | |
| SubSector: Business Services | |
| MarketCap: 1758.32 Millions | |
| Recent Price: 11.95 Smart Investing & Trading Score: 68 | |
| Day Percent Change: 2.14% Day Change: 0.25 | |
| Week Change: 2.75% Year-to-date Change: 15.2% | |
| HCSG Links: Profile News Message Board | |
| Charts:- Daily , Weekly | |
| Add HCSG to Watchlist: View: Get Complete HCSG Trend Analysis ➞ | |
 | LBRDK Liberty Broadband Corporation |
| Sector: Services & Goods | |
| SubSector: Broadcasting - TV | |
| MarketCap: 13847.3 Millions | |
| Recent Price: 49.89 Smart Investing & Trading Score: 42 | |
| Day Percent Change: 2.11% Day Change: 1.03 | |
| Week Change: 2.7% Year-to-date Change: -38.1% | |
| LBRDK Links: Profile News Message Board | |
| Charts:- Daily , Weekly | |
| Add LBRDK to Watchlist: View: Get Complete LBRDK Trend Analysis ➞ | |
 | FCN FTI Consulting, Inc. |
| Sector: Services & Goods | |
| SubSector: Management Services | |
| MarketCap: 4485.05 Millions | |
| Recent Price: 211.25 Smart Investing & Trading Score: 93 | |
| Day Percent Change: 1.74% Day Change: 3.61 | |
| Week Change: 2.65% Year-to-date Change: 6.1% | |
| FCN Links: Profile News Message Board | |
| Charts:- Daily , Weekly | |
| Add FCN to Watchlist: View: Get Complete FCN Trend Analysis ➞ | |
 | MANU Manchester United plc |
| Sector: Services & Goods | |
| SubSector: Sporting Activities | |
| MarketCap: 2537.74 Millions | |
| Recent Price: 15.10 Smart Investing & Trading Score: 64 | |
| Day Percent Change: 1.48% Day Change: 0.22 | |
| Week Change: 2.65% Year-to-date Change: -25.9% | |
| MANU Links: Profile News Message Board | |
| Charts:- Daily , Weekly | |
| Add MANU to Watchlist: View: Get Complete MANU Trend Analysis ➞ | |
 | CRMT America s Car-Mart, Inc. |
| Sector: Services & Goods | |
| SubSector: Auto Dealerships | |
| MarketCap: 329.921 Millions | |
| Recent Price: 58.15 Smart Investing & Trading Score: 32 | |
| Day Percent Change: 3.54% Day Change: 1.99 | |
| Week Change: 2.63% Year-to-date Change: -23.3% | |
| CRMT Links: Profile News Message Board | |
| Charts:- Daily , Weekly | |
| Add CRMT to Watchlist: View: Get Complete CRMT Trend Analysis ➞ | |
 | RVLV Revolve Group, Inc. |
| Sector: Services & Goods | |
| SubSector: Specialty Retail, Other | |
| MarketCap: 652.244 Millions | |
| Recent Price: 19.20 Smart Investing & Trading Score: 61 | |
| Day Percent Change: 0.42% Day Change: 0.08 | |
| Week Change: 2.62% Year-to-date Change: 15.8% | |
| RVLV Links: Profile News Message Board | |
| Charts:- Daily , Weekly | |
| Add RVLV to Watchlist: View: Get Complete RVLV Trend Analysis ➞ | |
 | GO Grocery Outlet Holding Corp. |
| Sector: Services & Goods | |
| SubSector: Grocery Stores | |
| MarketCap: 3065.95 Millions | |
| Recent Price: 26.95 Smart Investing & Trading Score: 53 | |
| Day Percent Change: 1.81% Day Change: 0.48 | |
| Week Change: 2.51% Year-to-date Change: 0.0% | |
| GO Links: Profile News Message Board | |
| Charts:- Daily , Weekly | |
| Add GO to Watchlist: View: Get Complete GO Trend Analysis ➞ | |
 | AMBP Ardagh Metal Packaging S.A. |
| Sector: Services & Goods | |
| SubSector: Packaging & Containers | |
| MarketCap: 2170 Millions | |
| Recent Price: 3.50 Smart Investing & Trading Score: 67 | |
| Day Percent Change: 2.79% Day Change: 0.10 | |
| Week Change: 2.49% Year-to-date Change: -8.6% | |
| AMBP Links: Profile News Message Board | |
| Charts:- Daily , Weekly | |
| Add AMBP to Watchlist: View: Get Complete AMBP Trend Analysis ➞ | |
 | KR The Kroger Co. |
| Sector: Services & Goods | |
| SubSector: Grocery Stores | |
| MarketCap: 26718.5 Millions | |
| Recent Price: 56.57 Smart Investing & Trading Score: 68 | |
| Day Percent Change: 1.80% Day Change: 1.00 | |
| Week Change: 2.48% Year-to-date Change: 23.8% | |
| KR Links: Profile News Message Board | |
| Charts:- Daily , Weekly | |
| Add KR to Watchlist: View: Get Complete KR Trend Analysis ➞ | |
 | ASGN ASGN Incorporated |
| Sector: Services & Goods | |
| SubSector: Staffing & Outsourcing Services | |
| MarketCap: 2035.88 Millions | |
| Recent Price: 97.78 Smart Investing & Trading Score: 63 | |
| Day Percent Change: 2.33% Day Change: 2.23 | |
| Week Change: 2.44% Year-to-date Change: 1.7% | |
| ASGN Links: Profile News Message Board | |
| Charts:- Daily , Weekly | |
| Add ASGN to Watchlist: View: Get Complete ASGN Trend Analysis ➞ | |
 | CNK Cinemark Holdings, Inc. |
| Sector: Services & Goods | |
| SubSector: Movie Production, Theaters | |
| MarketCap: 1776.29 Millions | |
| Recent Price: 18.22 Smart Investing & Trading Score: 69 | |
| Day Percent Change: 0.55% Day Change: 0.10 | |
| Week Change: 2.42% Year-to-date Change: 29.3% | |
| CNK Links: Profile News Message Board | |
| Charts:- Daily , Weekly | |
| Add CNK to Watchlist: View: Get Complete CNK Trend Analysis ➞ | |
 | UCAR U Power Limited |
| Sector: Services & Goods | |
| SubSector: Auto & Truck Dealerships | |
| MarketCap: 372 Millions | |
| Recent Price: 5.22 Smart Investing & Trading Score: 76 | |
| Day Percent Change: -2.06% Day Change: -0.11 | |
| Week Change: 2.35% Year-to-date Change: 2,813.0% | |
| UCAR Links: Profile News Message Board | |
| Charts:- Daily , Weekly | |
| Add UCAR to Watchlist: View: Get Complete UCAR Trend Analysis ➞ | |
 | RSVR Reservoir Media, Inc. |
| Sector: Services & Goods | |
| SubSector: Entertainment | |
| MarketCap: 389 Millions | |
| Recent Price: 7.95 Smart Investing & Trading Score: 88 | |
| Day Percent Change: 1.86% Day Change: 0.15 | |
| Week Change: 2.32% Year-to-date Change: 11.7% | |
| RSVR Links: Profile News Message Board | |
| Charts:- Daily , Weekly | |
| Add RSVR to Watchlist: View: Get Complete RSVR Trend Analysis ➞ | |
 | NSP Insperity, Inc. |
| Sector: Services & Goods | |
| SubSector: Business Services | |
| MarketCap: 1385.32 Millions | |
| Recent Price: 108.35 Smart Investing & Trading Score: 52 | |
| Day Percent Change: 1.45% Day Change: 1.55 | |
| Week Change: 2.29% Year-to-date Change: -7.6% | |
| NSP Links: Profile News Message Board | |
| Charts:- Daily , Weekly | |
| Add NSP to Watchlist: View: Get Complete NSP Trend Analysis ➞ | |
 | OLLI Ollie s Bargain Outlet Holdings, Inc. |
| Sector: Services & Goods | |
| SubSector: Discount, Variety Stores | |
| MarketCap: 2904.62 Millions | |
| Recent Price: 73.14 Smart Investing & Trading Score: 58 | |
| Day Percent Change: 1.18% Day Change: 0.85 | |
| Week Change: 2.27% Year-to-date Change: -3.6% | |
| OLLI Links: Profile News Message Board | |
| Charts:- Daily , Weekly | |
| Add OLLI to Watchlist: View: Get Complete OLLI Trend Analysis ➞ | |
 | CMCSA Comcast Corporation |
| Sector: Services & Goods | |
| SubSector: Entertainment - Diversified | |
| MarketCap: 164849 Millions | |
| Recent Price: 40.26 Smart Investing & Trading Score: 32 | |
| Day Percent Change: 1.62% Day Change: 0.64 | |
| Week Change: 2.26% Year-to-date Change: -8.2% | |
| CMCSA Links: Profile News Message Board | |
| Charts:- Daily , Weekly | |
| Add CMCSA to Watchlist: View: Get Complete CMCSA Trend Analysis ➞ | |
 | OMC Omnicom Group Inc. |
| Sector: Services & Goods | |
| SubSector: Advertising Agencies | |
| MarketCap: 11813.5 Millions | |
| Recent Price: 92.62 Smart Investing & Trading Score: 61 | |
| Day Percent Change: 1.22% Day Change: 1.12 | |
| Week Change: 2.24% Year-to-date Change: 7.1% | |
| OMC Links: Profile News Message Board | |
| Charts:- Daily , Weekly | |
| Add OMC to Watchlist: View: Get Complete OMC Trend Analysis ➞ | |
 | WBA Walgreens Boots Alliance, Inc. |
| Sector: Services & Goods | |
| SubSector: Drug Stores | |
| MarketCap: 46184.1 Millions | |
| Recent Price: 18.25 Smart Investing & Trading Score: 42 | |
| Day Percent Change: 3.75% Day Change: 0.66 | |
| Week Change: 2.24% Year-to-date Change: -30.1% | |
| WBA Links: Profile News Message Board | |
| Charts:- Daily , Weekly | |
| Add WBA to Watchlist: View: Get Complete WBA Trend Analysis ➞ | |
 | FOX Twenty-First Century Fox, Inc. |
| Sector: Services & Goods | |
| SubSector: Entertainment - Diversified | |
| MarketCap: 24211.2 Millions | |
| Recent Price: 28.87 Smart Investing & Trading Score: 67 | |
| Day Percent Change: 2.05% Day Change: 0.58 | |
| Week Change: 2.23% Year-to-date Change: 4.4% | |
| FOX Links: Profile News Message Board | |
| Charts:- Daily , Weekly | |
| Add FOX to Watchlist: View: Get Complete FOX Trend Analysis ➞ | |
 | PDCO Patterson Companies, Inc. |
| Sector: Services & Goods | |
| SubSector: Medical Equipment Wholesale | |
| MarketCap: 1672.2 Millions | |
| Recent Price: 26.02 Smart Investing & Trading Score: 42 | |
| Day Percent Change: 2.16% Day Change: 0.55 | |
| Week Change: 2.2% Year-to-date Change: -8.5% | |
| PDCO Links: Profile News Message Board | |
| Charts:- Daily , Weekly | |
| Add PDCO to Watchlist: View: Get Complete PDCO Trend Analysis ➞ | |
 | DLX Deluxe Corporation |
| Sector: Services & Goods | |
| SubSector: Business Services | |
| MarketCap: 1025.82 Millions | |
| Recent Price: 19.71 Smart Investing & Trading Score: 63 | |
| Day Percent Change: 4.01% Day Change: 0.76 | |
| Week Change: 2.12% Year-to-date Change: -8.1% | |
| DLX Links: Profile News Message Board | |
| Charts:- Daily , Weekly | |
| Add DLX to Watchlist: View: Get Complete DLX Trend Analysis ➞ | |
| For tabular summary view of above stock list: Summary View ➞ 0 - 25 , 25 - 50 , 50 - 75 , 75 - 100 , 100 - 125 , 125 - 150 , 150 - 175 , 175 - 200 , 200 - 225 , 225 - 250 , 250 - 275 , 275 - 300 , 300 - 325 , 325 - 350 , 350 - 375 , 375 - 400 , 400 - 425 , 425 - 450 , 450 - 475 | ||
| Click To Change The Sort Order: By Market Cap or Company Size Performance: Year-to-date, Week and Day | |
| Select Chart Type: | ||
|
Best Stocks Today 12Stocks.com |
© 2024 12Stocks.com Terms & Conditions Privacy Contact Us
All Information Provided Only For Education And Not To Be Used For Investing or Trading. See Terms & Conditions


One More Thing ... Get Best Stocks Delivered Daily!
Never Ever Miss A Move With Our Top Ten Stocks Lists
Find Best Stocks In Any Market - Bull or Bear Market
Take A Peek At Our Top Ten Stocks Lists: Daily, Weekly, Year-to-Date & Top Trends
Find Best Stocks In Any Market - Bull or Bear Market
Take A Peek At Our Top Ten Stocks Lists: Daily, Weekly, Year-to-Date & Top Trends
Consumer Services Stocks With Best Up Trends [0-bearish to 100-bullish]: Gannett Co[100], Gaia [100], Genuine Parts[100], ContextLogic [95], Biglari [95], Envestnet [93], MYT Netherlands[93], FTI Consulting[93], Bright Scholar[90], Winmark [90], Donnelley Financial[90]
Best Consumer Services Stocks Year-to-Date:
U Power[2812.95%], Vroom [1713.36%], Yatsen Holding[394.12%], Fluent [294.03%], Codere Online[138.01%], Research[93.83%], Sweetgreen [82.74%], Bright Scholar[60.8%], PaySign [55.71%], RealReal [54.73%], DXP Enterprises[49.67%] Best Consumer Services Stocks This Week:
Yatsen Holding[20.1%], ContextLogic [20%], AMC Entertainment[19.25%], Secoo Holding[17.14%], E.W. Scripps[12.19%], Genuine Parts[11.7%], Advance Auto[11.62%], Winmark [11.26%], Altisource Portfolio[11.15%], Envestnet [10.52%], TH [10%] Best Consumer Services Stocks Daily:
Lanvin [8.39%], AMC Entertainment[8.22%], Vision Marine[7.40%], Red Robin[7.00%], Urban One[6.92%], Bright Scholar[6.91%], Altisource Portfolio[6.82%], Cumulus Media[6.81%], Entravision [6.06%], Allego N.V[5.94%], Zumiez [5.85%]