
 Login Sign Up


| |||||
 |  | ||||

| 12Stocks.com Market Intelligence |
Best Consumer Services Stocks
| In a hurry? Services & Goods Stocks: Performance Trends Table, Stock Charts
Sort Consumer Services: Daily, Weekly, Year-to-Date, Market Cap & Trends. Filter Services & Goods stocks list by size: All Large Mid-Range Small |
| 12Stocks.com Consumer Services Stocks Performances & Trends Daily | |||||||||
|
|  The overall Smart Investing & Trading Score is 58 (0-bearish to 100-bullish) which puts Consumer Services sector in short term neutral trend. The Smart Investing & Trading Score from previous trading session is 23 and an improvement of trend continues.
| ||||||||
Here are the Smart Investing & Trading Scores of the most requested Consumer Services stocks at 12Stocks.com (click stock name for detailed review):
|


| Consider signing up for our daily 12Stocks.com "Best Stocks Newsletter". You will never ever miss a big stock move again! |
| 12Stocks.com: Investing in Consumer Services sector with Stocks | |
|
The following table helps investors and traders sort through current performance and trends (as measured by Smart Investing & Trading Score) of various
stocks in the Consumer Services sector. Quick View: Move mouse or cursor over stock symbol (ticker) to view short-term Technical chart and over stock name to view long term chart. Click on  to add stock symbol to your watchlist and to add stock symbol to your watchlist and  to view watchlist. Click on any ticker or stock name for detailed market intelligence report for that stock. to view watchlist. Click on any ticker or stock name for detailed market intelligence report for that stock. |
12Stocks.com Performance of Stocks in Consumer Services Sector
| Ticker | Stock Name | Watchlist | Category | Recent Price | Smart Investing & Trading Score | Change % | Weekly Change% |
| YUM | Yum! Brands |   | Restaurants | 140.57 | 93 | 0.34% | 1.49% |
| PAYS | PaySign | | Services | 4.42 | 88 | -1.01% | 1.49% |
| SIRI | Sirius XM | | Broadcasting | 3.13 | 42 | -0.79% | 1.46% |
| STRA | Strategic Education | | Education | 99.47 | 58 | 0.13% | 1.39% |
| GLBE | Global-e Online | | Internet Retail | 33.45 | 35 | -1.40% | 1.35% |
| CCO | Clear Channel | | Marketing | 1.51 | 27 | 0.67% | 1.34% |
| BAH | Booz Allen | | Services | 144.00 | 65 | -1.34% | 1.31% |
| VVI | Viad Corp | | Services | 35.17 | 63 | -1.40% | 1.30% |
| WISH | ContextLogic | | Internet Retail | 5.92 | 83 | -1.25% | 1.28% |
| EXPO | Exponent | | Services | 80.15 | 74 | -0.26% | 1.24% |
| FCN | FTI Consulting | | Services | 213.84 | 93 | 0.41% | 1.23% |
| LOPE | Grand Canyon | | Education | 128.72 | 32 | 0.01% | 1.23% |
| BYD | Boyd Gaming | | Casinos | 63.42 | 55 | -0.28% | 1.21% |
| MCO | Moody s | | Services | 379.19 | 42 | -0.78% | 1.21% |
| PFGC | Performance Food | | Restaurants | 69.27 | 25 | 0.00% | 1.15% |
| BBSI | Barrett Business | | Staffing | 123.75 | 78 | 0.23% | 1.14% |
| WEX | WEX | | Services | 233.08 | 68 | -0.40% | 1.13% |
| CZR | Caesars Entertainment | | Casinos | 38.63 | 25 | -1.25% | 1.13% |
| BJRI | BJ s | | Restaurants | 32.46 | 37 | -0.40% | 1.12% |
| NYT | New York | | Publishing | 43.06 | 57 | -0.37% | 1.08% |
| FOX | Twenty-First Century | | Entertainment | 29.18 | 74 | 0.00% | 1.07% |
| BURL | Burlington Stores | | Retail | 180.46 | 32 | -0.16% | 1.06% |
| MCK | McKesson | | Pharmacy | 530.36 | 65 | -0.31% | 1.05% |
| ICFI | ICF | | Services | 141.74 | 58 | -0.09% | 1.04% |
| GETY | Getty Images | | Internet Content & Information | 3.98 | 59 | 0.76% | 1.02% |
| For chart view version of above stock list: Chart View ➞ 0 - 25 , 25 - 50 , 50 - 75 , 75 - 100 , 100 - 125 , 125 - 150 , 150 - 175 , 175 - 200 , 200 - 225 , 225 - 250 , 250 - 275 , 275 - 300 , 300 - 325 , 325 - 350 , 350 - 375 , 375 - 400 , 400 - 425 | ||
 | Click To Change The Sort Order: By Market Cap or Company Size Performance: Year-to-date, Week and Day |  |
|
Get the most comprehensive stock market coverage daily at 12Stocks.com ➞ Best Stocks Today ➞ Best Stocks Weekly ➞ Best Stocks Year-to-Date ➞ Best Stocks Trends ➞  Best Stocks Today 12Stocks.com Best Nasdaq Stocks ➞ Best S&P 500 Stocks ➞ Best Tech Stocks ➞ Best Biotech Stocks ➞ |
| Detailed Overview of Consumer Services Stocks |
| Consumer Services Technical Overview, Leaders & Laggards, Top Consumer Services ETF Funds & Detailed Consumer Services Stocks List, Charts, Trends & More |
| Consumer Services Sector: Technical Analysis, Trends & YTD Performance | |
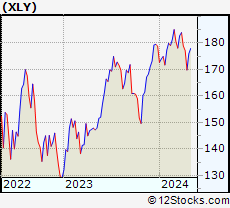
| Consumer Services sector is composed of stocks
from retail, entertainment, media/publishing, consumer goods
and services subsectors. Consumer Services sector, as represented by XLY, an exchange-traded fund [ETF] that holds basket of Consumer Services stocks (e.g, Walmart, Alibaba) is down by -2.61% and is currently underperforming the overall market by -7.95% year-to-date. Below is a quick view of Technical charts and trends: |
|
 XLY Weekly Chart |
|
| Long Term Trend: Good | |
| Medium Term Trend: Not Good | |
 XLY Daily Chart |
|
| Short Term Trend: Very Good | |
| Overall Trend Score: 58 | |
| YTD Performance: -2.61% | |
| **Trend Scores & Views Are Only For Educational Purposes And Not For Investing | |
| 12Stocks.com: Top Performing Consumer Services Sector Stocks | ||||||||||||||||||||||||||||||||||||||||||||||||
 The top performing Consumer Services sector stocks year to date are
Now, more recently, over last week, the top performing Consumer Services sector stocks on the move are


|
||||||||||||||||||||||||||||||||||||||||||||||||
| 12Stocks.com: Investing in Consumer Services Sector using Exchange Traded Funds | |
|
The following table shows list of key exchange traded funds (ETF) that
help investors track Consumer Services Index. For detailed view, check out our ETF Funds section of our website. Quick View: Move mouse or cursor over ETF symbol (ticker) to view short-term Technical chart and over ETF name to view long term chart. Click on ticker or stock name for detailed view. Click on to add stock symbol to your watchlist and to view watchlist. |
12Stocks.com List of ETFs that track Consumer Services Index
| Ticker | ETF Name | Watchlist | Recent Price | Smart Investing & Trading Score | Change % | Week % | Year-to-date % |
| XLY | Consumer Discret Sel | | 174.14 | 58 | 0.93 | 2.58 | -2.61% |
| RTH | Retail | | 200.56 | 58 | 0.03 | 0.97 | 6.55% |
| XRT | Retail | | 72.48 | 65 | -0.76 | 1.85 | 0.23% |
| UCC | Consumer Services | | 33.37 | 73 | 2.12 | 5.68 | -7.07% |
| SCC | Short Consumer Services | | 16.06 | 35 | -2.22 | -5.27 | 4.8% |
| UGE | Consumer Goods | | 17.02 | 73 | -0.09 | 2.33 | 8.09% |
| 12Stocks.com: Charts, Trends, Fundamental Data and Performances of Consumer Services Stocks | |
|
We now take in-depth look at all Consumer Services stocks including charts, multi-period performances and overall trends (as measured by Smart Investing & Trading Score). One can sort Consumer Services stocks (click link to choose) by Daily, Weekly and by Year-to-Date performances. Also, one can sort by size of the company or by market capitalization. |
| Select Your Default Chart Type: | |||||
| |||||
| Click on stock symbol or name for detailed view. Click on to add stock symbol to your watchlist and to view watchlist. Quick View: Move mouse or cursor over "Daily" to quickly view daily Technical stock chart and over "Weekly" to view weekly Technical stock chart. | |||||

 | YUM Yum! Brands, Inc. |
| Sector: Services & Goods | |
| SubSector: Restaurants | |
| MarketCap: 18033.3 Millions | |
| Recent Price: 140.57 Smart Investing & Trading Score: 93 | |
| Day Percent Change: 0.34% Day Change: 0.47 | |
| Week Change: 1.49% Year-to-date Change: 7.6% | |
| YUM Links: Profile News Message Board | |
| Charts:- Daily , Weekly | |
| Add YUM to Watchlist: View: Get Complete YUM Trend Analysis ➞ | |
 | PAYS PaySign, Inc. |
| Sector: Services & Goods | |
| SubSector: Business Services | |
| MarketCap: 213.882 Millions | |
| Recent Price: 4.42 Smart Investing & Trading Score: 88 | |
| Day Percent Change: -1.01% Day Change: -0.04 | |
| Week Change: 1.49% Year-to-date Change: 58.0% | |
| PAYS Links: Profile News Message Board | |
| Charts:- Daily , Weekly | |
| Add PAYS to Watchlist: View: Get Complete PAYS Trend Analysis ➞ | |
 | SIRI Sirius XM Holdings Inc. |
| Sector: Services & Goods | |
| SubSector: Broadcasting - Radio | |
| MarketCap: 21325.5 Millions | |
| Recent Price: 3.13 Smart Investing & Trading Score: 42 | |
| Day Percent Change: -0.79% Day Change: -0.03 | |
| Week Change: 1.46% Year-to-date Change: -42.7% | |
| SIRI Links: Profile News Message Board | |
| Charts:- Daily , Weekly | |
| Add SIRI to Watchlist: View: Get Complete SIRI Trend Analysis ➞ | |
 | STRA Strategic Education, Inc. |
| Sector: Services & Goods | |
| SubSector: Education & Training Services | |
| MarketCap: 2621.56 Millions | |
| Recent Price: 99.47 Smart Investing & Trading Score: 58 | |
| Day Percent Change: 0.13% Day Change: 0.13 | |
| Week Change: 1.39% Year-to-date Change: 7.7% | |
| STRA Links: Profile News Message Board | |
| Charts:- Daily , Weekly | |
| Add STRA to Watchlist: View: Get Complete STRA Trend Analysis ➞ | |
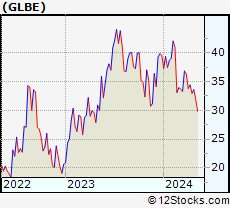 | GLBE Global-e Online Ltd. |
| Sector: Services & Goods | |
| SubSector: Internet Retail | |
| MarketCap: 6610 Millions | |
| Recent Price: 33.45 Smart Investing & Trading Score: 35 | |
| Day Percent Change: -1.40% Day Change: -0.48 | |
| Week Change: 1.35% Year-to-date Change: -15.5% | |
| GLBE Links: Profile News Message Board | |
| Charts:- Daily , Weekly | |
| Add GLBE to Watchlist: View: Get Complete GLBE Trend Analysis ➞ | |
 | CCO Clear Channel Outdoor Holdings, Inc. |
| Sector: Services & Goods | |
| SubSector: Marketing Services | |
| MarketCap: 312.715 Millions | |
| Recent Price: 1.51 Smart Investing & Trading Score: 27 | |
| Day Percent Change: 0.67% Day Change: 0.01 | |
| Week Change: 1.34% Year-to-date Change: -17.0% | |
| CCO Links: Profile News Message Board | |
| Charts:- Daily , Weekly | |
| Add CCO to Watchlist: View: Get Complete CCO Trend Analysis ➞ | |
 | BAH Booz Allen Hamilton Holding Corporation |
| Sector: Services & Goods | |
| SubSector: Management Services | |
| MarketCap: 9037.35 Millions | |
| Recent Price: 144.00 Smart Investing & Trading Score: 65 | |
| Day Percent Change: -1.34% Day Change: -1.96 | |
| Week Change: 1.31% Year-to-date Change: 12.6% | |
| BAH Links: Profile News Message Board | |
| Charts:- Daily , Weekly | |
| Add BAH to Watchlist: View: Get Complete BAH Trend Analysis ➞ | |
 | VVI Viad Corp |
| Sector: Services & Goods | |
| SubSector: Business Services | |
| MarketCap: 270.682 Millions | |
| Recent Price: 35.17 Smart Investing & Trading Score: 63 | |
| Day Percent Change: -1.40% Day Change: -0.50 | |
| Week Change: 1.3% Year-to-date Change: -2.9% | |
| VVI Links: Profile News Message Board | |
| Charts:- Daily , Weekly | |
| Add VVI to Watchlist: View: Get Complete VVI Trend Analysis ➞ | |
 | WISH ContextLogic Inc. |
| Sector: Services & Goods | |
| SubSector: Internet Retail | |
| MarketCap: 165 Millions | |
| Recent Price: 5.92 Smart Investing & Trading Score: 83 | |
| Day Percent Change: -1.25% Day Change: -0.08 | |
| Week Change: 1.28% Year-to-date Change: -0.5% | |
| WISH Links: Profile News Message Board | |
| Charts:- Daily , Weekly | |
| Add WISH to Watchlist: View: Get Complete WISH Trend Analysis ➞ | |
 | EXPO Exponent, Inc. |
| Sector: Services & Goods | |
| SubSector: Management Services | |
| MarketCap: 3605.95 Millions | |
| Recent Price: 80.15 Smart Investing & Trading Score: 74 | |
| Day Percent Change: -0.26% Day Change: -0.21 | |
| Week Change: 1.24% Year-to-date Change: -9.0% | |
| EXPO Links: Profile News Message Board | |
| Charts:- Daily , Weekly | |
| Add EXPO to Watchlist: View: Get Complete EXPO Trend Analysis ➞ | |
 | FCN FTI Consulting, Inc. |
| Sector: Services & Goods | |
| SubSector: Management Services | |
| MarketCap: 4485.05 Millions | |
| Recent Price: 213.84 Smart Investing & Trading Score: 93 | |
| Day Percent Change: 0.41% Day Change: 0.87 | |
| Week Change: 1.23% Year-to-date Change: 7.4% | |
| FCN Links: Profile News Message Board | |
| Charts:- Daily , Weekly | |
| Add FCN to Watchlist: View: Get Complete FCN Trend Analysis ➞ | |
 | LOPE Grand Canyon Education, Inc. |
| Sector: Services & Goods | |
| SubSector: Education & Training Services | |
| MarketCap: 3073.56 Millions | |
| Recent Price: 128.72 Smart Investing & Trading Score: 32 | |
| Day Percent Change: 0.01% Day Change: 0.02 | |
| Week Change: 1.23% Year-to-date Change: -2.5% | |
| LOPE Links: Profile News Message Board | |
| Charts:- Daily , Weekly | |
| Add LOPE to Watchlist: View: Get Complete LOPE Trend Analysis ➞ | |
 | BYD Boyd Gaming Corporation |
| Sector: Services & Goods | |
| SubSector: Resorts & Casinos | |
| MarketCap: 1652.54 Millions | |
| Recent Price: 63.42 Smart Investing & Trading Score: 55 | |
| Day Percent Change: -0.28% Day Change: -0.18 | |
| Week Change: 1.21% Year-to-date Change: 1.3% | |
| BYD Links: Profile News Message Board | |
| Charts:- Daily , Weekly | |
| Add BYD to Watchlist: View: Get Complete BYD Trend Analysis ➞ | |
 | MCO Moody s Corporation |
| Sector: Services & Goods | |
| SubSector: Business Services | |
| MarketCap: 35998.5 Millions | |
| Recent Price: 379.19 Smart Investing & Trading Score: 42 | |
| Day Percent Change: -0.78% Day Change: -2.98 | |
| Week Change: 1.21% Year-to-date Change: -2.9% | |
| MCO Links: Profile News Message Board | |
| Charts:- Daily , Weekly | |
| Add MCO to Watchlist: View: Get Complete MCO Trend Analysis ➞ | |
 | PFGC Performance Food Group Company |
| Sector: Services & Goods | |
| SubSector: Restaurants | |
| MarketCap: 2457.5 Millions | |
| Recent Price: 69.27 Smart Investing & Trading Score: 25 | |
| Day Percent Change: 0.00% Day Change: 0.00 | |
| Week Change: 1.15% Year-to-date Change: 0.2% | |
| PFGC Links: Profile News Message Board | |
| Charts:- Daily , Weekly | |
| Add PFGC to Watchlist: View: Get Complete PFGC Trend Analysis ➞ | |
 | BBSI Barrett Business Services, Inc. |
| Sector: Services & Goods | |
| SubSector: Staffing & Outsourcing Services | |
| MarketCap: 262.028 Millions | |
| Recent Price: 123.75 Smart Investing & Trading Score: 78 | |
| Day Percent Change: 0.23% Day Change: 0.28 | |
| Week Change: 1.14% Year-to-date Change: 6.9% | |
| BBSI Links: Profile News Message Board | |
| Charts:- Daily , Weekly | |
| Add BBSI to Watchlist: View: Get Complete BBSI Trend Analysis ➞ | |
 | WEX WEX Inc. |
| Sector: Services & Goods | |
| SubSector: Business Services | |
| MarketCap: 4312.22 Millions | |
| Recent Price: 233.08 Smart Investing & Trading Score: 68 | |
| Day Percent Change: -0.40% Day Change: -0.94 | |
| Week Change: 1.13% Year-to-date Change: 19.8% | |
| WEX Links: Profile News Message Board | |
| Charts:- Daily , Weekly | |
| Add WEX to Watchlist: View: Get Complete WEX Trend Analysis ➞ | |
 | CZR Caesars Entertainment Corporation |
| Sector: Services & Goods | |
| SubSector: Resorts & Casinos | |
| MarketCap: 4618.44 Millions | |
| Recent Price: 38.63 Smart Investing & Trading Score: 25 | |
| Day Percent Change: -1.25% Day Change: -0.49 | |
| Week Change: 1.13% Year-to-date Change: -17.6% | |
| CZR Links: Profile News Message Board | |
| Charts:- Daily , Weekly | |
| Add CZR to Watchlist: View: Get Complete CZR Trend Analysis ➞ | |
 | BJRI BJ s Restaurants, Inc. |
| Sector: Services & Goods | |
| SubSector: Restaurants | |
| MarketCap: 183.67 Millions | |
| Recent Price: 32.46 Smart Investing & Trading Score: 37 | |
| Day Percent Change: -0.40% Day Change: -0.13 | |
| Week Change: 1.12% Year-to-date Change: -9.9% | |
| BJRI Links: Profile News Message Board | |
| Charts:- Daily , Weekly | |
| Add BJRI to Watchlist: View: Get Complete BJRI Trend Analysis ➞ | |
 | NYT The New York Times Company |
| Sector: Services & Goods | |
| SubSector: Publishing - Newspapers | |
| MarketCap: 5188.22 Millions | |
| Recent Price: 43.06 Smart Investing & Trading Score: 57 | |
| Day Percent Change: -0.37% Day Change: -0.16 | |
| Week Change: 1.08% Year-to-date Change: -12.1% | |
| NYT Links: Profile News Message Board | |
| Charts:- Daily , Weekly | |
| Add NYT to Watchlist: View: Get Complete NYT Trend Analysis ➞ | |
 | FOX Twenty-First Century Fox, Inc. |
| Sector: Services & Goods | |
| SubSector: Entertainment - Diversified | |
| MarketCap: 24211.2 Millions | |
| Recent Price: 29.18 Smart Investing & Trading Score: 74 | |
| Day Percent Change: 0.00% Day Change: 0.00 | |
| Week Change: 1.07% Year-to-date Change: 5.5% | |
| FOX Links: Profile News Message Board | |
| Charts:- Daily , Weekly | |
| Add FOX to Watchlist: View: Get Complete FOX Trend Analysis ➞ | |
 | BURL Burlington Stores, Inc. |
| Sector: Services & Goods | |
| SubSector: Discount, Variety Stores | |
| MarketCap: 9801.42 Millions | |
| Recent Price: 180.46 Smart Investing & Trading Score: 32 | |
| Day Percent Change: -0.16% Day Change: -0.29 | |
| Week Change: 1.06% Year-to-date Change: -7.2% | |
| BURL Links: Profile News Message Board | |
| Charts:- Daily , Weekly | |
| Add BURL to Watchlist: View: Get Complete BURL Trend Analysis ➞ | |
 | MCK McKesson Corporation |
| Sector: Services & Goods | |
| SubSector: Drugs Wholesale | |
| MarketCap: 24096.7 Millions | |
| Recent Price: 530.36 Smart Investing & Trading Score: 65 | |
| Day Percent Change: -0.31% Day Change: -1.64 | |
| Week Change: 1.05% Year-to-date Change: 14.6% | |
| MCK Links: Profile News Message Board | |
| Charts:- Daily , Weekly | |
| Add MCK to Watchlist: View: Get Complete MCK Trend Analysis ➞ | |
 | ICFI ICF International, Inc. |
| Sector: Services & Goods | |
| SubSector: Management Services | |
| MarketCap: 1218.75 Millions | |
| Recent Price: 141.74 Smart Investing & Trading Score: 58 | |
| Day Percent Change: -0.09% Day Change: -0.13 | |
| Week Change: 1.04% Year-to-date Change: 5.7% | |
| ICFI Links: Profile News Message Board | |
| Charts:- Daily , Weekly | |
| Add ICFI to Watchlist: View: Get Complete ICFI Trend Analysis ➞ | |
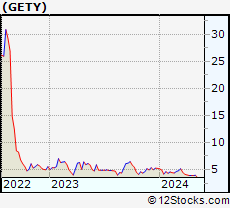 | GETY Getty Images Holdings, Inc. |
| Sector: Services & Goods | |
| SubSector: Internet Content & Information | |
| MarketCap: 1940 Millions | |
| Recent Price: 3.98 Smart Investing & Trading Score: 59 | |
| Day Percent Change: 0.76% Day Change: 0.03 | |
| Week Change: 1.02% Year-to-date Change: -24.1% | |
| GETY Links: Profile News Message Board | |
| Charts:- Daily , Weekly | |
| Add GETY to Watchlist: View: Get Complete GETY Trend Analysis ➞ | |
| For tabular summary view of above stock list: Summary View ➞ 0 - 25 , 25 - 50 , 50 - 75 , 75 - 100 , 100 - 125 , 125 - 150 , 150 - 175 , 175 - 200 , 200 - 225 , 225 - 250 , 250 - 275 , 275 - 300 , 300 - 325 , 325 - 350 , 350 - 375 , 375 - 400 , 400 - 425 | ||
| Click To Change The Sort Order: By Market Cap or Company Size Performance: Year-to-date, Week and Day | |
| Select Chart Type: | ||
|
Best Stocks Today 12Stocks.com |
© 2024 12Stocks.com Terms & Conditions Privacy Contact Us
All Information Provided Only For Education And Not To Be Used For Investing or Trading. See Terms & Conditions


One More Thing ... Get Best Stocks Delivered Daily!
Never Ever Miss A Move With Our Top Ten Stocks Lists
Find Best Stocks In Any Market - Bull or Bear Market
Take A Peek At Our Top Ten Stocks Lists: Daily, Weekly, Year-to-Date & Top Trends
Find Best Stocks In Any Market - Bull or Bear Market
Take A Peek At Our Top Ten Stocks Lists: Daily, Weekly, Year-to-Date & Top Trends
Consumer Services Stocks With Best Up Trends [0-bearish to 100-bullish]: Yatsen Holding[100], 1[100], Alibaba [100], MINISO [100], IMAX [100], Omnicom [100], Carriage Services[100], Texas Roadhouse[100], MYT Netherlands[100], Napco Security[100], Reservoir Media[100]
Best Consumer Services Stocks Year-to-Date:
U Power[2785.04%], Vroom [1864.2%], Yatsen Holding[473.4%], Fluent [288.06%], Codere Online[137.67%], Research[105.46%], PaySign [58.04%], DXP Enterprises[52.26%], Gaia [50.37%], CRA [49.63%], DoubleDown Interactive[41.63%] Best Consumer Services Stocks This Week:
Chicken Soup[124.57%], Hibbett Sports[21.01%], Yatsen Holding[16.04%], Jumia Technologies[15.36%], Ameresco [13.7%], MYT Netherlands[12.79%], Baozun [12.72%], 1[11.49%], K12 [11.41%], Zumiez [11.34%], Allbirds [10.46%] Best Consumer Services Stocks Daily:
Chicken Soup[113.88%], K12 [8.21%], Yatsen Holding[6.74%], Allego N.V[6.31%], Watsco [5.94%], 1[5.92%], Starbox [5.73%], Gaia [5.45%], Hilton Worldwide[5.33%], Olaplex [4.38%], Dada Nexus[4.03%]