
 Login Sign Up


| |||||
 |  | ||||

| 12Stocks.com Market Intelligence |
Best Industrial Stocks
| In a hurry? Industrial Stocks Lists: Performance Trends Table, Stock Charts
Sort Industrial stocks: Daily, Weekly, Year-to-Date, Market Cap & Trends. Filter Industrial stocks list by size:All Industrial Large Mid-Range Small |
| 12Stocks.com Industrial Stocks Performances & Trends Daily | |||||||||
|
|  The overall Smart Investing & Trading Score is 20 (0-bearish to 100-bullish) which puts Industrial sector in short term bearish trend. The Smart Investing & Trading Score from previous trading session is 60 and hence a deterioration of trend.
| ||||||||
Here are the Smart Investing & Trading Scores of the most requested Industrial stocks at 12Stocks.com (click stock name for detailed review):
|


| 12Stocks.com: Investing in Industrial sector with Stocks | |
|
The following table helps investors and traders sort through current performance and trends (as measured by Smart Investing & Trading Score) of various
stocks in the Industrial sector. Quick View: Move mouse or cursor over stock symbol (ticker) to view short-term Technical chart and over stock name to view long term chart. Click on  to add stock symbol to your watchlist and to add stock symbol to your watchlist and  to view watchlist. Click on any ticker or stock name for detailed market intelligence report for that stock. to view watchlist. Click on any ticker or stock name for detailed market intelligence report for that stock. |
12Stocks.com Performance of Stocks in Industrial Sector
| Ticker | Stock Name | Watchlist | Category | Recent Price | Smart Investing & Trading Score | Change % | YTD Change% |
| GE | GE Aerospace |   | Aerospace & Defense | 289.50 | 70 | -1.18% | 72.29% |
| CAT | Caterpillar | | Farm & Heavy Construction Machinery | 450.66 | 100 | 2.27% | 26.81% |
| BA | Boeing Co | | Aerospace & Defense | 214.63 | 20 | -0.18% | 24.88% |
| HON | Honeywell | | Conglomerates | 211.68 | 20 | 0.35% | -5.15% |
| ETN | Eaton | | Specialty Industrial Machinery | 363.35 | 40 | -2.11% | 10.56% |
| UNP | Union Pacific | | Railroads | 217.17 | 40 | 0.54% | -4.12% |
| DE | Deere & Co | | Farm & Heavy Construction Machinery | 469.12 | 10 | 0.09% | 12.93% |
| LMT | Lockheed Martin | | Aerospace & Defense | 473.12 | 90 | -0.25% | -0.49% |
| PH | Parker-Hannifin Corp | | Specialty Industrial Machinery | 738.50 | 20 | -2.06% | 17.92% |
| TT | Trane Technologies | | Building Products & Equipment | 397.88 | 0 | -0.53% | 9.99% |
| WM | Waste Management | | Waste Mgmt | 215.66 | 10 | 0.83% | 8.31% |
| GD | General Dynamics | | Aerospace & Defense | 325.28 | 50 | -0.34% | 26.63% |
| RELX | RELX | | Specialty | 47.09 | 60 | 0.86% | 5.51% |
| NOC | Northrop Grumman | | Aerospace & Defense | 577.08 | 70 | -0.39% | 24.45% |
| MMM | 3M Co | | Conglomerates | 155.16 | 30 | -0.86% | 20.81% |
| CTAS | Cintas | | Specialty | 199.98 | 30 | 0.35% | 10.23% |
| TRI | Thomson-Reuters Corp | | Specialty | 169.21 | 0 | -0.29% | 5.60% |
| ITW | Illinois Tool | | Specialty Industrial Machinery | 262.48 | 50 | 0.24% | 6.26% |
| UTX | United Technologies | | Aerospace/Defense | 9.25 | 10 | 0.00% | 0.00% |
| EMR | Emerson Electric | | Specialty Industrial Machinery | 131.00 | 0 | 1.53% | 8.15% |
| UPS | United Parcel | | Integrated Freight & Logistics | 84.18 | 30 | -1.20% | -29.93% |
| RSG | Republic Services | | Waste Mgmt | 226.27 | 0 | 0.42% | 13.62% |
| TDG | Transdigm | | Aerospace & Defense | 1275.96 | 30 | -0.45% | 1.74% |
| CP | Canadian Pacific | | Railroads | 75.29 | 50 | -1.05% | 2.59% |
| JCI | Johnson Controls | | Building Products & Equipment | 107.41 | 50 | 0.42% | 37.16% |
| For chart view version of above stock list: Chart View ➞ 0 - 25 , 25 - 50 , 50 - 75 , 75 - 100 , 100 - 125 , 125 - 150 , 150 - 175 , 175 - 200 , 200 - 225 , 225 - 250 , 250 - 275 , 275 - 300 , 300 - 325 , 325 - 350 , 350 - 375 , 375 - 400 , 400 - 425 , 425 - 450 , 450 - 475 , 475 - 500 , 500 - 525 | ||
 | Click To Change The Sort Order: By Market Cap or Company Size Performance: Year-to-date, Week and Day |  |
|
Get the most comprehensive stock market coverage daily at 12Stocks.com ➞ Best Stocks Today ➞ Best Stocks Weekly ➞ Best Stocks Year-to-Date ➞ Best Stocks Trends ➞  Best Stocks Today 12Stocks.com Best Nasdaq Stocks ➞ Best S&P 500 Stocks ➞ Best Tech Stocks ➞ Best Biotech Stocks ➞ |
| Detailed Overview of Industrial Stocks |
| Industrial Technical Overview, Leaders & Laggards, Top Industrial ETF Funds & Detailed Industrial Stocks List, Charts, Trends & More |
| Industrial Sector: Technical Analysis, Trends & YTD Performance | |
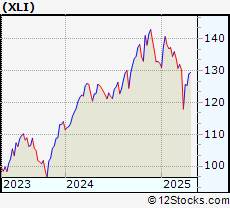
| Industrial sector is composed of stocks
from industrial machinery, aerospace, defense, farm/construction
and industrial services subsectors. Industrial sector, as represented by XLI, an exchange-traded fund [ETF] that holds basket of Industrial stocks (e.g, Caterpillar, Boeing) is up by 15.8152% and is currently outperforming the overall market by 2.6684% year-to-date. Below is a quick view of Technical charts and trends: |
|
 XLI Weekly Chart |
|
| Long Term Trend: Good | |
| Medium Term Trend: Not Good | |
 XLI Daily Chart |
|
| Short Term Trend: Not Good | |
| Overall Trend Score: 20 | |
| YTD Performance: 15.8152% | |
| **Trend Scores & Views Are Only For Educational Purposes And Not For Investing | |
| 12Stocks.com: Top Performing Industrial Sector Stocks | ||||||||||||||||||||||||||||||||||||||||||||||||
 The top performing Industrial sector stocks year to date are
Now, more recently, over last week, the top performing Industrial sector stocks on the move are


|
||||||||||||||||||||||||||||||||||||||||||||||||
| 12Stocks.com: Investing in Industrial Sector using Exchange Traded Funds | |
|
The following table shows list of key exchange traded funds (ETF) that
help investors track Industrial Index. For detailed view, check out our ETF Funds section of our website. Quick View: Move mouse or cursor over ETF symbol (ticker) to view short-term Technical chart and over ETF name to view long term chart. Click on ticker or stock name for detailed view. Click on to add stock symbol to your watchlist and to view watchlist. |
12Stocks.com List of ETFs that track Industrial Index
| Ticker | ETF Name | Watchlist | Recent Price | Smart Investing & Trading Score | Change % | Week % | Year-to-date % |
| CHII | China Industrials | | 9.80 | 20 | 0 | -0.0509944 | 0% |
| 12Stocks.com: Charts, Trends, Fundamental Data and Performances of Industrial Stocks | |
|
We now take in-depth look at all Industrial stocks including charts, multi-period performances and overall trends (as measured by Smart Investing & Trading Score). One can sort Industrial stocks (click link to choose) by Daily, Weekly and by Year-to-Date performances. Also, one can sort by size of the company or by market capitalization. |
| Select Your Default Chart Type: | |||||
| |||||
| Click on stock symbol or name for detailed view. Click on to add stock symbol to your watchlist and to view watchlist. Quick View: Move mouse or cursor over "Daily" to quickly view daily Technical stock chart and over "Weekly" to view weekly Technical stock chart. | |||||

 | GE GE Aerospace |
| Sector: Industrials | |
| SubSector: Aerospace & Defense | |
| MarketCap: 296106 Millions | |
| Recent Price: 289.50 Smart Investing & Trading Score: 70 | |
| Day Percent Change: -1.18442% Day Change: -5.2 | |
| Week Change: 4.80017% Year-to-date Change: 72.3% | |
| GE Links: Profile News Message Board | |
| Charts:- Daily , Weekly | |
| Add GE to Watchlist: View: Get Complete GE Trend Analysis ➞ | |
 | CAT Caterpillar Inc |
| Sector: Industrials | |
| SubSector: Farm & Heavy Construction Machinery | |
| MarketCap: 198204 Millions | |
| Recent Price: 450.66 Smart Investing & Trading Score: 100 | |
| Day Percent Change: 2.267% Day Change: 6.12 | |
| Week Change: 7.79019% Year-to-date Change: 26.8% | |
| CAT Links: Profile News Message Board | |
| Charts:- Daily , Weekly | |
| Add CAT to Watchlist: View: Get Complete CAT Trend Analysis ➞ | |
 | BA Boeing Co |
| Sector: Industrials | |
| SubSector: Aerospace & Defense | |
| MarketCap: 173621 Millions | |
| Recent Price: 214.63 Smart Investing & Trading Score: 20 | |
| Day Percent Change: -0.181378% Day Change: -0.95 | |
| Week Change: -6.48745% Year-to-date Change: 24.9% | |
| BA Links: Profile News Message Board | |
| Charts:- Daily , Weekly | |
| Add BA to Watchlist: View: Get Complete BA Trend Analysis ➞ | |
 | HON Honeywell International Inc |
| Sector: Industrials | |
| SubSector: Conglomerates | |
| MarketCap: 136027 Millions | |
| Recent Price: 211.68 Smart Investing & Trading Score: 20 | |
| Day Percent Change: 0.346054% Day Change: 0.07 | |
| Week Change: -1.17647% Year-to-date Change: -5.2% | |
| HON Links: Profile News Message Board | |
| Charts:- Daily , Weekly | |
| Add HON to Watchlist: View: Get Complete HON Trend Analysis ➞ | |
 | ETN Eaton Corporation plc |
| Sector: Industrials | |
| SubSector: Specialty Industrial Machinery | |
| MarketCap: 135877 Millions | |
| Recent Price: 363.35 Smart Investing & Trading Score: 40 | |
| Day Percent Change: -2.11213% Day Change: -9.01 | |
| Week Change: 4.34196% Year-to-date Change: 10.6% | |
| ETN Links: Profile News Message Board | |
| Charts:- Daily , Weekly | |
| Add ETN to Watchlist: View: Get Complete ETN Trend Analysis ➞ | |
 | UNP Union Pacific Corp |
| Sector: Industrials | |
| SubSector: Railroads | |
| MarketCap: 130653 Millions | |
| Recent Price: 217.17 Smart Investing & Trading Score: 40 | |
| Day Percent Change: 0.541667% Day Change: 1.03 | |
| Week Change: 0.518399% Year-to-date Change: -4.1% | |
| UNP Links: Profile News Message Board | |
| Charts:- Daily , Weekly | |
| Add UNP to Watchlist: View: Get Complete UNP Trend Analysis ➞ | |
 | DE Deere & Co |
| Sector: Industrials | |
| SubSector: Farm & Heavy Construction Machinery | |
| MarketCap: 127936 Millions | |
| Recent Price: 469.12 Smart Investing & Trading Score: 10 | |
| Day Percent Change: 0.0896096% Day Change: -1.84 | |
| Week Change: -1.36249% Year-to-date Change: 12.9% | |
| DE Links: Profile News Message Board | |
| Charts:- Daily , Weekly | |
| Add DE to Watchlist: View: Get Complete DE Trend Analysis ➞ | |
 | LMT Lockheed Martin Corp |
| Sector: Industrials | |
| SubSector: Aerospace & Defense | |
| MarketCap: 108304 Millions | |
| Recent Price: 473.12 Smart Investing & Trading Score: 90 | |
| Day Percent Change: -0.252994% Day Change: -0.84 | |
| Week Change: 3.51376% Year-to-date Change: -0.5% | |
| LMT Links: Profile News Message Board | |
| Charts:- Daily , Weekly | |
| Add LMT to Watchlist: View: Get Complete LMT Trend Analysis ➞ | |
 | PH Parker-Hannifin Corp |
| Sector: Industrials | |
| SubSector: Specialty Industrial Machinery | |
| MarketCap: 96096 Millions | |
| Recent Price: 738.50 Smart Investing & Trading Score: 20 | |
| Day Percent Change: -2.0622% Day Change: -15.59 | |
| Week Change: -2.21651% Year-to-date Change: 17.9% | |
| PH Links: Profile News Message Board | |
| Charts:- Daily , Weekly | |
| Add PH to Watchlist: View: Get Complete PH Trend Analysis ➞ | |
 | TT Trane Technologies plc |
| Sector: Industrials | |
| SubSector: Building Products & Equipment | |
| MarketCap: 92083.5 Millions | |
| Recent Price: 397.88 Smart Investing & Trading Score: 0 | |
| Day Percent Change: -0.53% Day Change: -2.11 | |
| Week Change: -0.72% Year-to-date Change: 10.0% | |
| TT Links: Profile News Message Board | |
| Charts:- Daily , Weekly | |
| Add TT to Watchlist: View: Get Complete TT Trend Analysis ➞ | |
 | WM Waste Management, Inc |
| Sector: Industrials | |
| SubSector: Waste Management | |
| MarketCap: 88646.8 Millions | |
| Recent Price: 215.66 Smart Investing & Trading Score: 10 | |
| Day Percent Change: 0.832242% Day Change: 2.02 | |
| Week Change: -1.59701% Year-to-date Change: 8.3% | |
| WM Links: Profile News Message Board | |
| Charts:- Daily , Weekly | |
| Add WM to Watchlist: View: Get Complete WM Trend Analysis ➞ | |
 | GD General Dynamics Corp |
| Sector: Industrials | |
| SubSector: Aerospace & Defense | |
| MarketCap: 86847.2 Millions | |
| Recent Price: 325.28 Smart Investing & Trading Score: 50 | |
| Day Percent Change: -0.343137% Day Change: -0.7 | |
| Week Change: 1.22927% Year-to-date Change: 26.6% | |
| GD Links: Profile News Message Board | |
| Charts:- Daily , Weekly | |
| Add GD to Watchlist: View: Get Complete GD Trend Analysis ➞ | |
 | RELX RELX Plc ADR |
| Sector: Industrials | |
| SubSector: Specialty Business Services | |
| MarketCap: 85982.9 Millions | |
| Recent Price: 47.09 Smart Investing & Trading Score: 60 | |
| Day Percent Change: 0.856714% Day Change: -0.5 | |
| Week Change: -0.211909% Year-to-date Change: 5.5% | |
| RELX Links: Profile News Message Board | |
| Charts:- Daily , Weekly | |
| Add RELX to Watchlist: View: Get Complete RELX Trend Analysis ➞ | |
 | NOC Northrop Grumman Corp |
| Sector: Industrials | |
| SubSector: Aerospace & Defense | |
| MarketCap: 83160.7 Millions | |
| Recent Price: 577.08 Smart Investing & Trading Score: 70 | |
| Day Percent Change: -0.393538% Day Change: 0.38 | |
| Week Change: 0.953414% Year-to-date Change: 24.5% | |
| NOC Links: Profile News Message Board | |
| Charts:- Daily , Weekly | |
| Add NOC to Watchlist: View: Get Complete NOC Trend Analysis ➞ | |
 | MMM 3M Co |
| Sector: Industrials | |
| SubSector: Conglomerates | |
| MarketCap: 82717.4 Millions | |
| Recent Price: 155.16 Smart Investing & Trading Score: 30 | |
| Day Percent Change: -0.85623% Day Change: -2.15 | |
| Week Change: 1.35877% Year-to-date Change: 20.8% | |
| MMM Links: Profile News Message Board | |
| Charts:- Daily , Weekly | |
| Add MMM to Watchlist: View: Get Complete MMM Trend Analysis ➞ | |
 | CTAS Cintas Corporation |
| Sector: Industrials | |
| SubSector: Specialty Business Services | |
| MarketCap: 82409 Millions | |
| Recent Price: 199.98 Smart Investing & Trading Score: 30 | |
| Day Percent Change: 0.346229% Day Change: 1.11 | |
| Week Change: -1.0343% Year-to-date Change: 10.2% | |
| CTAS Links: Profile News Message Board | |
| Charts:- Daily , Weekly | |
| Add CTAS to Watchlist: View: Get Complete CTAS Trend Analysis ➞ | |
 | TRI Thomson-Reuters Corp |
| Sector: Industrials | |
| SubSector: Specialty Business Services | |
| MarketCap: 78671.8 Millions | |
| Recent Price: 169.21 Smart Investing & Trading Score: 0 | |
| Day Percent Change: -0.29462% Day Change: 0.32 | |
| Week Change: -3.66638% Year-to-date Change: 5.6% | |
| TRI Links: Profile News Message Board | |
| Charts:- Daily , Weekly | |
| Add TRI to Watchlist: View: Get Complete TRI Trend Analysis ➞ | |
 | ITW Illinois Tool Works, Inc |
| Sector: Industrials | |
| SubSector: Specialty Industrial Machinery | |
| MarketCap: 77609 Millions | |
| Recent Price: 262.48 Smart Investing & Trading Score: 50 | |
| Day Percent Change: 0.244424% Day Change: 1.33 | |
| Week Change: 0.114425% Year-to-date Change: 6.3% | |
| ITW Links: Profile News Message Board | |
| Charts:- Daily , Weekly | |
| Add ITW to Watchlist: View: Get Complete ITW Trend Analysis ➞ | |
 | UTX United Technologies Corporation |
| Sector: Industrials | |
| SubSector: Aerospace/Defense Products & Services | |
| MarketCap: 74904.2 Millions | |
| Recent Price: 9.25 Smart Investing & Trading Score: 10 | |
| Day Percent Change: 0% Day Change: -9999 | |
| Week Change: -82.8163% Year-to-date Change: 0.0% | |
| UTX Links: Profile News Message Board | |
| Charts:- Daily , Weekly | |
| Add UTX to Watchlist: View: Get Complete UTX Trend Analysis ➞ | |
 | EMR Emerson Electric Co |
| Sector: Industrials | |
| SubSector: Specialty Industrial Machinery | |
| MarketCap: 74599.1 Millions | |
| Recent Price: 131.00 Smart Investing & Trading Score: 0 | |
| Day Percent Change: 1.52678% Day Change: 2.23 | |
| Week Change: -0.795153% Year-to-date Change: 8.1% | |
| EMR Links: Profile News Message Board | |
| Charts:- Daily , Weekly | |
| Add EMR to Watchlist: View: Get Complete EMR Trend Analysis ➞ | |
 | UPS United Parcel Service, Inc |
| Sector: Industrials | |
| SubSector: Integrated Freight & Logistics | |
| MarketCap: 72077.3 Millions | |
| Recent Price: 84.18 Smart Investing & Trading Score: 30 | |
| Day Percent Change: -1.19718% Day Change: -1.06 | |
| Week Change: -0.260664% Year-to-date Change: -29.9% | |
| UPS Links: Profile News Message Board | |
| Charts:- Daily , Weekly | |
| Add UPS to Watchlist: View: Get Complete UPS Trend Analysis ➞ | |
 | RSG Republic Services, Inc |
| Sector: Industrials | |
| SubSector: Waste Management | |
| MarketCap: 71725.3 Millions | |
| Recent Price: 226.27 Smart Investing & Trading Score: 0 | |
| Day Percent Change: 0.417166% Day Change: 1.23 | |
| Week Change: -1.22233% Year-to-date Change: 13.6% | |
| RSG Links: Profile News Message Board | |
| Charts:- Daily , Weekly | |
| Add RSG to Watchlist: View: Get Complete RSG Trend Analysis ➞ | |
 | TDG Transdigm Group Incorporated |
| Sector: Industrials | |
| SubSector: Aerospace & Defense | |
| MarketCap: 71623.5 Millions | |
| Recent Price: 1275.96 Smart Investing & Trading Score: 30 | |
| Day Percent Change: -0.450173% Day Change: -6.01 | |
| Week Change: -2.75362% Year-to-date Change: 1.7% | |
| TDG Links: Profile News Message Board | |
| Charts:- Daily , Weekly | |
| Add TDG to Watchlist: View: Get Complete TDG Trend Analysis ➞ | |
 | CP Canadian Pacific Kansas City Limited |
| Sector: Industrials | |
| SubSector: Railroads | |
| MarketCap: 70344.8 Millions | |
| Recent Price: 75.29 Smart Investing & Trading Score: 50 | |
| Day Percent Change: -1.05139% Day Change: -1.06 | |
| Week Change: 0.749364% Year-to-date Change: 2.6% | |
| CP Links: Profile News Message Board | |
| Charts:- Daily , Weekly | |
| Add CP to Watchlist: View: Get Complete CP Trend Analysis ➞ | |
 | JCI Johnson Controls International plc |
| Sector: Industrials | |
| SubSector: Building Products & Equipment | |
| MarketCap: 69515.4 Millions | |
| Recent Price: 107.41 Smart Investing & Trading Score: 50 | |
| Day Percent Change: 0.420718% Day Change: 0.36 | |
| Week Change: 1.05372% Year-to-date Change: 37.2% | |
| JCI Links: Profile News Message Board | |
| Charts:- Daily , Weekly | |
| Add JCI to Watchlist: View: Get Complete JCI Trend Analysis ➞ | |
| For tabular summary view of above stock list: Summary View ➞ 0 - 25 , 25 - 50 , 50 - 75 , 75 - 100 , 100 - 125 , 125 - 150 , 150 - 175 , 175 - 200 , 200 - 225 , 225 - 250 , 250 - 275 , 275 - 300 , 300 - 325 , 325 - 350 , 350 - 375 , 375 - 400 , 400 - 425 , 425 - 450 , 450 - 475 , 475 - 500 , 500 - 525 | ||
| Click To Change The Sort Order: By Market Cap or Company Size Performance: Year-to-date, Week and Day | |
| Select Chart Type: | ||
|
Best Stocks Today 12Stocks.com |
© 2025 12Stocks.com Terms & Conditions Privacy Contact Us
All Information Provided Only For Education And Not To Be Used For Investing or Trading. See Terms & Conditions


One More Thing ... Get Best Stocks Delivered Daily!
Never Ever Miss A Move With Our Top Ten Stocks Lists
Find Best Stocks In Any Market - Bull or Bear Market
Take A Peek At Our Top Ten Stocks Lists: Daily, Weekly, Year-to-Date & Top Trends
Find Best Stocks In Any Market - Bull or Bear Market
Take A Peek At Our Top Ten Stocks Lists: Daily, Weekly, Year-to-Date & Top Trends
Industrial Stocks With Best Up Trends [0-bearish to 100-bullish]: Brooge [100], Plug Power[100], Ballard Power[100], GrafTech [100], Bloom Energy[100], American Superconductor[100], PICO [100], Seanergy Maritime[100], Acco Brands[100], Controladora Vuela[100], Tetra Technologies[100]
Best Industrial Stocks Year-to-Date:
Triumph [1281.83%], GrafTech [600.581%], Tecogen [486.452%], Power [247.28%], Bloom Energy[240.907%], Lightbridge Corp[189.608%], Kratos Defense[187.111%], Willdan [170.86%], ESGL [170.593%], Tutor Perini[163.328%], Planet Labs[157.683%] Best Industrial Stocks This Week:
TRC [10149.1%], Advanced Emissions[3571.78%], L3 Technologies[1915.25%], Forterra [1845.47%], KLX [437.488%], Allegro Merger[402.182%], LMI Aerospace[291.621%], Chicago Bridge[205.472%], Covanta Holding[148.617%], MOOG [148.377%], Altra [103.372%] Best Industrial Stocks Daily:
Brooge [29.5547%], Plug Power[19.0476%], Ballard Power[14.5455%], GrafTech [11.9888%], Tecogen [10.989%], B/E Aerospace[8.86381%], Bloom Energy[8.70514%], American Superconductor[7.043%], Ads-Tec Energy[5.48272%], Planet Labs[4.92308%], William Lyon[4.78516%]