
 Login Sign Up


| |||||
 |  | ||||

| 12Stocks.com Market Intelligence |
Best Industrial Stocks
| In a hurry? Industrial Stocks Lists: Performance Trends Table, Stock Charts
Sort Industrial stocks: Daily, Weekly, Year-to-Date, Market Cap & Trends. Filter Industrial stocks list by size:All Industrial Large Mid-Range Small |
| 12Stocks.com Industrial Stocks Performances & Trends Daily | |||||||||
|
|  The overall Smart Investing & Trading Score is 95 (0-bearish to 100-bullish) which puts Industrial sector in short term bullish trend. The Smart Investing & Trading Score from previous trading session is 83 and an improvement of trend continues.
| ||||||||
Here are the Smart Investing & Trading Scores of the most requested Industrial stocks at 12Stocks.com (click stock name for detailed review):
|


| 12Stocks.com: Investing in Industrial sector with Stocks | |
|
The following table helps investors and traders sort through current performance and trends (as measured by Smart Investing & Trading Score) of various
stocks in the Industrial sector. Quick View: Move mouse or cursor over stock symbol (ticker) to view short-term Technical chart and over stock name to view long term chart. Click on  to add stock symbol to your watchlist and to add stock symbol to your watchlist and  to view watchlist. Click on any ticker or stock name for detailed market intelligence report for that stock. to view watchlist. Click on any ticker or stock name for detailed market intelligence report for that stock. |
12Stocks.com Performance of Stocks in Industrial Sector
| Ticker | Stock Name | Watchlist | Category | Recent Price | Smart Investing & Trading Score | Change % | YTD Change% |
| REX | REX American |   | Conglomerates | 52.76 | 100 | 2.63% | 26.55% |
| MTW | Manitowoc | | Machinery | 12.88 | 100 | 0.94% | 41.07% |
| FIP | FTAI Infrastructure | | Industrials | 6.58 | 81 | 2.81% | -8.80% |
| BOOM | DMC Global | | Fabrication | 8.43 | 100 | -0.35% | 14.69% |
| TGI | Triumph | | Aerospace/Defense | 25.82 | 51 | 0.35% | 38.37% |
| FCEL | FuelCell Energy | | Electrical Equipment | 5.50 | 36 | 3.38% | -39.16% |
| WTTR | Select Energy | | Pollution & Treatment Controls | 9.11 | 85 | 0.77% | -30.82% |
| CSTE | Caesarstone | | Building Materials | 1.93 | 50 | 0.00% | -54.59% |
| NX | Quanex Building | | Building Materials | 20.51 | 100 | -2.29% | -15.04% |
| LEGH | Legacy Housing | | Residential | 23.97 | 74 | 0.25% | -2.88% |
| ATRO | Astronics | | Aerospace/Defense | 32.63 | 36 | 0.31% | 104.45% |
| SKYH | Sky Harbour | | Aerospace & Defense | 9.95 | 64 | 0.91% | -16.60% |
| BBCP | Concrete Pumping | | Building Materials | 6.43 | 100 | 1.58% | 8.97% |
| DCO | Ducommun | | Aerospace/Defense | 84.91 | 63 | 2.49% | 33.38% |
| POWL | Powell Industries | | Machinery | 217.66 | 100 | -0.40% | -1.67% |
| STRL | Sterling Construction | | Heavy Construction | 236.67 | 56 | 3.48% | 40.50% |
| PLPC | Preformed Line | | Electrical Equipment | 169.29 | 100 | 1.32% | 32.87% |
| TH | Target Hospitality | | Conglomerates | 7.35 | 74 | 2.08% | -23.95% |
| RYI | Ryerson Holding | | Fabrication | 23.51 | 87 | 1.29% | 27.99% |
| RYI | Ryerson Holding | | Fabrication | 9.45 | 87 | 1.29% | 27.99% |
| BZH | Beazer Homes | | Residential | 23.58 | 100 | -1.34% | -14.13% |
| HSHP | Himalaya Shipping | | Marine Shipping | 6.16 | 61 | 3.18% | 28.20% |
| RDW | Redwire | | Aerospace & Defense | 15.99 | 36 | 2.50% | -2.86% |
| ASPN | Aspen Aerogels | | Building Materials | 6.46 | 100 | 1.89% | -45.62% |
| GENC | Gencor Industries | | Machinery | 15.11 | 73 | 3.00% | -14.39% |
| For chart view version of above stock list: Chart View ➞ 0 - 25 , 25 - 50 , 50 - 75 , 75 - 100 , 100 - 125 , 125 - 150 , 150 - 175 , 175 - 200 , 200 - 225 , 225 - 250 | ||
 | Click To Change The Sort Order: By Market Cap or Company Size Performance: Year-to-date, Week and Day |  |
|
Get the most comprehensive stock market coverage daily at 12Stocks.com ➞ Best Stocks Today ➞ Best Stocks Weekly ➞ Best Stocks Year-to-Date ➞ Best Stocks Trends ➞  Best Stocks Today 12Stocks.com Best Nasdaq Stocks ➞ Best S&P 500 Stocks ➞ Best Tech Stocks ➞ Best Biotech Stocks ➞ |
| Detailed Overview of Industrial Stocks |
| Industrial Technical Overview, Leaders & Laggards, Top Industrial ETF Funds & Detailed Industrial Stocks List, Charts, Trends & More |
| Industrial Sector: Technical Analysis, Trends & YTD Performance | |
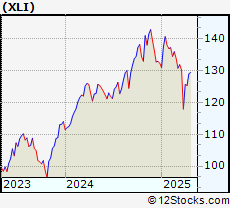
| Industrial sector is composed of stocks
from industrial machinery, aerospace, defense, farm/construction
and industrial services subsectors. Industrial sector, as represented by XLI, an exchange-traded fund [ETF] that holds basket of Industrial stocks (e.g, Caterpillar, Boeing) is up by 13.75% and is currently outperforming the overall market by 7.09% year-to-date. Below is a quick view of Technical charts and trends: |
|
 XLI Weekly Chart |
|
| Long Term Trend: Very Good | |
| Medium Term Trend: Very Good | |
 XLI Daily Chart |
|
| Short Term Trend: Very Good | |
| Overall Trend Score: 95 | |
| YTD Performance: 13.75% | |
| **Trend Scores & Views Are Only For Educational Purposes And Not For Investing | |
| 12Stocks.com: Top Performing Industrial Sector Stocks | ||||||||||||||||||||||||||||||||||||||||||||||||
 The top performing Industrial sector stocks year to date are
Now, more recently, over last week, the top performing Industrial sector stocks on the move are


|
||||||||||||||||||||||||||||||||||||||||||||||||
| 12Stocks.com: Investing in Industrial Sector using Exchange Traded Funds | |
|
The following table shows list of key exchange traded funds (ETF) that
help investors track Industrial Index. For detailed view, check out our ETF Funds section of our website. Quick View: Move mouse or cursor over ETF symbol (ticker) to view short-term Technical chart and over ETF name to view long term chart. Click on ticker or stock name for detailed view. Click on to add stock symbol to your watchlist and to view watchlist. |
12Stocks.com List of ETFs that track Industrial Index
| Ticker | ETF Name | Watchlist | Recent Price | Smart Investing & Trading Score | Change % | Week % | Year-to-date % |
| XLI | Industrial | | 149.42 | 95 | 0.85 | 1.79 | 13.75% |
| UXI | Industrials | | 44.11 | 93 | 1.81 | 3.4 | 21.65% |
| PPA | Aerospace & Defense | | 141.76 | 66 | 1.09 | 0.85 | 23.61% |
| ITA | Aerospace & Defense | | 186.86 | 58 | 1.15 | -0.37 | 28.77% |
| ITB | Home Construction | | 96.36 | 100 | -1.74 | 3.39 | -6.16% |
| XHB | Homebuilders | | 102.60 | 100 | -1.08 | 4.2 | -1.5% |
| SIJ | Short Industrials | | 12.36 | 41 | -1.48 | -3.15 | 48.2% |
| 12Stocks.com: Charts, Trends, Fundamental Data and Performances of Industrial Stocks | |
|
We now take in-depth look at all Industrial stocks including charts, multi-period performances and overall trends (as measured by Smart Investing & Trading Score). One can sort Industrial stocks (click link to choose) by Daily, Weekly and by Year-to-Date performances. Also, one can sort by size of the company or by market capitalization. |
| Select Your Default Chart Type: | |||||
| |||||
| Click on stock symbol or name for detailed view. Click on to add stock symbol to your watchlist and to view watchlist. Quick View: Move mouse or cursor over "Daily" to quickly view daily Technical stock chart and over "Weekly" to view weekly Technical stock chart. | |||||

 | REX REX American Resources Corporation |
| Sector: Industrials | |
| SubSector: Conglomerates | |
| MarketCap: 373.748 Millions | |
| Recent Price: 52.76 Smart Investing & Trading Score: 100 | |
| Day Percent Change: 2.63% Day Change: 1.35 | |
| Week Change: 7% Year-to-date Change: 26.6% | |
| REX Links: Profile News Message Board | |
| Charts:- Daily , Weekly | |
| Add REX to Watchlist: View: Get Complete REX Trend Analysis ➞ | |
 | MTW The Manitowoc Company, Inc. |
| Sector: Industrials | |
| SubSector: Farm & Construction Machinery | |
| MarketCap: 373.707 Millions | |
| Recent Price: 12.88 Smart Investing & Trading Score: 100 | |
| Day Percent Change: 0.94% Day Change: 0.12 | |
| Week Change: 4.89% Year-to-date Change: 41.1% | |
| MTW Links: Profile News Message Board | |
| Charts:- Daily , Weekly | |
| Add MTW to Watchlist: View: Get Complete MTW Trend Analysis ➞ | |
 | FIP FTAI Infrastructure Inc. |
| Sector: Industrials | |
| SubSector: Industrials | |
| MarketCap: 368 Millions | |
| Recent Price: 6.58 Smart Investing & Trading Score: 81 | |
| Day Percent Change: 2.81% Day Change: 0.18 | |
| Week Change: 4.78% Year-to-date Change: -8.8% | |
| FIP Links: Profile News Message Board | |
| Charts:- Daily , Weekly | |
| Add FIP to Watchlist: View: Get Complete FIP Trend Analysis ➞ | |
 | BOOM DMC Global Inc. |
| Sector: Industrials | |
| SubSector: Metal Fabrication | |
| MarketCap: 359.15 Millions | |
| Recent Price: 8.43 Smart Investing & Trading Score: 100 | |
| Day Percent Change: -0.35% Day Change: -0.03 | |
| Week Change: 3.31% Year-to-date Change: 14.7% | |
| BOOM Links: Profile News Message Board | |
| Charts:- Daily , Weekly | |
| Add BOOM to Watchlist: View: Get Complete BOOM Trend Analysis ➞ | |
 | TGI Triumph Group, Inc. |
| Sector: Industrials | |
| SubSector: Aerospace/Defense Products & Services | |
| MarketCap: 358.901 Millions | |
| Recent Price: 25.82 Smart Investing & Trading Score: 51 | |
| Day Percent Change: 0.35% Day Change: 0.09 | |
| Week Change: 0.12% Year-to-date Change: 38.4% | |
| TGI Links: Profile News Message Board | |
| Charts:- Daily , Weekly | |
| Add TGI to Watchlist: View: Get Complete TGI Trend Analysis ➞ | |
 | FCEL FuelCell Energy, Inc. |
| Sector: Industrials | |
| SubSector: Industrial Electrical Equipment | |
| MarketCap: 347.079 Millions | |
| Recent Price: 5.50 Smart Investing & Trading Score: 36 | |
| Day Percent Change: 3.38% Day Change: 0.18 | |
| Week Change: -0.18% Year-to-date Change: -39.2% | |
| FCEL Links: Profile News Message Board | |
| Charts:- Daily , Weekly | |
| Add FCEL to Watchlist: View: Get Complete FCEL Trend Analysis ➞ | |
 | WTTR Select Energy Services, Inc. |
| Sector: Industrials | |
| SubSector: Pollution & Treatment Controls | |
| MarketCap: 347.075 Millions | |
| Recent Price: 9.11 Smart Investing & Trading Score: 85 | |
| Day Percent Change: 0.77% Day Change: 0.07 | |
| Week Change: 3.88% Year-to-date Change: -30.8% | |
| WTTR Links: Profile News Message Board | |
| Charts:- Daily , Weekly | |
| Add WTTR to Watchlist: View: Get Complete WTTR Trend Analysis ➞ | |
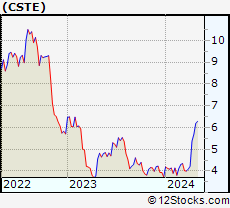 | CSTE Caesarstone Ltd. |
| Sector: Industrials | |
| SubSector: General Building Materials | |
| MarketCap: 338.653 Millions | |
| Recent Price: 1.93 Smart Investing & Trading Score: 50 | |
| Day Percent Change: 0% Day Change: 0 | |
| Week Change: 3.76% Year-to-date Change: -54.6% | |
| CSTE Links: Profile News Message Board | |
| Charts:- Daily , Weekly | |
| Add CSTE to Watchlist: View: Get Complete CSTE Trend Analysis ➞ | |
 | NX Quanex Building Products Corporation |
| Sector: Industrials | |
| SubSector: General Building Materials | |
| MarketCap: 315.453 Millions | |
| Recent Price: 20.51 Smart Investing & Trading Score: 100 | |
| Day Percent Change: -2.29% Day Change: -0.48 | |
| Week Change: 6.43% Year-to-date Change: -15.0% | |
| NX Links: Profile News Message Board | |
| Charts:- Daily , Weekly | |
| Add NX to Watchlist: View: Get Complete NX Trend Analysis ➞ | |
 | LEGH Legacy Housing Corporation |
| Sector: Industrials | |
| SubSector: Residential Construction | |
| MarketCap: 298.006 Millions | |
| Recent Price: 23.97 Smart Investing & Trading Score: 74 | |
| Day Percent Change: 0.25% Day Change: 0.06 | |
| Week Change: 6.63% Year-to-date Change: -2.9% | |
| LEGH Links: Profile News Message Board | |
| Charts:- Daily , Weekly | |
| Add LEGH to Watchlist: View: Get Complete LEGH Trend Analysis ➞ | |
 | ATRO Astronics Corporation |
| Sector: Industrials | |
| SubSector: Aerospace/Defense Products & Services | |
| MarketCap: 287.201 Millions | |
| Recent Price: 32.63 Smart Investing & Trading Score: 36 | |
| Day Percent Change: 0.31% Day Change: 0.1 | |
| Week Change: -2.42% Year-to-date Change: 104.5% | |
| ATRO Links: Profile News Message Board | |
| Charts:- Daily , Weekly | |
| Add ATRO to Watchlist: View: Get Complete ATRO Trend Analysis ➞ | |
 | SKYH Sky Harbour Group Corporation |
| Sector: Industrials | |
| SubSector: Aerospace & Defense | |
| MarketCap: 271 Millions | |
| Recent Price: 9.95 Smart Investing & Trading Score: 64 | |
| Day Percent Change: 0.91% Day Change: 0.09 | |
| Week Change: 2.47% Year-to-date Change: -16.6% | |
| SKYH Links: Profile News Message Board | |
| Charts:- Daily , Weekly | |
| Add SKYH to Watchlist: View: Get Complete SKYH Trend Analysis ➞ | |
 | BBCP Concrete Pumping Holdings, Inc. |
| Sector: Industrials | |
| SubSector: General Building Materials | |
| MarketCap: 263.653 Millions | |
| Recent Price: 6.43 Smart Investing & Trading Score: 100 | |
| Day Percent Change: 1.58% Day Change: 0.1 | |
| Week Change: 3.21% Year-to-date Change: 9.0% | |
| BBCP Links: Profile News Message Board | |
| Charts:- Daily , Weekly | |
| Add BBCP to Watchlist: View: Get Complete BBCP Trend Analysis ➞ | |
 | DCO Ducommun Incorporated |
| Sector: Industrials | |
| SubSector: Aerospace/Defense Products & Services | |
| MarketCap: 261.101 Millions | |
| Recent Price: 84.91 Smart Investing & Trading Score: 63 | |
| Day Percent Change: 2.49% Day Change: 2.06 | |
| Week Change: -1.58% Year-to-date Change: 33.4% | |
| DCO Links: Profile News Message Board | |
| Charts:- Daily , Weekly | |
| Add DCO to Watchlist: View: Get Complete DCO Trend Analysis ➞ | |
 | POWL Powell Industries, Inc. |
| Sector: Industrials | |
| SubSector: Diversified Machinery | |
| MarketCap: 257.216 Millions | |
| Recent Price: 217.66 Smart Investing & Trading Score: 100 | |
| Day Percent Change: -0.4% Day Change: -0.87 | |
| Week Change: 2.23% Year-to-date Change: -1.7% | |
| POWL Links: Profile News Message Board | |
| Charts:- Daily , Weekly | |
| Add POWL to Watchlist: View: Get Complete POWL Trend Analysis ➞ | |
 | STRL Sterling Construction Company, Inc. |
| Sector: Industrials | |
| SubSector: Heavy Construction | |
| MarketCap: 237.395 Millions | |
| Recent Price: 236.67 Smart Investing & Trading Score: 56 | |
| Day Percent Change: 3.48% Day Change: 7.95 | |
| Week Change: 2.23% Year-to-date Change: 40.5% | |
| STRL Links: Profile News Message Board | |
| Charts:- Daily , Weekly | |
| Add STRL to Watchlist: View: Get Complete STRL Trend Analysis ➞ | |
 | PLPC Preformed Line Products Company |
| Sector: Industrials | |
| SubSector: Industrial Electrical Equipment | |
| MarketCap: 221.779 Millions | |
| Recent Price: 169.29 Smart Investing & Trading Score: 100 | |
| Day Percent Change: 1.32% Day Change: 2.21 | |
| Week Change: 6.47% Year-to-date Change: 32.9% | |
| PLPC Links: Profile News Message Board | |
| Charts:- Daily , Weekly | |
| Add PLPC to Watchlist: View: Get Complete PLPC Trend Analysis ➞ | |
 | TH Target Hospitality Corp. |
| Sector: Industrials | |
| SubSector: Conglomerates | |
| MarketCap: 218.048 Millions | |
| Recent Price: 7.35 Smart Investing & Trading Score: 74 | |
| Day Percent Change: 2.08% Day Change: 0.15 | |
| Week Change: 2.51% Year-to-date Change: -24.0% | |
| TH Links: Profile News Message Board | |
| Charts:- Daily , Weekly | |
| Add TH to Watchlist: View: Get Complete TH Trend Analysis ➞ | |
 | RYI Ryerson Holding Corporation |
| Sector: Industrials | |
| SubSector: Metal Fabrication | |
| MarketCap: 202.55 Millions | |
| Recent Price: 23.51 Smart Investing & Trading Score: 87 | |
| Day Percent Change: 1.29% Day Change: 0.3 | |
| Week Change: 6.38% Year-to-date Change: 28.0% | |
| RYI Links: Profile News Message Board | |
| Charts:- Daily , Weekly | |
| Add RYI to Watchlist: View: Get Complete RYI Trend Analysis ➞ | |
| RYI Ryerson Holding Corporation |
| Sector: Industrials | |
| SubSector: Metal Fabrication | |
| MarketCap: 202.55 Millions | |
| Recent Price: 9.45 Smart Investing & Trading Score: 87 | |
| Day Percent Change: 1.29% Day Change: 0.3 | |
| Week Change: 6.38% Year-to-date Change: 28.0% | |
| RYI Links: Profile News Message Board | |
| Charts:- Daily , Weekly | |
| Add RYI to Watchlist: View: Get Complete RYI Trend Analysis ➞ | |
 | BZH Beazer Homes USA, Inc. |
| Sector: Industrials | |
| SubSector: Residential Construction | |
| MarketCap: 180.106 Millions | |
| Recent Price: 23.58 Smart Investing & Trading Score: 100 | |
| Day Percent Change: -1.34% Day Change: -0.32 | |
| Week Change: 4.34% Year-to-date Change: -14.1% | |
| BZH Links: Profile News Message Board | |
| Charts:- Daily , Weekly | |
| Add BZH to Watchlist: View: Get Complete BZH Trend Analysis ➞ | |
 | HSHP Himalaya Shipping Ltd. |
| Sector: Industrials | |
| SubSector: Marine Shipping | |
| MarketCap: 179 Millions | |
| Recent Price: 6.16 Smart Investing & Trading Score: 61 | |
| Day Percent Change: 3.18% Day Change: 0.19 | |
| Week Change: 2.84% Year-to-date Change: 28.2% | |
| HSHP Links: Profile News Message Board | |
| Charts:- Daily , Weekly | |
| Add HSHP to Watchlist: View: Get Complete HSHP Trend Analysis ➞ | |
 | RDW Redwire Corporation |
| Sector: Industrials | |
| SubSector: Aerospace & Defense | |
| MarketCap: 160 Millions | |
| Recent Price: 15.99 Smart Investing & Trading Score: 36 | |
| Day Percent Change: 2.5% Day Change: 0.39 | |
| Week Change: -0.81% Year-to-date Change: -2.9% | |
| RDW Links: Profile News Message Board | |
| Charts:- Daily , Weekly | |
| Add RDW to Watchlist: View: Get Complete RDW Trend Analysis ➞ | |
 | ASPN Aspen Aerogels, Inc. |
| Sector: Industrials | |
| SubSector: General Building Materials | |
| MarketCap: 150.153 Millions | |
| Recent Price: 6.46 Smart Investing & Trading Score: 100 | |
| Day Percent Change: 1.89% Day Change: 0.12 | |
| Week Change: 9.86% Year-to-date Change: -45.6% | |
| ASPN Links: Profile News Message Board | |
| Charts:- Daily , Weekly | |
| Add ASPN to Watchlist: View: Get Complete ASPN Trend Analysis ➞ | |
 | GENC Gencor Industries, Inc. |
| Sector: Industrials | |
| SubSector: Farm & Construction Machinery | |
| MarketCap: 147.607 Millions | |
| Recent Price: 15.11 Smart Investing & Trading Score: 73 | |
| Day Percent Change: 3% Day Change: 0.44 | |
| Week Change: -1.56% Year-to-date Change: -14.4% | |
| GENC Links: Profile News Message Board | |
| Charts:- Daily , Weekly | |
| Add GENC to Watchlist: View: Get Complete GENC Trend Analysis ➞ | |
| For tabular summary view of above stock list: Summary View ➞ 0 - 25 , 25 - 50 , 50 - 75 , 75 - 100 , 100 - 125 , 125 - 150 , 150 - 175 , 175 - 200 , 200 - 225 , 225 - 250 | ||
| Click To Change The Sort Order: By Market Cap or Company Size Performance: Year-to-date, Week and Day | |
| Select Chart Type: | ||
|
Best Stocks Today 12Stocks.com |
© 2025 12Stocks.com Terms & Conditions Privacy Contact Us
All Information Provided Only For Education And Not To Be Used For Investing or Trading. See Terms & Conditions


One More Thing ... Get Best Stocks Delivered Daily!
Never Ever Miss A Move With Our Top Ten Stocks Lists
Find Best Stocks In Any Market - Bull or Bear Market
Take A Peek At Our Top Ten Stocks Lists: Daily, Weekly, Year-to-Date & Top Trends
Find Best Stocks In Any Market - Bull or Bear Market
Take A Peek At Our Top Ten Stocks Lists: Daily, Weekly, Year-to-Date & Top Trends
Industrial Stocks With Best Up Trends [0-bearish to 100-bullish]: NET Power[100], Amprius Technologies[100], Plug Power[100], National Presto[100], Primoris Services[100], REX American[100], Enovix [100], Southland [100], Aspen Aerogels[100], American Superconductor[100], Gorman-Rupp [100]
Best Industrial Stocks Year-to-Date:
System1 [572.38%], Astronics [104.45%], NuScale Power[100.11%], Hertz Global[99.18%], Tutor Perini[99.09%], Planet Labs[69.55%], Amprius Technologies[67.14%], Carpenter Technology[65.1%], American Superconductor[62%], AeroVironment [60%], Titan [57.88%] Best Industrial Stocks This Week:
NET Power[27.02%], Plug Power[26.72%], NN [18.46%], Enovix [15.17%], Amprius Technologies[14.99%], Frontier [14.96%], Solid Power[14.42%], JELD-WEN Holding[14.14%], Planet Labs[12.85%], GMS [12.71%], LanzaTech Global[12%] Best Industrial Stocks Daily:
NET Power[24.02%], Planet Labs[11.56%], Priority Technology[10.03%], TPI Composites[9.21%], Amprius Technologies[6.85%], GrafTech [6.78%], Xometry [5.57%], Plug Power[5%], Graham [3.98%], Evolv Technologies[3.97%], National Presto[3.9%]