
 Login Sign Up


| |||||
 |  | ||||

| 12Stocks.com Market Intelligence |
Best Latin America Stocks
|
|
| Quick Read: Top Latin America Stocks By Performances & Trends: Daily, Weekly, Year-to-Date, Market Cap (Size) & Technical Trends | |||
| Best Latin America Views: Quick Browse View, Summary & Slide Show | |||
| 12Stocks.com Latin America Stocks Performances & Trends Daily | |||||||||
|
|  The overall market intelligence score is 40 (0-bearish to 100-bullish) which puts Latin America index in short term bearish to neutral trend. The market intelligence score from previous trading session is 50 and a deterioration of trend continues.
| ||||||||
Here are the market intelligence trend scores of the most requested Latin America stocks at 12Stocks.com (click stock name for detailed review):
| |||||||||||||||||||||||||
| Scroll down this page for most comprehensive review of Latin America stocks by performance, trends, technical analysis, charts, fund plays & more | |||||||||||||||||||||||||


| 12Stocks.com: Top Performing Latin America Index Stocks | ||||||||||||||||||||||||||||||||||||||||||||||||
 The top performing Latin America Index stocks year to date are
Now, more recently, over last week, the top performing Latin America Index stocks on the move are


|
||||||||||||||||||||||||||||||||||||||||||||||||
| 12Stocks.com: Investing in Latin America Index with Stocks | |
|
The following table helps investors and traders sort through current performance and trends (as measured by market intelligence score) of various
stocks in the Latin America Index. Quick View: Move mouse or cursor over stock symbol (ticker) to view short-term technical chart and over stock name to view long term chart. Click on  to add stock symbol to your watchlist and to add stock symbol to your watchlist and  to view watchlist. Click on any ticker or stock name for detailed market intelligence report for that stock. to view watchlist. Click on any ticker or stock name for detailed market intelligence report for that stock. |
12Stocks.com Performance of Stocks in Latin America Index
| Ticker | Stock Name | Watchlist | Category | Recent Price | Market Intelligence Score | Change % | YTD Change% |
| RY | Royal Bank |   | Financials | 146.96 | 60 | 0.37% | 26.00% |
| SHOP | Shopify | | Technology | 161.14 | 100 | 6.50% | 49.86% |
| TD | Toronto Dominion | | Financials | 81.23 | 100 | 2.01% | 58.72% |
| ENB | Enbridge | | Energy | 50.07 | 80 | 0.74% | 20.03% |
| BMO | Bank of Montreal | | Financials | 129.03 | 50 | -0.96% | 37.47% |
| BNS | Bank Of | | Financials | 65.25 | 90 | 0.29% | 27.16% |
| TRI | Thomson-Reuters Corp | | Industrials | 152.98 | 30 | 0.96% | -4.53% |
| AEM | Agnico Eagle | | Materials | 169.42 | 70 | 0.76% | 108.21% |
| CM | Canadian Imperial | | Financials | 81.47 | 80 | 0.92% | 32.69% |
| CP | Canadian Pacific | | Industrials | 77.59 | 90 | 2.28% | 5.72% |
| CNQ | Canadian Natural | | Energy | 31.83 | 50 | 1.24% | 4.16% |
| CNI | Canadian National | | Industrials | 96.38 | 90 | 2.02% | -4.21% |
| AMX | America Movil | | Technology | 20.97 | 50 | -0.80% | 47.74% |
| TRP | TC Energy | | Energy | 55.11 | 100 | 1.53% | 19.30% |
| MFC | Manulife Financial | | Financials | 31.96 | 90 | 1.75% | 6.90% |
| SU | Suncor Energy | | Energy | 41.35 | 40 | 0.58% | 17.32% |
| B | Barrick Mining | | Materials | 33.95 | 50 | 0.09% | 114.92% |
| WPM | Wheaton Precious | | Materials | 109.66 | 40 | -0.15% | 89.61% |
| WCN | Waste Connections | | Industrials | 174.42 | 50 | 0.80% | 3.18% |
| PBR | Petroleo Brasileiro | | Energy | 12.40 | 20 | -0.32% | -1.47% |
| IMO | Imperial Oil | | Energy | 90.04 | 30 | 0.92% | 46.17% |
| VALE | Vale S.A. | | Materials | 11.01 | 70 | -0.09% | 28.84% |
| ITUB | Itau Unibanco | | Financials | 7.17 | 30 | 0.70% | 69.01% |
| FNV | Franco-Nevada | | Materials | 220.18 | 60 | 1.21% | 82.66% |
| ABEV | Ambev S.A. | | Consumer Staples | 2.17 | 20 | -0.91% | 22.08% |
| To view more stocks, click on Next / Previous arrows or select different range: 0 - 25 , 25 - 50 , 50 - 75 , 75 - 100 , 100 - 125 , 125 - 150 , 150 - 175 , 175 - 200 , 200 - 225 , 225 - 250 , 250 - 275 , 275 - 300 , 300 - 325 | ||
 | Click To Change The Sort Order: By Market Cap or Company Size Performance: Year-to-date, Week and Day |  |
| Detailed Overview Of Latin America Stocks |
| Latin America Technical Overview, Leaders & Laggards, Top Latin America ETF Funds & Detailed Latin America Stocks List, Charts, Trends & More |
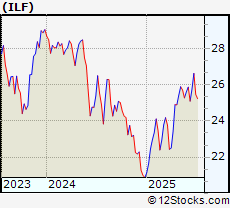
| Latin America: Technical Analysis, Trends & YTD Performance | |
 ILF Weekly Chart |
|
| Long Term Trend: Very Good | |
| Medium Term Trend: Very Good | |
 ILF Daily Chart |
|
| Short Term Trend: Not Good | |
| Overall Trend Score: 40 | |
| YTD Performance: 37.4889% | |
| **Trend Scores & Views Are Only For Educational Purposes And Not For Investing | |
| 12Stocks.com: Investing in Latin America Index using Exchange Traded Funds | |
|
The following table shows list of key exchange traded funds (ETF) that
help investors play Latin America stock market. For detailed view, check out our ETF Funds section of our website. Quick View: Move mouse or cursor over ETF symbol (ticker) to view short-term technical chart and over ETF name to view long term chart. Click on ticker or stock name for detailed view. Click on to add stock symbol to your watchlist and to view watchlist. |
12Stocks.com List of ETFs that track Latin America Index
| Ticker | ETF Name | Watchlist | Recent Price | Market Intelligence Score | Change % | Week % | Year-to-date % |
| LBJ | Latin America Bull | | 60.40 | 50 | 0 | 0 | 0% |
| DBBR | Brazil Hedgd Eq | | 54.06 | 70 | -0.478645 | 0.632911 | 0% |
| FBZ | Brazil AlphaDEX | | 11.52 | 30 | 0 | 0 | 29.5955% |
| 12Stocks.com: Charts, Trends, Fundamental Data and Performances of Latin America Stocks | |
|
We now take in-depth look at all Latin America stocks including charts, multi-period performances and overall trends (as measured by market intelligence score). One can sort Latin America stocks (click link to choose) by Daily, Weekly and by Year-to-Date performances. Also, one can sort by size of the company or by market capitalization. |
| Select Your Default Chart Type: | |||||
| |||||
| Click on stock symbol or name for detailed view. Click on to add stock symbol to your watchlist and to view watchlist. Quick View: Move mouse or cursor over "Daily" to quickly view daily technical stock chart and over "Weekly" to view weekly technical stock chart. | |||||

 | RY Royal Bank Of Canada |
| Sector: Financials | |
| SubSector: Banks - Diversified | |
| MarketCap: 203771 Millions | |
| Recent Price: 146.96 Market Intelligence Score: 60 | |
| Day Percent Change: 0.368802% Day Change: 0.19 | |
| Week Change: 0.499214% Year-to-date Change: 26.0% | |
| RY Links: Profile News Message Board | |
| Charts:- Daily , Weekly | |
| Add RY to Watchlist: View: Get Complete RY Trend Analysis ➞ | |
 | SHOP Shopify Inc |
| Sector: Technology | |
| SubSector: Software - Application | |
| MarketCap: 190816 Millions | |
| Recent Price: 161.14 Market Intelligence Score: 100 | |
| Day Percent Change: 6.50363% Day Change: 9 | |
| Week Change: 12.3318% Year-to-date Change: 49.9% | |
| SHOP Links: Profile News Message Board | |
| Charts:- Daily , Weekly | |
| Add SHOP to Watchlist: View: Get Complete SHOP Trend Analysis ➞ | |
 | TD Toronto Dominion Bank |
| Sector: Financials | |
| SubSector: Banks - Diversified | |
| MarketCap: 130432 Millions | |
| Recent Price: 81.23 Market Intelligence Score: 100 | |
| Day Percent Change: 2.00929% Day Change: 1.33 | |
| Week Change: 3.03146% Year-to-date Change: 58.7% | |
| TD Links: Profile News Message Board | |
| Charts:- Daily , Weekly | |
| Add TD to Watchlist: View: Get Complete TD Trend Analysis ➞ | |
 | ENB Enbridge Inc |
| Sector: Energy | |
| SubSector: Oil & Gas Midstream | |
| MarketCap: 105232 Millions | |
| Recent Price: 50.07 Market Intelligence Score: 80 | |
| Day Percent Change: 0.744467% Day Change: 0.41 | |
| Week Change: 1.00867% Year-to-date Change: 20.0% | |
| ENB Links: Profile News Message Board | |
| Charts:- Daily , Weekly | |
| Add ENB to Watchlist: View: Get Complete ENB Trend Analysis ➞ | |
 | BMO Bank of Montreal |
| Sector: Financials | |
| SubSector: Banks - Diversified | |
| MarketCap: 91053 Millions | |
| Recent Price: 129.03 Market Intelligence Score: 50 | |
| Day Percent Change: -0.959472% Day Change: -2.46 | |
| Week Change: -0.278229% Year-to-date Change: 37.5% | |
| BMO Links: Profile News Message Board | |
| Charts:- Daily , Weekly | |
| Add BMO to Watchlist: View: Get Complete BMO Trend Analysis ➞ | |
 | BNS Bank Of Nova Scotia |
| Sector: Financials | |
| SubSector: Banks - Diversified | |
| MarketCap: 79019 Millions | |
| Recent Price: 65.25 Market Intelligence Score: 90 | |
| Day Percent Change: 0.292038% Day Change: 0.43 | |
| Week Change: 1.3671% Year-to-date Change: 27.2% | |
| BNS Links: Profile News Message Board | |
| Charts:- Daily , Weekly | |
| Add BNS to Watchlist: View: Get Complete BNS Trend Analysis ➞ | |
 | TRI Thomson-Reuters Corp |
| Sector: Industrials | |
| SubSector: Specialty Business Services | |
| MarketCap: 78671.8 Millions | |
| Recent Price: 152.98 Market Intelligence Score: 30 | |
| Day Percent Change: 0.963569% Day Change: -0.2 | |
| Week Change: -3.14657% Year-to-date Change: -4.5% | |
| TRI Links: Profile News Message Board | |
| Charts:- Daily , Weekly | |
| Add TRI to Watchlist: View: Get Complete TRI Trend Analysis ➞ | |
 | AEM Agnico Eagle Mines Ltd |
| Sector: Materials | |
| SubSector: Gold | |
| MarketCap: 76280.3 Millions | |
| Recent Price: 169.42 Market Intelligence Score: 70 | |
| Day Percent Change: 0.76127% Day Change: 0.94 | |
| Week Change: 5.95372% Year-to-date Change: 108.2% | |
| AEM Links: Profile News Message Board | |
| Charts:- Daily , Weekly | |
| Add AEM to Watchlist: View: Get Complete AEM Trend Analysis ➞ | |
 | CM Canadian Imperial Bank Of Commerce |
| Sector: Financials | |
| SubSector: Banks - Diversified | |
| MarketCap: 73165.8 Millions | |
| Recent Price: 81.47 Market Intelligence Score: 80 | |
| Day Percent Change: 0.916636% Day Change: 1.03 | |
| Week Change: 1.40652% Year-to-date Change: 32.7% | |
| CM Links: Profile News Message Board | |
| Charts:- Daily , Weekly | |
| Add CM to Watchlist: View: Get Complete CM Trend Analysis ➞ | |
 | CP Canadian Pacific Kansas City Limited |
| Sector: Industrials | |
| SubSector: Railroads | |
| MarketCap: 70344.8 Millions | |
| Recent Price: 77.59 Market Intelligence Score: 90 | |
| Day Percent Change: 2.28052% Day Change: 1.45 | |
| Week Change: 4.55464% Year-to-date Change: 5.7% | |
| CP Links: Profile News Message Board | |
| Charts:- Daily , Weekly | |
| Add CP to Watchlist: View: Get Complete CP Trend Analysis ➞ | |
 | CNQ Canadian Natural Resources Ltd |
| Sector: Energy | |
| SubSector: Oil & Gas E&P | |
| MarketCap: 63552 Millions | |
| Recent Price: 31.83 Market Intelligence Score: 50 | |
| Day Percent Change: 1.24046% Day Change: 0.38 | |
| Week Change: -1.97105% Year-to-date Change: 4.2% | |
| CNQ Links: Profile News Message Board | |
| Charts:- Daily , Weekly | |
| Add CNQ to Watchlist: View: Get Complete CNQ Trend Analysis ➞ | |
 | CNI Canadian National Railway Co |
| Sector: Industrials | |
| SubSector: Railroads | |
| MarketCap: 60266.5 Millions | |
| Recent Price: 96.38 Market Intelligence Score: 90 | |
| Day Percent Change: 2.02181% Day Change: 1.55 | |
| Week Change: 4.30736% Year-to-date Change: -4.2% | |
| CNI Links: Profile News Message Board | |
| Charts:- Daily , Weekly | |
| Add CNI to Watchlist: View: Get Complete CNI Trend Analysis ➞ | |
 | AMX America Movil S.A.B.DE C.V. ADR |
| Sector: Technology | |
| SubSector: Telecom Services | |
| MarketCap: 59926.6 Millions | |
| Recent Price: 20.97 Market Intelligence Score: 50 | |
| Day Percent Change: -0.804163% Day Change: -0.23 | |
| Week Change: 2.29268% Year-to-date Change: 47.7% | |
| AMX Links: Profile News Message Board | |
| Charts:- Daily , Weekly | |
| Add AMX to Watchlist: View: Get Complete AMX Trend Analysis ➞ | |
 | TRP TC Energy Corporation |
| Sector: Energy | |
| SubSector: Oil & Gas Midstream | |
| MarketCap: 53934.4 Millions | |
| Recent Price: 55.11 Market Intelligence Score: 100 | |
| Day Percent Change: 1.52911% Day Change: 0.75 | |
| Week Change: 2.64481% Year-to-date Change: 19.3% | |
| TRP Links: Profile News Message Board | |
| Charts:- Daily , Weekly | |
| Add TRP to Watchlist: View: Get Complete TRP Trend Analysis ➞ | |
 | MFC Manulife Financial Corp |
| Sector: Financials | |
| SubSector: Insurance - Life | |
| MarketCap: 52077.2 Millions | |
| Recent Price: 31.96 Market Intelligence Score: 90 | |
| Day Percent Change: 1.75103% Day Change: 0.34 | |
| Week Change: 4.20606% Year-to-date Change: 6.9% | |
| MFC Links: Profile News Message Board | |
| Charts:- Daily , Weekly | |
| Add MFC to Watchlist: View: Get Complete MFC Trend Analysis ➞ | |
 | SU Suncor Energy, Inc |
| Sector: Energy | |
| SubSector: Oil & Gas Integrated | |
| MarketCap: 48493.6 Millions | |
| Recent Price: 41.35 Market Intelligence Score: 40 | |
| Day Percent Change: 0.5838% Day Change: 0.27 | |
| Week Change: -3.16159% Year-to-date Change: 17.3% | |
| SU Links: Profile News Message Board | |
| Charts:- Daily , Weekly | |
| Add SU to Watchlist: View: Get Complete SU Trend Analysis ➞ | |
 | B Barrick Mining Corp |
| Sector: Materials | |
| SubSector: Gold | |
| MarketCap: 48467.2 Millions | |
| Recent Price: 33.95 Market Intelligence Score: 50 | |
| Day Percent Change: 0.0884434% Day Change: -0.01 | |
| Week Change: -0.904845% Year-to-date Change: 114.9% | |
| B Links: Profile News Message Board | |
| Charts:- Daily , Weekly | |
| Add B to Watchlist: View: Get Complete B Trend Analysis ➞ | |
 | WPM Wheaton Precious Metals Corp |
| Sector: Materials | |
| SubSector: Gold | |
| MarketCap: 47319.8 Millions | |
| Recent Price: 109.66 Market Intelligence Score: 40 | |
| Day Percent Change: -0.154785% Day Change: 0.36 | |
| Week Change: 2.15184% Year-to-date Change: 89.6% | |
| WPM Links: Profile News Message Board | |
| Charts:- Daily , Weekly | |
| Add WPM to Watchlist: View: Get Complete WPM Trend Analysis ➞ | |
 | WCN Waste Connections Inc |
| Sector: Industrials | |
| SubSector: Waste Management | |
| MarketCap: 46164.4 Millions | |
| Recent Price: 174.42 Market Intelligence Score: 50 | |
| Day Percent Change: 0.803329% Day Change: 1.79 | |
| Week Change: 1.80948% Year-to-date Change: 3.2% | |
| WCN Links: Profile News Message Board | |
| Charts:- Daily , Weekly | |
| Add WCN to Watchlist: View: Get Complete WCN Trend Analysis ➞ | |
 | PBR Petroleo Brasileiro S.A. Petrobras ADR |
| Sector: Energy | |
| SubSector: Oil & Gas Integrated | |
| MarketCap: 45433.4 Millions | |
| Recent Price: 12.40 Market Intelligence Score: 20 | |
| Day Percent Change: -0.321543% Day Change: -0.03 | |
| Week Change: -5.41571% Year-to-date Change: -1.5% | |
| PBR Links: Profile News Message Board | |
| Charts:- Daily , Weekly | |
| Add PBR to Watchlist: View: Get Complete PBR Trend Analysis ➞ | |
 | IMO Imperial Oil Ltd |
| Sector: Energy | |
| SubSector: Oil & Gas Integrated | |
| MarketCap: 44429.9 Millions | |
| Recent Price: 90.04 Market Intelligence Score: 30 | |
| Day Percent Change: 0.919076% Day Change: 1.34 | |
| Week Change: -3.56646% Year-to-date Change: 46.2% | |
| IMO Links: Profile News Message Board | |
| Charts:- Daily , Weekly | |
| Add IMO to Watchlist: View: Get Complete IMO Trend Analysis ➞ | |
 | VALE Vale S.A. ADR |
| Sector: Materials | |
| SubSector: Other Industrial Metals & Mining | |
| MarketCap: 44395.3 Millions | |
| Recent Price: 11.01 Market Intelligence Score: 70 | |
| Day Percent Change: -0.0907441% Day Change: 0.02 | |
| Week Change: 1.10193% Year-to-date Change: 28.8% | |
| VALE Links: Profile News Message Board | |
| Charts:- Daily , Weekly | |
| Add VALE to Watchlist: View: Get Complete VALE Trend Analysis ➞ | |
 | ITUB Itau Unibanco Holding S.A. ADR |
| Sector: Financials | |
| SubSector: Banks - Regional | |
| MarketCap: 37841.9 Millions | |
| Recent Price: 7.17 Market Intelligence Score: 30 | |
| Day Percent Change: 0.702247% Day Change: -0.05 | |
| Week Change: -0.416667% Year-to-date Change: 69.0% | |
| ITUB Links: Profile News Message Board | |
| Charts:- Daily , Weekly | |
| Add ITUB to Watchlist: View: Get Complete ITUB Trend Analysis ➞ | |
 | FNV Franco-Nevada Corporation |
| Sector: Materials | |
| SubSector: Gold | |
| MarketCap: 37343.3 Millions | |
| Recent Price: 220.18 Market Intelligence Score: 60 | |
| Day Percent Change: 1.21357% Day Change: 1.69 | |
| Week Change: 2.92633% Year-to-date Change: 82.7% | |
| FNV Links: Profile News Message Board | |
| Charts:- Daily , Weekly | |
| Add FNV to Watchlist: View: Get Complete FNV Trend Analysis ➞ | |
 | ABEV Ambev S.A. ADR |
| Sector: Consumer Staples | |
| SubSector: Beverages - Brewers | |
| MarketCap: 34770.6 Millions | |
| Recent Price: 2.17 Market Intelligence Score: 20 | |
| Day Percent Change: -0.913242% Day Change: -0.01 | |
| Week Change: -5.65217% Year-to-date Change: 22.1% | |
| ABEV Links: Profile News Message Board | |
| Charts:- Daily , Weekly | |
| Add ABEV to Watchlist: View: Get Complete ABEV Trend Analysis ➞ | |
| To view more stocks, click on Next / Previous arrows or select different range: 0 - 25 , 25 - 50 , 50 - 75 , 75 - 100 , 100 - 125 , 125 - 150 , 150 - 175 , 175 - 200 , 200 - 225 , 225 - 250 , 250 - 275 , 275 - 300 , 300 - 325 | ||
| Click To Change The Sort Order: By Market Cap or Company Size Performance: Year-to-date, Week and Day | |
| Select Chart Type: | ||
 Best Stocks Today 12Stocks.com |
© 2025 12Stocks.com Terms & Conditions Privacy Contact Us
All Information Provided Only For Education And Not To Be Used For Investing or Trading. See Terms & Conditions


One More Thing ... Get Best Stocks Delivered Daily!
Never Ever Miss A Move With Our Top Ten Stocks Lists
Find Best Stocks In Any Market - Bull or Bear Market
Take A Peek At Our Top Ten Stocks Lists: Daily, Weekly, Year-to-Date & Top Trends
Find Best Stocks In Any Market - Bull or Bear Market
Take A Peek At Our Top Ten Stocks Lists: Daily, Weekly, Year-to-Date & Top Trends
Latin America Stocks With Best Up Trends [0-bearish to 100-bullish]: Lithium Americas[100], Ballard Power[100], Tower[100], Northern Dynasty[100], Shopify [100], McEwen [100], Pembina Pipeline[100], Vermilion Energy[100], Transalta Corp[100], Silvercorp Metals[100], Hudbay Minerals[100]
Best Latin America Stocks Year-to-Date:
Americas Gold[912.82%], Avino Silver[463.366%], Tower[297.028%], Gold Royalty[208.871%], Lithium Americas[195.425%], EMX Royalty[185.632%], New Gold[180.534%], Kinross Gold[154.541%], Celestica [151.069%], Iamgold Corp[137.993%], Silvercorp Metals[122.866%] Best Latin America Stocks This Week:
Companhia Brasileira[18587.4%], Cosan [16415.2%], Crescent Point[4066.17%], Golden Star[1837.95%], Grupo Financiero[1283.52%], Alexco Resource[690.301%], Yamana Gold[625.812%], Novelion [579.167%], Turquoise Hill[433.11%], Enerplus [415.601%], Nevsun Resources[402.516%] Best Latin America Stocks Daily:
Lithium Americas[31.7784%], Ballard Power[22.7826%], Tower[11.976%], Northern Dynasty[8.19672%], Platinum [8.13953%], Novelion [7.37813%], Grupo Simec[7.34127%], Shopify [6.50363%], McEwen [6.02923%], Pembina Pipeline[6.02015%], Vermilion Energy[5.81542%]