
 Login Sign Up


| |||||
 |  | ||||

| 12Stocks.com Market Intelligence |
Best Latin America Stocks
|
|
| Quick Read: Top Latin America Stocks By Performances & Trends: Daily, Weekly, Year-to-Date, Market Cap (Size) & Technical Trends | |||
| Best Latin America Views: Quick Browse View, Summary & Slide Show | |||
| 12Stocks.com Latin America Stocks Performances & Trends Daily | |||||||||
|
|  The overall market intelligence score is 36 (0-bearish to 100-bullish) which puts Latin America index in short term bearish to neutral trend. The market intelligence score from previous trading session is 51 and hence a deterioration of trend.
| ||||||||
Here are the market intelligence trend scores of the most requested Latin America stocks at 12Stocks.com (click stock name for detailed review):
| ||
| Scroll down this page for most comprehensive review of Latin America stocks by performance, trends, technical analysis, charts, fund plays & more | ||

| 12Stocks.com: Top Performing Latin America Index Stocks | ||||||||||||||||||||||||||||||||||||||||||||||||
 The top performing Latin America Index stocks year to date are
Now, more recently, over last week, the top performing Latin America Index stocks on the move are


|
||||||||||||||||||||||||||||||||||||||||||||||||
| 12Stocks.com: Investing in Latin America Index with Stocks | |
|
The following table helps investors and traders sort through current performance and trends (as measured by market intelligence score) of various
stocks in the Latin America Index. Quick View: Move mouse or cursor over stock symbol (ticker) to view short-term technical chart and over stock name to view long term chart. Click on  to add stock symbol to your watchlist and to add stock symbol to your watchlist and  to view watchlist. Click on any ticker or stock name for detailed market intelligence report for that stock. to view watchlist. Click on any ticker or stock name for detailed market intelligence report for that stock. |
12Stocks.com Performance of Stocks in Latin America Index
| Ticker | Stock Name | Watchlist | Category | Recent Price | Market Intelligence Score | Change % | YTD Change% |
| ACHV | Achieve Life |   | Health Care | 2.75 | 100 | 18.53 | -21.88% |
| QBTS | D-Wave Quantum | | Technology | 15.83 | 68 | 6.89 | 88.45% |
| IMAX | IMAX | | Services & Goods | 27.90 | 73 | 3.60 | 8.98% |
| AUPH | Aurinia | | Health Care | 9.04 | 100 | 2.73 | 0.67% |
| NG | NovaGold Resources | | Materials | 4.91 | 100 | 2.29 | 47.45% |
| NU | Nu | | Financials | 13.07 | 31 | 1.87 | 26.16% |
| CIO | City Office | | Financials | 5.81 | 95 | 1.57 | 9.81% |
| BIOA | BioAmber | | Materials | 4.63 | 32 | 1.54 | -20.03% |
| RBA | Ritchie Bros. | | Services & Goods | 109.66 | 95 | 1.39 | 21.93% |
| BUR | Burcon Nutrascience | | Health Care | 14.37 | 17 | 1.34 | 12.71% |
| SSRM | SSR Mining | | Materials | 12.72 | 78 | 0.47 | 82.76% |
| ZYME | Zymeworks | | Health Care | 13.35 | 63 | 0.07 | -8.81% |
| PAGS | PagSeguro Digital | | Financials | 8.67 | 5 | -0.23 | 38.50% |
| MELI | MercadoLibre | | Services & Goods | 2380.25 | 33 | -0.30 | 39.98% |
| KFS | Kingsway Financial | | Financials | 14.38 | 51 | -1.44 | 71.80% |
| XP | XP | | Financials | 17.96 | 36 | -1.64 | 51.56% |
| STKL | SunOpta | | Consumer Staples | 6.14 | 56 | -1.92 | -20.26% |
| STNE | StoneCo | | Technology | 15.17 | 36 | -1.94 | 90.34% |
| RC | Ready Capital | | Financials | 4.35 | 15 | -2.03 | -34.57% |
| TCX | Tucows | | Technology | 22.10 | 78 | -2.86 | 28.94% |
| LULU | Lululemon Athletica | | Consumer Staples | 228.89 | 10 | -3.22 | -40.15% |
| IE | Ivanhoe Electric | | Materials | 10.00 | 78 | -3.75 | 32.45% |
| To view more stocks, click on Next / Previous arrows or select different range: 0 - 25 | ||
 | Click To Change The Sort Order: By Market Cap or Company Size Performance: Year-to-date, Week and Day |  |
| Detailed Overview Of Latin America Stocks |
| Latin America Technical Overview, Leaders & Laggards, Top Latin America ETF Funds & Detailed Latin America Stocks List, Charts, Trends & More |
| Latin America: Technical Analysis, Trends & YTD Performance | |
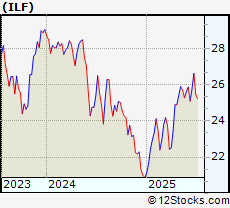
 ILF Weekly Chart |
|
| Long Term Trend: Very Good | |
| Medium Term Trend: Not Good | |
 ILF Daily Chart |
|
| Short Term Trend: Not Good | |
| Overall Trend Score: 36 | |
| YTD Performance: 20.76% | |
| **Trend Scores & Views Are Only For Educational Purposes And Not For Investing | |
| 12Stocks.com: Investing in Latin America Index using Exchange Traded Funds | |
|
The following table shows list of key exchange traded funds (ETF) that
help investors play Latin America stock market. For detailed view, check out our ETF Funds section of our website. Quick View: Move mouse or cursor over ETF symbol (ticker) to view short-term technical chart and over ETF name to view long term chart. Click on ticker or stock name for detailed view. Click on to add stock symbol to your watchlist and to view watchlist. |
12Stocks.com List of ETFs that track Latin America Index
| Ticker | ETF Name | Watchlist | Recent Price | Market Intelligence Score | Change % | Week % | Year-to-date % |
| ILF | Latin America 40 | | 25.25 | 36 | -0.86 | -0.86 | 20.76% |
| EWC | Canada | | 46.44 | 83 | 0.67 | 0.67 | 15.24% |
| EWZ | Brazil | | 27.31 | 36 | -0.8 | -0.8 | 21.32% |
| EWW | Mexico | | 59.61 | 36 | -0.86 | -0.86 | 27.32% |
| BRZU | Brazil Bull 3X | | 58.57 | 31 | -1.63 | -1.63 | 41.52% |
| 12Stocks.com: Charts, Trends, Fundamental Data and Performances of Latin America Stocks | |
|
We now take in-depth look at all Latin America stocks including charts, multi-period performances and overall trends (as measured by market intelligence score). One can sort Latin America stocks (click link to choose) by Daily, Weekly and by Year-to-Date performances. Also, one can sort by size of the company or by market capitalization. |
| Select Your Default Chart Type: | |||||
| |||||
| Click on stock symbol or name for detailed view. Click on to add stock symbol to your watchlist and to view watchlist. Quick View: Move mouse or cursor over "Daily" to quickly view daily technical stock chart and over "Weekly" to view weekly technical stock chart. | |||||

 | ACHV Achieve Life Sciences, Inc. |
| Sector: Health Care | |
| SubSector: Biotechnology | |
| MarketCap: 7.32785 Millions | |
| Recent Price: 2.75 Market Intelligence Score: 100 | |
| Day Percent Change: 18.53% Day Change: 0.43 | |
| Week Change: 18.53% Year-to-date Change: -21.9% | |
| ACHV Links: Profile News Message Board | |
| Charts:- Daily , Weekly | |
| Add ACHV to Watchlist: View: Get Complete ACHV Trend Analysis ➞ | |
 | QBTS D-Wave Quantum Inc. |
| Sector: Technology | |
| SubSector: Computer Hardware | |
| MarketCap: 290 Millions | |
| Recent Price: 15.83 Market Intelligence Score: 68 | |
| Day Percent Change: 6.89% Day Change: 1.02 | |
| Week Change: 6.89% Year-to-date Change: 88.5% | |
| QBTS Links: Profile News Message Board | |
| Charts:- Daily , Weekly | |
| Add QBTS to Watchlist: View: Get Complete QBTS Trend Analysis ➞ | |
 | IMAX IMAX Corporation |
| Sector: Services & Goods | |
| SubSector: Entertainment - Diversified | |
| MarketCap: 874.237 Millions | |
| Recent Price: 27.90 Market Intelligence Score: 73 | |
| Day Percent Change: 3.6% Day Change: 0.97 | |
| Week Change: 3.6% Year-to-date Change: 9.0% | |
| IMAX Links: Profile News Message Board | |
| Charts:- Daily , Weekly | |
| Add IMAX to Watchlist: View: Get Complete IMAX Trend Analysis ➞ | |
 | AUPH Aurinia Pharmaceuticals Inc. |
| Sector: Health Care | |
| SubSector: Biotechnology | |
| MarketCap: 1319.75 Millions | |
| Recent Price: 9.04 Market Intelligence Score: 100 | |
| Day Percent Change: 2.73% Day Change: 0.24 | |
| Week Change: 2.73% Year-to-date Change: 0.7% | |
| AUPH Links: Profile News Message Board | |
| Charts:- Daily , Weekly | |
| Add AUPH to Watchlist: View: Get Complete AUPH Trend Analysis ➞ | |
 | NG NovaGold Resources Inc. |
| Sector: Materials | |
| SubSector: Gold | |
| MarketCap: 2499.49 Millions | |
| Recent Price: 4.91 Market Intelligence Score: 100 | |
| Day Percent Change: 2.29% Day Change: 0.11 | |
| Week Change: 2.29% Year-to-date Change: 47.5% | |
| NG Links: Profile News Message Board | |
| Charts:- Daily , Weekly | |
| Add NG to Watchlist: View: Get Complete NG Trend Analysis ➞ | |
 | NU Nu Holdings Ltd. |
| Sector: Financials | |
| SubSector: Banks - Diversified | |
| MarketCap: 37240 Millions | |
| Recent Price: 13.07 Market Intelligence Score: 31 | |
| Day Percent Change: 1.87% Day Change: 0.24 | |
| Week Change: 1.87% Year-to-date Change: 26.2% | |
| NU Links: Profile News Message Board | |
| Charts:- Daily , Weekly | |
| Add NU to Watchlist: View: Get Complete NU Trend Analysis ➞ | |
 | CIO City Office REIT, Inc. |
| Sector: Financials | |
| SubSector: REIT - Office | |
| MarketCap: 478.566 Millions | |
| Recent Price: 5.81 Market Intelligence Score: 95 | |
| Day Percent Change: 1.57% Day Change: 0.09 | |
| Week Change: 1.57% Year-to-date Change: 9.8% | |
| CIO Links: Profile News Message Board | |
| Charts:- Daily , Weekly | |
| Add CIO to Watchlist: View: Get Complete CIO Trend Analysis ➞ | |
 | BIOA BioAmber Inc. |
| Sector: Materials | |
| SubSector: Chemicals - Major Diversified | |
| MarketCap: 116.06 Millions | |
| Recent Price: 4.63 Market Intelligence Score: 32 | |
| Day Percent Change: 1.54% Day Change: 0.07 | |
| Week Change: 1.54% Year-to-date Change: -20.0% | |
| BIOA Links: Profile News Message Board | |
| Charts:- Daily , Weekly | |
| Add BIOA to Watchlist: View: Get Complete BIOA Trend Analysis ➞ | |
 | RBA Ritchie Bros. Auctioneers Incorporated |
| Sector: Services & Goods | |
| SubSector: Business Services | |
| MarketCap: 3491.02 Millions | |
| Recent Price: 109.66 Market Intelligence Score: 95 | |
| Day Percent Change: 1.39% Day Change: 1.5 | |
| Week Change: 1.39% Year-to-date Change: 21.9% | |
| RBA Links: Profile News Message Board | |
| Charts:- Daily , Weekly | |
| Add RBA to Watchlist: View: Get Complete RBA Trend Analysis ➞ | |
 | BUR Burcon Nutrascience Corporation |
| Sector: Health Care | |
| SubSector: Biotechnology | |
| MarketCap: 0 Millions | |
| Recent Price: 14.37 Market Intelligence Score: 17 | |
| Day Percent Change: 1.34% Day Change: 0.19 | |
| Week Change: 1.34% Year-to-date Change: 12.7% | |
| BUR Links: Profile News Message Board | |
| Charts:- Daily , Weekly | |
| Add BUR to Watchlist: View: Get Complete BUR Trend Analysis ➞ | |
 | SSRM SSR Mining Inc. |
| Sector: Materials | |
| SubSector: Gold | |
| MarketCap: 1546.09 Millions | |
| Recent Price: 12.72 Market Intelligence Score: 78 | |
| Day Percent Change: 0.47% Day Change: 0.06 | |
| Week Change: 0.47% Year-to-date Change: 82.8% | |
| SSRM Links: Profile News Message Board | |
| Charts:- Daily , Weekly | |
| Add SSRM to Watchlist: View: Get Complete SSRM Trend Analysis ➞ | |
 | ZYME Zymeworks Inc. |
| Sector: Health Care | |
| SubSector: Biotechnology | |
| MarketCap: 1373.55 Millions | |
| Recent Price: 13.35 Market Intelligence Score: 63 | |
| Day Percent Change: 0.07% Day Change: 0.01 | |
| Week Change: 0.07% Year-to-date Change: -8.8% | |
| ZYME Links: Profile News Message Board | |
| Charts:- Daily , Weekly | |
| Add ZYME to Watchlist: View: Get Complete ZYME Trend Analysis ➞ | |
 | PAGS PagSeguro Digital Ltd. |
| Sector: Financials | |
| SubSector: Credit Services | |
| MarketCap: 6500.78 Millions | |
| Recent Price: 8.67 Market Intelligence Score: 5 | |
| Day Percent Change: -0.23% Day Change: -0.02 | |
| Week Change: -0.23% Year-to-date Change: 38.5% | |
| PAGS Links: Profile News Message Board | |
| Charts:- Daily , Weekly | |
| Add PAGS to Watchlist: View: Get Complete PAGS Trend Analysis ➞ | |
 | MELI MercadoLibre, Inc. |
| Sector: Services & Goods | |
| SubSector: Catalog & Mail Order Houses | |
| MarketCap: 24695.5 Millions | |
| Recent Price: 2380.25 Market Intelligence Score: 33 | |
| Day Percent Change: -0.3% Day Change: -7.2 | |
| Week Change: -0.3% Year-to-date Change: 40.0% | |
| MELI Links: Profile News Message Board | |
| Charts:- Daily , Weekly | |
| Add MELI to Watchlist: View: Get Complete MELI Trend Analysis ➞ | |
 | KFS Kingsway Financial Services Inc. |
| Sector: Financials | |
| SubSector: Property & Casualty Insurance | |
| MarketCap: 47.5812 Millions | |
| Recent Price: 14.38 Market Intelligence Score: 51 | |
| Day Percent Change: -1.44% Day Change: -0.21 | |
| Week Change: -1.44% Year-to-date Change: 71.8% | |
| KFS Links: Profile News Message Board | |
| Charts:- Daily , Weekly | |
| Add KFS to Watchlist: View: Get Complete KFS Trend Analysis ➞ | |
 | XP XP Inc. |
| Sector: Financials | |
| SubSector: Asset Management | |
| MarketCap: 12990.3 Millions | |
| Recent Price: 17.96 Market Intelligence Score: 36 | |
| Day Percent Change: -1.64% Day Change: -0.3 | |
| Week Change: -1.64% Year-to-date Change: 51.6% | |
| XP Links: Profile News Message Board | |
| Charts:- Daily , Weekly | |
| Add XP to Watchlist: View: Get Complete XP Trend Analysis ➞ | |
 | STKL SunOpta Inc. |
| Sector: Consumer Staples | |
| SubSector: Processed & Packaged Goods | |
| MarketCap: 174.548 Millions | |
| Recent Price: 6.14 Market Intelligence Score: 56 | |
| Day Percent Change: -1.92% Day Change: -0.12 | |
| Week Change: -1.92% Year-to-date Change: -20.3% | |
| STKL Links: Profile News Message Board | |
| Charts:- Daily , Weekly | |
| Add STKL to Watchlist: View: Get Complete STKL Trend Analysis ➞ | |
 | STNE StoneCo Ltd. |
| Sector: Technology | |
| SubSector: Application Software | |
| MarketCap: 7347.82 Millions | |
| Recent Price: 15.17 Market Intelligence Score: 36 | |
| Day Percent Change: -1.94% Day Change: -0.3 | |
| Week Change: -1.94% Year-to-date Change: 90.3% | |
| STNE Links: Profile News Message Board | |
| Charts:- Daily , Weekly | |
| Add STNE to Watchlist: View: Get Complete STNE Trend Analysis ➞ | |
 | RC Ready Capital Corporation |
| Sector: Financials | |
| SubSector: Mortgage Investment | |
| MarketCap: 358.039 Millions | |
| Recent Price: 4.35 Market Intelligence Score: 15 | |
| Day Percent Change: -2.03% Day Change: -0.09 | |
| Week Change: -2.03% Year-to-date Change: -34.6% | |
| RC Links: Profile News Message Board | |
| Charts:- Daily , Weekly | |
| Add RC to Watchlist: View: Get Complete RC Trend Analysis ➞ | |
 | TCX Tucows Inc. |
| Sector: Technology | |
| SubSector: Internet Information Providers | |
| MarketCap: 557.78 Millions | |
| Recent Price: 22.10 Market Intelligence Score: 78 | |
| Day Percent Change: -2.86% Day Change: -0.65 | |
| Week Change: -2.86% Year-to-date Change: 28.9% | |
| TCX Links: Profile News Message Board | |
| Charts:- Daily , Weekly | |
| Add TCX to Watchlist: View: Get Complete TCX Trend Analysis ➞ | |
 | LULU Lululemon Athletica Inc. |
| Sector: Consumer Staples | |
| SubSector: Textile - Apparel Clothing | |
| MarketCap: 24627.8 Millions | |
| Recent Price: 228.89 Market Intelligence Score: 10 | |
| Day Percent Change: -3.22% Day Change: -7.62 | |
| Week Change: -3.22% Year-to-date Change: -40.2% | |
| LULU Links: Profile News Message Board | |
| Charts:- Daily , Weekly | |
| Add LULU to Watchlist: View: Get Complete LULU Trend Analysis ➞ | |
 | IE Ivanhoe Electric Inc. |
| Sector: Materials | |
| SubSector: Copper | |
| MarketCap: 1200 Millions | |
| Recent Price: 10.00 Market Intelligence Score: 78 | |
| Day Percent Change: -3.75% Day Change: -0.39 | |
| Week Change: -3.75% Year-to-date Change: 32.5% | |
| IE Links: Profile News Message Board | |
| Charts:- Daily , Weekly | |
| Add IE to Watchlist: View: Get Complete IE Trend Analysis ➞ | |
| To view more stocks, click on Next / Previous arrows or select different range: 0 - 25 | ||
| Click To Change The Sort Order: By Market Cap or Company Size Performance: Year-to-date, Week and Day | |
| Select Chart Type: | ||
 Best Stocks Today 12Stocks.com |
© 2025 12Stocks.com Terms & Conditions Privacy Contact Us
All Information Provided Only For Education And Not To Be Used For Investing or Trading. See Terms & Conditions


One More Thing ... Get Best Stocks Delivered Daily!
Never Ever Miss A Move With Our Top Ten Stocks Lists
Find Best Stocks In Any Market - Bull or Bear Market
Take A Peek At Our Top Ten Stocks Lists: Daily, Weekly, Year-to-Date & Top Trends
Find Best Stocks In Any Market - Bull or Bear Market
Take A Peek At Our Top Ten Stocks Lists: Daily, Weekly, Year-to-Date & Top Trends
Latin America Stocks With Best Up Trends [0-bearish to 100-bullish]: Aurinia [100], NovaGold Resources[100], City Office[95], Ritchie Bros.[95], SSR Mining[78], Tucows [78], Ivanhoe Electric[78], IMAX [73], D-Wave Quantum[68], Zymeworks [63], SunOpta [56]
Best Latin America Stocks Year-to-Date:
StoneCo [90.34%], D-Wave Quantum[88.45%], SSR Mining[82.76%], XP [51.56%], NovaGold Resources[47.45%], MercadoLibre [39.98%], PagSeguro Digital[38.5%], Ivanhoe Electric[32.45%], Tucows [28.94%], Nu [26.16%], Ritchie Bros.[21.93%] Best Latin America Stocks This Week:
D-Wave Quantum[6.89%], IMAX [3.6%], Aurinia [2.73%], NovaGold Resources[2.29%], Nu [1.87%], City Office[1.57%], Ritchie Bros.[1.39%], SSR Mining[0.47%], Zymeworks [0.07%], PagSeguro Digital[-0.23%], MercadoLibre [-0.3%] Best Latin America Stocks Daily:
D-Wave Quantum[6.89%], IMAX [3.6%], Aurinia [2.73%], NovaGold Resources[2.29%], Nu [1.87%], City Office[1.57%], Ritchie Bros.[1.39%], SSR Mining[0.47%], Zymeworks [0.07%], PagSeguro Digital[-0.23%], MercadoLibre [-0.3%]