
 Login Sign Up


| |||||
 |  | ||||

| 12Stocks.com Market Intelligence |
Best Latin America Stocks
|
|
| Quick Read: Top Latin America Stocks By Performances & Trends: Daily, Weekly, Year-to-Date, Market Cap (Size) & Technical Trends | |||
| Best Latin America Views: Quick Browse View, Summary & Slide Show | |||
| 12Stocks.com Latin America Stocks Performances & Trends Daily | |||||||||
|
|  The overall market intelligence score is 66 (0-bearish to 100-bullish) which puts Latin America index in short term neutral to bullish trend. The market intelligence score from previous trading session is 78 and hence a deterioration of trend.
| ||||||||
| Here are the market intelligence trend scores of the most requested Latin America stocks at 12Stocks.com (click stock name for detailed review): | |
| Scroll down this page for most comprehensive review of Latin America stocks by performance, trends, technical analysis, charts, fund plays & more | |


| 12Stocks.com: Top Performing Latin America Index Stocks | ||||||||||||||||||||||||||||||||||||||||||||||||
 The top performing Latin America Index stocks year to date are
Now, more recently, over last week, the top performing Latin America Index stocks on the move are


|
||||||||||||||||||||||||||||||||||||||||||||||||
| 12Stocks.com: Investing in Latin America Index with Stocks | |
|
The following table helps investors and traders sort through current performance and trends (as measured by market intelligence score) of various
stocks in the Latin America Index. Quick View: Move mouse or cursor over stock symbol (ticker) to view short-term technical chart and over stock name to view long term chart. Click on  to add stock symbol to your watchlist and to add stock symbol to your watchlist and  to view watchlist. Click on any ticker or stock name for detailed market intelligence report for that stock. to view watchlist. Click on any ticker or stock name for detailed market intelligence report for that stock. |
12Stocks.com Performance of Stocks in Latin America Index
| Ticker | Stock Name | Watchlist | Category | Recent Price | Market Intelligence Score | Change % | YTD Change% |
| EXK | Endeavour Silver |   | Materials | 3.25 | 100 | 18.80 | 65.23% |
| STKL | SunOpta | | Consumer Staples | 6.26 | 57 | 10.80 | 14.44% |
| TCX | Tucows | | Technology | 19.22 | 93 | 10.65 | -28.81% |
| CRON | Cronos | | Health Care | 2.82 | 95 | 9.30 | 34.93% |
| PAAS | Pan American | | Materials | 20.31 | 100 | 8.99 | 24.34% |
| FSM | Fortuna Silver | | Materials | 5.17 | 100 | 7.38 | 33.81% |
| THTX | Thera | | Health Care | 1.18 | 7 | 6.31 | -27.16% |
| AG | First Majestic | | Materials | 7.52 | 95 | 5.77 | 22.28% |
| VMAR | Vision Marine | | Services & Goods | 0.70 | 64 | 5.60 | -35.39% |
| LEV | Lion Electric | | Industrials | 1.02 | 54 | 5.37 | -42.54% |
| SVM | Silvercorp Metals | | Materials | 3.54 | 83 | 5.21 | 34.41% |
| BTG | B2Gold | | Materials | 2.75 | 100 | 5.17 | -13.13% |
| NTR | Nutrien | | Materials | 58.01 | 100 | 4.65 | 2.98% |
| INTR | Inter & Co | | Financials | 5.71 | 90 | 4.58 | 1.87% |
| BLDP | Ballard Power | | Industrials | 3.01 | 74 | 4.51 | -18.65% |
| CGC | Canopy Growth | | Health Care | 9.44 | 60 | 4.42 | 84.74% |
| KGC | Kinross Gold | | Materials | 7.39 | 100 | 4.15 | 22.23% |
| NGD | New Gold | | Materials | 1.95 | 100 | 4.01 | 33.22% |
| SILV | SilverCrest Metals | | Materials | 8.60 | 95 | 3.86 | 31.30% |
| MFC | Manulife Financial | | Financials | 25.38 | 100 | 3.72 | 14.84% |
| ACB | Aurora Cannabis | | Health Care | 6.63 | 70 | 3.35 | NA |
| TECK | Teck Resources | | Materials | 51.21 | 95 | 3.27 | 21.15% |
| LVRO | Lavoro | | Materials | 5.98 | 57 | 3.10 | -32.66% |
| CCJ | Cameco | | Materials | 52.05 | 100 | 2.95 | 20.77% |
| HBM | Hudbay Minerals | | Materials | 8.69 | 95 | 2.90 | 57.34% |
| To view more stocks, click on Next / Previous arrows or select different range: 0 - 25 , 25 - 50 , 50 - 75 , 75 - 100 , 100 - 125 , 125 - 150 , 150 - 175 , 175 - 200 | ||
 | Click To Change The Sort Order: By Market Cap or Company Size Performance: Year-to-date, Week and Day |  |
| Detailed Overview Of Latin America Stocks |
| Latin America Technical Overview, Leaders & Laggards, Top Latin America ETF Funds & Detailed Latin America Stocks List, Charts, Trends & More |
| Latin America: Technical Analysis, Trends & YTD Performance | |
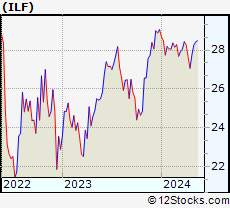
 ILF Weekly Chart |
|
| Long Term Trend: Good | |
| Medium Term Trend: Very Good | |
 ILF Daily Chart |
|
| Short Term Trend: Not Good | |
| Overall Trend Score: 66 | |
| YTD Performance: -2.39% | |
| **Trend Scores & Views Are Only For Educational Purposes And Not For Investing | |
| 12Stocks.com: Investing in Latin America Index using Exchange Traded Funds | |
|
The following table shows list of key exchange traded funds (ETF) that
help investors play Latin America stock market. For detailed view, check out our ETF Funds section of our website. Quick View: Move mouse or cursor over ETF symbol (ticker) to view short-term technical chart and over ETF name to view long term chart. Click on ticker or stock name for detailed view. Click on to add stock symbol to your watchlist and to view watchlist. |
12Stocks.com List of ETFs that track Latin America Index
| Ticker | ETF Name | Watchlist | Recent Price | Market Intelligence Score | Change % | Week % | Year-to-date % |
| ILF | Latin America 40 | | 28.36 | 66 | -0.82 | 0.37 | -2.39% |
| EWC | Canada | | 38.31 | 93 | 1.08 | 1.97 | 4.44% |
| FLN | Latin America AlphaDEX | | 20.14 | 44 | 0.20 | 0.3 | -3.13% |
| EWZ | Brazil | | 31.69 | 32 | -2.19 | -1.92 | -9.35% |
| EWW | Mexico | | 67.73 | 83 | 1.00 | 1.39 | -0.18% |
| ARGT | Argentina | | 63.13 | 76 | -0.99 | 2.93 | 22.96% |
| EWZS | Brazil Small-Cap | | 13.37 | 22 | -3.15 | -3.92 | -11.25% |
| BRF | Brazil Small-Cap | | 15.21 | 22 | -3.37 | -4.46 | -13.52% |
| BZQ | Short Brazil | | 12.04 | 68 | 5.24 | 4.88 | 20.04% |
| BRZU | Brazil Bull 3X | | 80.45 | 32 | -5.14 | -4.71 | -21.8% |
| FBZ | Brazil AlphaDEX | | 11.78 | 50 | 0.04 | -0.59 | -3.61% |
| 12Stocks.com: Charts, Trends, Fundamental Data and Performances of Latin America Stocks | |
|
We now take in-depth look at all Latin America stocks including charts, multi-period performances and overall trends (as measured by market intelligence score). One can sort Latin America stocks (click link to choose) by Daily, Weekly and by Year-to-Date performances. Also, one can sort by size of the company or by market capitalization. |
| Select Your Default Chart Type: | |||||
| |||||
| Click on stock symbol or name for detailed view. Click on to add stock symbol to your watchlist and to view watchlist. Quick View: Move mouse or cursor over "Daily" to quickly view daily technical stock chart and over "Weekly" to view weekly technical stock chart. | |||||

 | EXK Endeavour Silver Corp. |
| Sector: Materials | |
| SubSector: Silver | |
| MarketCap: 204.456 Millions | |
| Recent Price: 3.25 Market Intelligence Score: 100 | |
| Day Percent Change: 18.80% Day Change: 0.51 | |
| Week Change: 22.83% Year-to-date Change: 65.2% | |
| EXK Links: Profile News Message Board | |
| Charts:- Daily , Weekly | |
| Add EXK to Watchlist: View: Get Complete EXK Trend Analysis ➞ | |
 | STKL SunOpta Inc. |
| Sector: Consumer Staples | |
| SubSector: Processed & Packaged Goods | |
| MarketCap: 174.548 Millions | |
| Recent Price: 6.26 Market Intelligence Score: 57 | |
| Day Percent Change: 10.80% Day Change: 0.61 | |
| Week Change: 11.69% Year-to-date Change: 14.4% | |
| STKL Links: Profile News Message Board | |
| Charts:- Daily , Weekly | |
| Add STKL to Watchlist: View: Get Complete STKL Trend Analysis ➞ | |
 | TCX Tucows Inc. |
| Sector: Technology | |
| SubSector: Internet Information Providers | |
| MarketCap: 557.78 Millions | |
| Recent Price: 19.22 Market Intelligence Score: 93 | |
| Day Percent Change: 10.65% Day Change: 1.85 | |
| Week Change: 4.86% Year-to-date Change: -28.8% | |
| TCX Links: Profile News Message Board | |
| Charts:- Daily , Weekly | |
| Add TCX to Watchlist: View: Get Complete TCX Trend Analysis ➞ | |
 | CRON Cronos Group Inc. |
| Sector: Health Care | |
| SubSector: Biotechnology | |
| MarketCap: 1935.95 Millions | |
| Recent Price: 2.82 Market Intelligence Score: 95 | |
| Day Percent Change: 9.30% Day Change: 0.24 | |
| Week Change: 5.22% Year-to-date Change: 34.9% | |
| CRON Links: Profile News Message Board | |
| Charts:- Daily , Weekly | |
| Add CRON to Watchlist: View: Get Complete CRON Trend Analysis ➞ | |
 | PAAS Pan American Silver Corp. |
| Sector: Materials | |
| SubSector: Silver | |
| MarketCap: 2832.56 Millions | |
| Recent Price: 20.31 Market Intelligence Score: 100 | |
| Day Percent Change: 8.99% Day Change: 1.68 | |
| Week Change: 11.26% Year-to-date Change: 24.3% | |
| PAAS Links: Profile News Message Board | |
| Charts:- Daily , Weekly | |
| Add PAAS to Watchlist: View: Get Complete PAAS Trend Analysis ➞ | |
 | FSM Fortuna Silver Mines Inc. |
| Sector: Materials | |
| SubSector: Silver | |
| MarketCap: 362.256 Millions | |
| Recent Price: 5.17 Market Intelligence Score: 100 | |
| Day Percent Change: 7.38% Day Change: 0.36 | |
| Week Change: 12.53% Year-to-date Change: 33.8% | |
| FSM Links: Profile News Message Board | |
| Charts:- Daily , Weekly | |
| Add FSM to Watchlist: View: Get Complete FSM Trend Analysis ➞ | |
 | THTX Theratechnologies Inc. |
| Sector: Health Care | |
| SubSector: Drugs - Generic | |
| MarketCap: 123.185 Millions | |
| Recent Price: 1.18 Market Intelligence Score: 7 | |
| Day Percent Change: 6.31% Day Change: 0.07 | |
| Week Change: -7.81% Year-to-date Change: -27.2% | |
| THTX Links: Profile News Message Board | |
| Charts:- Daily , Weekly | |
| Add THTX to Watchlist: View: Get Complete THTX Trend Analysis ➞ | |
 | AG First Majestic Silver Corp. |
| Sector: Materials | |
| SubSector: Silver | |
| MarketCap: 1128.56 Millions | |
| Recent Price: 7.52 Market Intelligence Score: 95 | |
| Day Percent Change: 5.77% Day Change: 0.41 | |
| Week Change: 12.24% Year-to-date Change: 22.3% | |
| AG Links: Profile News Message Board | |
| Charts:- Daily , Weekly | |
| Add AG to Watchlist: View: Get Complete AG Trend Analysis ➞ | |
 | VMAR Vision Marine Technologies Inc. |
| Sector: Services & Goods | |
| SubSector: Leisure | |
| MarketCap: 99027 Millions | |
| Recent Price: 0.70 Market Intelligence Score: 64 | |
| Day Percent Change: 5.60% Day Change: 0.04 | |
| Week Change: 14.54% Year-to-date Change: -35.4% | |
| VMAR Links: Profile News Message Board | |
| Charts:- Daily , Weekly | |
| Add VMAR to Watchlist: View: Get Complete VMAR Trend Analysis ➞ | |
 | LEV The Lion Electric Company |
| Sector: Industrials | |
| SubSector: Farm & Heavy Construction Machinery | |
| MarketCap: 414 Millions | |
| Recent Price: 1.02 Market Intelligence Score: 54 | |
| Day Percent Change: 5.37% Day Change: 0.05 | |
| Week Change: 0.99% Year-to-date Change: -42.5% | |
| LEV Links: Profile News Message Board | |
| Charts:- Daily , Weekly | |
| Add LEV to Watchlist: View: Get Complete LEV Trend Analysis ➞ | |
 | SVM Silvercorp Metals Inc. |
| Sector: Materials | |
| SubSector: Silver | |
| MarketCap: 504.056 Millions | |
| Recent Price: 3.54 Market Intelligence Score: 83 | |
| Day Percent Change: 5.21% Day Change: 0.18 | |
| Week Change: 7.12% Year-to-date Change: 34.4% | |
| SVM Links: Profile News Message Board | |
| Charts:- Daily , Weekly | |
| Add SVM to Watchlist: View: Get Complete SVM Trend Analysis ➞ | |
 | BTG B2Gold Corp. |
| Sector: Materials | |
| SubSector: Gold | |
| MarketCap: 2792.39 Millions | |
| Recent Price: 2.75 Market Intelligence Score: 100 | |
| Day Percent Change: 5.17% Day Change: 0.14 | |
| Week Change: 9.8% Year-to-date Change: -13.1% | |
| BTG Links: Profile News Message Board | |
| Charts:- Daily , Weekly | |
| Add BTG to Watchlist: View: Get Complete BTG Trend Analysis ➞ | |
 | NTR Nutrien Ltd. |
| Sector: Materials | |
| SubSector: Agricultural Chemicals | |
| MarketCap: 15897.9 Millions | |
| Recent Price: 58.01 Market Intelligence Score: 100 | |
| Day Percent Change: 4.65% Day Change: 2.58 | |
| Week Change: 9.6% Year-to-date Change: 3.0% | |
| NTR Links: Profile News Message Board | |
| Charts:- Daily , Weekly | |
| Add NTR to Watchlist: View: Get Complete NTR Trend Analysis ➞ | |
 | INTR Inter & Co, Inc. |
| Sector: Financials | |
| SubSector: Banks - Regional | |
| MarketCap: 1250 Millions | |
| Recent Price: 5.71 Market Intelligence Score: 90 | |
| Day Percent Change: 4.58% Day Change: 0.25 | |
| Week Change: 7.43% Year-to-date Change: 1.9% | |
| INTR Links: Profile News Message Board | |
| Charts:- Daily , Weekly | |
| Add INTR to Watchlist: View: Get Complete INTR Trend Analysis ➞ | |
 | BLDP Ballard Power Systems Inc. |
| Sector: Industrials | |
| SubSector: Industrial Electrical Equipment | |
| MarketCap: 2124.79 Millions | |
| Recent Price: 3.01 Market Intelligence Score: 74 | |
| Day Percent Change: 4.51% Day Change: 0.13 | |
| Week Change: 7.12% Year-to-date Change: -18.7% | |
| BLDP Links: Profile News Message Board | |
| Charts:- Daily , Weekly | |
| Add BLDP to Watchlist: View: Get Complete BLDP Trend Analysis ➞ | |
 | CGC Canopy Growth Corporation |
| Sector: Health Care | |
| SubSector: Drug Manufacturers - Other | |
| MarketCap: 4136.33 Millions | |
| Recent Price: 9.44 Market Intelligence Score: 60 | |
| Day Percent Change: 4.42% Day Change: 0.40 | |
| Week Change: -7.81% Year-to-date Change: 84.7% | |
| CGC Links: Profile News Message Board | |
| Charts:- Daily , Weekly | |
| Add CGC to Watchlist: View: Get Complete CGC Trend Analysis ➞ | |
 | KGC Kinross Gold Corporation |
| Sector: Materials | |
| SubSector: Gold | |
| MarketCap: 5389.29 Millions | |
| Recent Price: 7.39 Market Intelligence Score: 100 | |
| Day Percent Change: 4.15% Day Change: 0.29 | |
| Week Change: 12.22% Year-to-date Change: 22.2% | |
| KGC Links: Profile News Message Board | |
| Charts:- Daily , Weekly | |
| Add KGC to Watchlist: View: Get Complete KGC Trend Analysis ➞ | |
 | NGD New Gold Inc. |
| Sector: Materials | |
| SubSector: Gold | |
| MarketCap: 398.119 Millions | |
| Recent Price: 1.95 Market Intelligence Score: 100 | |
| Day Percent Change: 4.01% Day Change: 0.07 | |
| Week Change: 7.46% Year-to-date Change: 33.2% | |
| NGD Links: Profile News Message Board | |
| Charts:- Daily , Weekly | |
| Add NGD to Watchlist: View: Get Complete NGD Trend Analysis ➞ | |
 | SILV SilverCrest Metals Inc. |
| Sector: Materials | |
| SubSector: Silver | |
| MarketCap: 555.356 Millions | |
| Recent Price: 8.60 Market Intelligence Score: 95 | |
| Day Percent Change: 3.86% Day Change: 0.32 | |
| Week Change: 3.49% Year-to-date Change: 31.3% | |
| SILV Links: Profile News Message Board | |
| Charts:- Daily , Weekly | |
| Add SILV to Watchlist: View: Get Complete SILV Trend Analysis ➞ | |
 | MFC Manulife Financial Corporation |
| Sector: Financials | |
| SubSector: Life Insurance | |
| MarketCap: 22188.7 Millions | |
| Recent Price: 25.38 Market Intelligence Score: 100 | |
| Day Percent Change: 3.72% Day Change: 0.91 | |
| Week Change: 5.71% Year-to-date Change: 14.8% | |
| MFC Links: Profile News Message Board | |
| Charts:- Daily , Weekly | |
| Add MFC to Watchlist: View: Get Complete MFC Trend Analysis ➞ | |
 | ACB Aurora Cannabis Inc. |
| Sector: Health Care | |
| SubSector: Drug Manufacturers - Other | |
| MarketCap: 853.333 Millions | |
| Recent Price: 6.63 Market Intelligence Score: 70 | |
| Day Percent Change: 3.35% Day Change: 0.21 | |
| Week Change: -1.56% Year-to-date Change: 1,293.3% | |
| ACB Links: Profile News Message Board | |
| Charts:- Daily , Weekly | |
| Add ACB to Watchlist: View: Get Complete ACB Trend Analysis ➞ | |
 | TGB Taseko Mines Limited |
| Sector: Materials | |
| SubSector: Industrial Metals & Minerals | |
| MarketCap: 55.991 Millions | |
| Recent Price: 2.53 Market Intelligence Score: 90 | |
| Day Percent Change: 3.27% Day Change: 0.08 | |
| Week Change: 4.98% Year-to-date Change: 80.7% | |
| TGB Links: Profile News Message Board | |
| Charts:- Daily , Weekly | |
| Add TGB to Watchlist: View: Get Complete TGB Trend Analysis ➞ | |
 | TECK Teck Resources Limited |
| Sector: Materials | |
| SubSector: Industrial Metals & Minerals | |
| MarketCap: 4347.4 Millions | |
| Recent Price: 51.21 Market Intelligence Score: 95 | |
| Day Percent Change: 3.27% Day Change: 1.62 | |
| Week Change: 3.9% Year-to-date Change: 21.2% | |
| TECK Links: Profile News Message Board | |
| Charts:- Daily , Weekly | |
| Add TECK to Watchlist: View: Get Complete TECK Trend Analysis ➞ | |
 | LVRO Lavoro Limited |
| Sector: Materials | |
| SubSector: Agricultural Inputs | |
| MarketCap: 686 Millions | |
| Recent Price: 5.98 Market Intelligence Score: 57 | |
| Day Percent Change: 3.10% Day Change: 0.18 | |
| Week Change: -0.33% Year-to-date Change: -32.7% | |
| LVRO Links: Profile News Message Board | |
| Charts:- Daily , Weekly | |
| Add LVRO to Watchlist: View: Get Complete LVRO Trend Analysis ➞ | |
 | CCJ Cameco Corporation |
| Sector: Materials | |
| SubSector: Industrial Metals & Minerals | |
| MarketCap: 2722.9 Millions | |
| Recent Price: 52.05 Market Intelligence Score: 100 | |
| Day Percent Change: 2.95% Day Change: 1.49 | |
| Week Change: 7.52% Year-to-date Change: 20.8% | |
| CCJ Links: Profile News Message Board | |
| Charts:- Daily , Weekly | |
| Add CCJ to Watchlist: View: Get Complete CCJ Trend Analysis ➞ | |
| To view more stocks, click on Next / Previous arrows or select different range: 0 - 25 , 25 - 50 , 50 - 75 , 75 - 100 , 100 - 125 , 125 - 150 , 150 - 175 , 175 - 200 | ||
| Click To Change The Sort Order: By Market Cap or Company Size Performance: Year-to-date, Week and Day | |
| Select Chart Type: | ||
 Best Stocks Today 12Stocks.com |
© 2024 12Stocks.com Terms & Conditions Privacy Contact Us
All Information Provided Only For Education And Not To Be Used For Investing or Trading. See Terms & Conditions


One More Thing ... Get Best Stocks Delivered Daily!
Never Ever Miss A Move With Our Top Ten Stocks Lists
Find Best Stocks In Any Market - Bull or Bear Market
Take A Peek At Our Top Ten Stocks Lists: Daily, Weekly, Year-to-Date & Top Trends
Find Best Stocks In Any Market - Bull or Bear Market
Take A Peek At Our Top Ten Stocks Lists: Daily, Weekly, Year-to-Date & Top Trends
Latin America Stocks With Best Up Trends [0-bearish to 100-bullish]: Endeavour Silver[100], Pan American[100], Fortuna Silver[100], B2Gold [100], Nutrien [100], Kinross Gold[100], New Gold[100], Manulife Financial[100], Cameco [100], Ivanhoe Electric[100], Wheaton Precious[100]
Best Latin America Stocks Year-to-Date:
Aurora Cannabis[1293.32%], Fusion [123.18%], Banco Macro[120.28%], Grupo Financiero[103.68%], Banco BBVA[100.37%], Canopy Growth[84.74%], Grupo Supervielle[74.88%], Endeavour Silver[65.23%], Hudbay Minerals[57.34%], IAMGOLD [51.38%], D-Wave Quantum[49.3%] Best Latin America Stocks This Week:
Endeavour Silver[22.83%], Vision Marine[14.54%], Ivanhoe Electric[14.42%], Fortuna Silver[12.53%], First Majestic[12.24%], Kinross Gold[12.22%], SunOpta [11.69%], Pan American[11.26%], BRF S.A[10.51%], Telecom Argentina[10.37%], B2Gold [9.8%] Best Latin America Stocks Daily:
Endeavour Silver[18.80%], SunOpta [10.80%], Tucows [10.65%], Cronos [9.30%], Pan American[8.99%], Fortuna Silver[7.38%], First Majestic[5.77%], Vision Marine[5.60%], Lion Electric[5.37%], Silvercorp Metals[5.21%], B2Gold [5.17%]