
 Login Sign Up


| |||||
 |  | ||||

| 12Stocks.com Market Intelligence |
Best Latin America Stocks
|
|
| Quick Read: Top Latin America Stocks By Performances & Trends: Daily, Weekly, Year-to-Date, Market Cap (Size) & Technical Trends | |||
| Best Latin America Views: Quick Browse View, Summary & Slide Show | |||
| 12Stocks.com Latin America Stocks Performances & Trends Daily | |||||||||
|
|  The overall market intelligence score is 42 (0-bearish to 100-bullish) which puts Latin America index in short term neutral trend. The market intelligence score from previous trading session is 32 and hence an improvement of trend.
| ||||||||
| Here are the market intelligence trend scores of the most requested Latin America stocks at 12Stocks.com (click stock name for detailed review): | |
| Scroll down this page for most comprehensive review of Latin America stocks by performance, trends, technical analysis, charts, fund plays & more | |


| 12Stocks.com: Top Performing Latin America Index Stocks | ||||||||||||||||||||||||||||||||||||||||||||||||
 The top performing Latin America Index stocks year to date are
Now, more recently, over last week, the top performing Latin America Index stocks on the move are


|
||||||||||||||||||||||||||||||||||||||||||||||||
| 12Stocks.com: Investing in Latin America Index with Stocks | |
|
The following table helps investors and traders sort through current performance and trends (as measured by market intelligence score) of various
stocks in the Latin America Index. Quick View: Move mouse or cursor over stock symbol (ticker) to view short-term technical chart and over stock name to view long term chart. Click on  to add stock symbol to your watchlist and to add stock symbol to your watchlist and  to view watchlist. Click on any ticker or stock name for detailed market intelligence report for that stock. to view watchlist. Click on any ticker or stock name for detailed market intelligence report for that stock. |
12Stocks.com Performance of Stocks in Latin America Index
| Ticker | Stock Name | Watchlist | Category | Recent Price | Market Intelligence Score | Change % | YTD Change% |
| BHC | Bausch Health |   | Health Care | 8.53 | 49 | 0.95 | 6.36% |
| FNV | Franco-Nevada | | Materials | 119.32 | 43 | 0.93 | 7.68% |
| MGA | Magna | | Services & Goods | 49.77 | 42 | 0.93 | -15.76% |
| AFYA | Afya | | Services & Goods | 16.43 | 42 | 0.92 | -25.08% |
| BMO | Bank of Montreal | | Financials | 93.82 | 55 | 0.89 | -5.17% |
| EQX | Equinox Gold | | Materials | 5.72 | 36 | 0.88 | 16.97% |
| TU | TELUS | | Technology | 16.21 | 74 | 0.87 | -8.88% |
| APT | Alpha Pro | | Industrials | 6.02 | 44 | 0.84 | 13.80% |
| SBS | Companhia de | | Utilities | 16.14 | 75 | 0.81 | 5.98% |
| CVE | Cenovus Energy | | Energy | 21.27 | 88 | 0.81 | 27.75% |
| LULU | Lululemon Athletica | | Consumer Staples | 364.68 | 64 | 0.80 | -28.67% |
| AUPH | Aurinia | | Health Care | 5.09 | 50 | 0.79 | -43.38% |
| HBM | Hudbay Minerals | | Materials | 7.73 | 58 | 0.78 | 40.04% |
| ASTL | Algoma Steel | | Materials | 7.88 | 35 | 0.77 | -21.04% |
| NOA | North American | | Energy | 21.10 | 42 | 0.76 | 1.20% |
| BBD | Banco Bradesco | | Financials | 2.66 | 42 | 0.76 | -24.00% |
| FSV | FirstService | | Financials | 153.27 | 42 | 0.75 | -5.44% |
| CM | Canadian Imperial | | Financials | 48.02 | 68 | 0.69 | -0.25% |
| RY | Royal Bank | | Financials | 99.85 | 75 | 0.66 | -1.27% |
| MEOH | Methanex | | Materials | 47.95 | 73 | 0.61 | 1.25% |
| TD | Toronto-Dominion Bank | | Financials | 58.92 | 67 | 0.61 | -8.82% |
| ERF | Enerplus | | Energy | 20.27 | 76 | 0.60 | 32.14% |
| CEPU | Central Puerto | | Utilities | 10.27 | 78 | 0.59 | 12.86% |
| VTMX | Vesta Financials | | Financials | 36.46 | 39 | 0.58 | -8.31% |
| RBA | Ritchie Bros. | | Services & Goods | 73.24 | 63 | 0.58 | 9.49% |
| To view more stocks, click on Next / Previous arrows or select different range: 0 - 25 , 25 - 50 , 50 - 75 , 75 - 100 , 100 - 125 , 125 - 150 , 150 - 175 , 175 - 200 , 200 - 225 | ||
 | Click To Change The Sort Order: By Market Cap or Company Size Performance: Year-to-date, Week and Day |  |
| Detailed Overview Of Latin America Stocks |
| Latin America Technical Overview, Leaders & Laggards, Top Latin America ETF Funds & Detailed Latin America Stocks List, Charts, Trends & More |
| Latin America: Technical Analysis, Trends & YTD Performance | |
 ILF Weekly Chart |
|
| Long Term Trend: Not Good | |
| Medium Term Trend: Not Good | |
 ILF Daily Chart |
|
| Short Term Trend: Very Good | |
| Overall Trend Score: 42 | |
| YTD Performance: -5.4% | |
| **Trend Scores & Views Are Only For Educational Purposes And Not For Investing | |
| 12Stocks.com: Investing in Latin America Index using Exchange Traded Funds | |
|
The following table shows list of key exchange traded funds (ETF) that
help investors play Latin America stock market. For detailed view, check out our ETF Funds section of our website. Quick View: Move mouse or cursor over ETF symbol (ticker) to view short-term technical chart and over ETF name to view long term chart. Click on ticker or stock name for detailed view. Click on to add stock symbol to your watchlist and to view watchlist. |
12Stocks.com List of ETFs that track Latin America Index
| Ticker | ETF Name | Watchlist | Recent Price | Market Intelligence Score | Change % | Week % | Year-to-date % |
| ILF | Latin America 40 | | 27.49 | 42 | 0.70 | 1.55 | -5.4% |
| EWC | Canada | | 37.70 | 75 | 0.91 | 1.59 | 2.78% |
| FLN | Latin America AlphaDEX | | 19.66 | 45 | 1.21 | 2.32 | -5.41% |
| EWZ | Brazil | | 31.16 | 49 | 0.48 | 1.37 | -10.87% |
| EWW | Mexico | | 66.49 | 45 | 1.36 | 2.47 | -2% |
| ARGT | Argentina | | 55.84 | 93 | 0.09 | 4.43 | 8.77% |
| EWZS | Brazil Small-Cap | | 13.27 | 39 | 0.61 | 2.08 | -11.89% |
| BRF | Brazil Small-Cap | | 15.09 | 32 | 0.67 | 1.55 | -14.2% |
| BZQ | Short Brazil | | 12.39 | 56 | -1.17 | -2.73 | 23.48% |
| BRZU | Brazil Bull 3X | | 78.98 | 49 | 1.09 | 2.84 | -23.23% |
| FBZ | Brazil AlphaDEX | | 11.35 | 32 | 0.27 | 0.98 | -7.13% |
| 12Stocks.com: Charts, Trends, Fundamental Data and Performances of Latin America Stocks | |
|
We now take in-depth look at all Latin America stocks including charts, multi-period performances and overall trends (as measured by market intelligence score). One can sort Latin America stocks (click link to choose) by Daily, Weekly and by Year-to-Date performances. Also, one can sort by size of the company or by market capitalization. |
| Select Your Default Chart Type: | |||||
| |||||
| Click on stock symbol or name for detailed view. Click on to add stock symbol to your watchlist and to view watchlist. Quick View: Move mouse or cursor over "Daily" to quickly view daily technical stock chart and over "Weekly" to view weekly technical stock chart. | |||||

 | BHC Bausch Health Companies Inc. |
| Sector: Health Care | |
| SubSector: Drug Delivery | |
| MarketCap: 5485.3 Millions | |
| Recent Price: 8.53 Market Intelligence Score: 49 | |
| Day Percent Change: 0.95% Day Change: 0.08 | |
| Week Change: -1.84% Year-to-date Change: 6.4% | |
| BHC Links: Profile News Message Board | |
| Charts:- Daily , Weekly | |
| Add BHC to Watchlist: View: Get Complete BHC Trend Analysis ➞ | |
 | FNV Franco-Nevada Corporation |
| Sector: Materials | |
| SubSector: Gold | |
| MarketCap: 17703.9 Millions | |
| Recent Price: 119.32 Market Intelligence Score: 43 | |
| Day Percent Change: 0.93% Day Change: 1.10 | |
| Week Change: -1.77% Year-to-date Change: 7.7% | |
| FNV Links: Profile News Message Board | |
| Charts:- Daily , Weekly | |
| Add FNV to Watchlist: View: Get Complete FNV Trend Analysis ➞ | |
 | MGA Magna International Inc. |
| Sector: Services & Goods | |
| SubSector: Auto Parts Wholesale | |
| MarketCap: 8967.3 Millions | |
| Recent Price: 49.77 Market Intelligence Score: 42 | |
| Day Percent Change: 0.93% Day Change: 0.46 | |
| Week Change: 2.96% Year-to-date Change: -15.8% | |
| MGA Links: Profile News Message Board | |
| Charts:- Daily , Weekly | |
| Add MGA to Watchlist: View: Get Complete MGA Trend Analysis ➞ | |
 | AFYA Afya Limited |
| Sector: Services & Goods | |
| SubSector: Education & Training Services | |
| MarketCap: 1559.26 Millions | |
| Recent Price: 16.43 Market Intelligence Score: 42 | |
| Day Percent Change: 0.92% Day Change: 0.15 | |
| Week Change: 2.69% Year-to-date Change: -25.1% | |
| AFYA Links: Profile News Message Board | |
| Charts:- Daily , Weekly | |
| Add AFYA to Watchlist: View: Get Complete AFYA Trend Analysis ➞ | |
 | BMO Bank of Montreal |
| Sector: Financials | |
| SubSector: Money Center Banks | |
| MarketCap: 32830.2 Millions | |
| Recent Price: 93.82 Market Intelligence Score: 55 | |
| Day Percent Change: 0.89% Day Change: 0.83 | |
| Week Change: 1.82% Year-to-date Change: -5.2% | |
| BMO Links: Profile News Message Board | |
| Charts:- Daily , Weekly | |
| Add BMO to Watchlist: View: Get Complete BMO Trend Analysis ➞ | |
 | EQX Equinox Gold Corp. |
| Sector: Materials | |
| SubSector: Gold | |
| MarketCap: 706.119 Millions | |
| Recent Price: 5.72 Market Intelligence Score: 36 | |
| Day Percent Change: 0.88% Day Change: 0.05 | |
| Week Change: -4.67% Year-to-date Change: 17.0% | |
| EQX Links: Profile News Message Board | |
| Charts:- Daily , Weekly | |
| Add EQX to Watchlist: View: Get Complete EQX Trend Analysis ➞ | |
 | TU TELUS Corporation |
| Sector: Technology | |
| SubSector: Wireless Communications | |
| MarketCap: 10864.7 Millions | |
| Recent Price: 16.21 Market Intelligence Score: 74 | |
| Day Percent Change: 0.87% Day Change: 0.14 | |
| Week Change: 1.82% Year-to-date Change: -8.9% | |
| TU Links: Profile News Message Board | |
| Charts:- Daily , Weekly | |
| Add TU to Watchlist: View: Get Complete TU Trend Analysis ➞ | |
 | APT Alpha Pro Tech, Ltd. |
| Sector: Industrials | |
| SubSector: General Building Materials | |
| MarketCap: 125.953 Millions | |
| Recent Price: 6.02 Market Intelligence Score: 44 | |
| Day Percent Change: 0.84% Day Change: 0.05 | |
| Week Change: -2.27% Year-to-date Change: 13.8% | |
| APT Links: Profile News Message Board | |
| Charts:- Daily , Weekly | |
| Add APT to Watchlist: View: Get Complete APT Trend Analysis ➞ | |
 | SBS Companhia de Saneamento Basico do Estado de Sao Paulo - SABESP |
| Sector: Utilities | |
| SubSector: Water Utilities | |
| MarketCap: 5498.72 Millions | |
| Recent Price: 16.14 Market Intelligence Score: 75 | |
| Day Percent Change: 0.81% Day Change: 0.13 | |
| Week Change: 4.2% Year-to-date Change: 6.0% | |
| SBS Links: Profile News Message Board | |
| Charts:- Daily , Weekly | |
| Add SBS to Watchlist: View: Get Complete SBS Trend Analysis ➞ | |
 | CVE Cenovus Energy Inc. |
| Sector: Energy | |
| SubSector: Oil & Gas Drilling & Exploration | |
| MarketCap: 2369.29 Millions | |
| Recent Price: 21.27 Market Intelligence Score: 88 | |
| Day Percent Change: 0.81% Day Change: 0.17 | |
| Week Change: 2.01% Year-to-date Change: 27.8% | |
| CVE Links: Profile News Message Board | |
| Charts:- Daily , Weekly | |
| Add CVE to Watchlist: View: Get Complete CVE Trend Analysis ➞ | |
 | LULU Lululemon Athletica Inc. |
| Sector: Consumer Staples | |
| SubSector: Textile - Apparel Clothing | |
| MarketCap: 24627.8 Millions | |
| Recent Price: 364.68 Market Intelligence Score: 64 | |
| Day Percent Change: 0.80% Day Change: 2.89 | |
| Week Change: 3.46% Year-to-date Change: -28.7% | |
| LULU Links: Profile News Message Board | |
| Charts:- Daily , Weekly | |
| Add LULU to Watchlist: View: Get Complete LULU Trend Analysis ➞ | |
 | AUPH Aurinia Pharmaceuticals Inc. |
| Sector: Health Care | |
| SubSector: Biotechnology | |
| MarketCap: 1319.75 Millions | |
| Recent Price: 5.09 Market Intelligence Score: 50 | |
| Day Percent Change: 0.79% Day Change: 0.04 | |
| Week Change: 2% Year-to-date Change: -43.4% | |
| AUPH Links: Profile News Message Board | |
| Charts:- Daily , Weekly | |
| Add AUPH to Watchlist: View: Get Complete AUPH Trend Analysis ➞ | |
 | HBM Hudbay Minerals Inc. |
| Sector: Materials | |
| SubSector: Copper | |
| MarketCap: 363.157 Millions | |
| Recent Price: 7.73 Market Intelligence Score: 58 | |
| Day Percent Change: 0.78% Day Change: 0.06 | |
| Week Change: -0.77% Year-to-date Change: 40.0% | |
| HBM Links: Profile News Message Board | |
| Charts:- Daily , Weekly | |
| Add HBM to Watchlist: View: Get Complete HBM Trend Analysis ➞ | |
 | ASTL Algoma Steel Group Inc. |
| Sector: Materials | |
| SubSector: Steel | |
| MarketCap: 731 Millions | |
| Recent Price: 7.88 Market Intelligence Score: 35 | |
| Day Percent Change: 0.77% Day Change: 0.06 | |
| Week Change: 1.03% Year-to-date Change: -21.0% | |
| ASTL Links: Profile News Message Board | |
| Charts:- Daily , Weekly | |
| Add ASTL to Watchlist: View: Get Complete ASTL Trend Analysis ➞ | |
 | NOA North American Construction Group Ltd. |
| Sector: Energy | |
| SubSector: Oil & Gas Equipment & Services | |
| MarketCap: 160.461 Millions | |
| Recent Price: 21.10 Market Intelligence Score: 42 | |
| Day Percent Change: 0.76% Day Change: 0.16 | |
| Week Change: 2.73% Year-to-date Change: 1.2% | |
| NOA Links: Profile News Message Board | |
| Charts:- Daily , Weekly | |
| Add NOA to Watchlist: View: Get Complete NOA Trend Analysis ➞ | |
 | BBD Banco Bradesco S.A. |
| Sector: Financials | |
| SubSector: Foreign Regional Banks | |
| MarketCap: 30281.7 Millions | |
| Recent Price: 2.66 Market Intelligence Score: 42 | |
| Day Percent Change: 0.76% Day Change: 0.02 | |
| Week Change: 0.76% Year-to-date Change: -24.0% | |
| BBD Links: Profile News Message Board | |
| Charts:- Daily , Weekly | |
| Add BBD to Watchlist: View: Get Complete BBD Trend Analysis ➞ | |
 | FSV FirstService Corporation |
| Sector: Financials | |
| SubSector: Property Management | |
| MarketCap: 2793.92 Millions | |
| Recent Price: 153.27 Market Intelligence Score: 42 | |
| Day Percent Change: 0.75% Day Change: 1.14 | |
| Week Change: 2.58% Year-to-date Change: -5.4% | |
| FSV Links: Profile News Message Board | |
| Charts:- Daily , Weekly | |
| Add FSV to Watchlist: View: Get Complete FSV Trend Analysis ➞ | |
 | CM Canadian Imperial Bank of Commerce |
| Sector: Financials | |
| SubSector: Money Center Banks | |
| MarketCap: 27150.5 Millions | |
| Recent Price: 48.02 Market Intelligence Score: 68 | |
| Day Percent Change: 0.69% Day Change: 0.33 | |
| Week Change: 0.95% Year-to-date Change: -0.3% | |
| CM Links: Profile News Message Board | |
| Charts:- Daily , Weekly | |
| Add CM to Watchlist: View: Get Complete CM Trend Analysis ➞ | |
 | RY Royal Bank of Canada |
| Sector: Financials | |
| SubSector: Money Center Banks | |
| MarketCap: 87565.4 Millions | |
| Recent Price: 99.85 Market Intelligence Score: 75 | |
| Day Percent Change: 0.66% Day Change: 0.65 | |
| Week Change: 2.03% Year-to-date Change: -1.3% | |
| RY Links: Profile News Message Board | |
| Charts:- Daily , Weekly | |
| Add RY to Watchlist: View: Get Complete RY Trend Analysis ➞ | |
 | MEOH Methanex Corporation |
| Sector: Materials | |
| SubSector: Specialty Chemicals | |
| MarketCap: 894.357 Millions | |
| Recent Price: 47.95 Market Intelligence Score: 73 | |
| Day Percent Change: 0.61% Day Change: 0.29 | |
| Week Change: 0.08% Year-to-date Change: 1.3% | |
| MEOH Links: Profile News Message Board | |
| Charts:- Daily , Weekly | |
| Add MEOH to Watchlist: View: Get Complete MEOH Trend Analysis ➞ | |
 | TD The Toronto-Dominion Bank |
| Sector: Financials | |
| SubSector: Money Center Banks | |
| MarketCap: 75152.4 Millions | |
| Recent Price: 58.92 Market Intelligence Score: 67 | |
| Day Percent Change: 0.61% Day Change: 0.36 | |
| Week Change: 1.43% Year-to-date Change: -8.8% | |
| TD Links: Profile News Message Board | |
| Charts:- Daily , Weekly | |
| Add TD to Watchlist: View: Get Complete TD Trend Analysis ➞ | |
 | ERF Enerplus Corporation |
| Sector: Energy | |
| SubSector: Oil & Gas Drilling & Exploration | |
| MarketCap: 372.639 Millions | |
| Recent Price: 20.27 Market Intelligence Score: 76 | |
| Day Percent Change: 0.60% Day Change: 0.12 | |
| Week Change: 1.71% Year-to-date Change: 32.1% | |
| ERF Links: Profile News Message Board | |
| Charts:- Daily , Weekly | |
| Add ERF to Watchlist: View: Get Complete ERF Trend Analysis ➞ | |
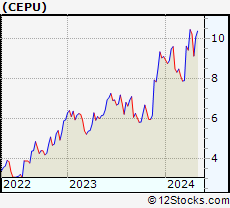 | CEPU Central Puerto S.A. |
| Sector: Utilities | |
| SubSector: Electric Utilities | |
| MarketCap: 340.114 Millions | |
| Recent Price: 10.27 Market Intelligence Score: 78 | |
| Day Percent Change: 0.59% Day Change: 0.06 | |
| Week Change: 12.49% Year-to-date Change: 12.9% | |
| CEPU Links: Profile News Message Board | |
| Charts:- Daily , Weekly | |
| Add CEPU to Watchlist: View: Get Complete CEPU Trend Analysis ➞ | |
 | VTMX Vesta Financials Corp SAB de CV |
| Sector: Financials | |
| SubSector: REIT - Industrial | |
| MarketCap: 2270 Millions | |
| Recent Price: 36.46 Market Intelligence Score: 39 | |
| Day Percent Change: 0.58% Day Change: 0.21 | |
| Week Change: 3.46% Year-to-date Change: -8.3% | |
| VTMX Links: Profile News Message Board | |
| Charts:- Daily , Weekly | |
| Add VTMX to Watchlist: View: Get Complete VTMX Trend Analysis ➞ | |
 | RBA Ritchie Bros. Auctioneers Incorporated |
| Sector: Services & Goods | |
| SubSector: Business Services | |
| MarketCap: 3491.02 Millions | |
| Recent Price: 73.24 Market Intelligence Score: 63 | |
| Day Percent Change: 0.58% Day Change: 0.42 | |
| Week Change: 0.87% Year-to-date Change: 9.5% | |
| RBA Links: Profile News Message Board | |
| Charts:- Daily , Weekly | |
| Add RBA to Watchlist: View: Get Complete RBA Trend Analysis ➞ | |
| To view more stocks, click on Next / Previous arrows or select different range: 0 - 25 , 25 - 50 , 50 - 75 , 75 - 100 , 100 - 125 , 125 - 150 , 150 - 175 , 175 - 200 , 200 - 225 | ||
| Click To Change The Sort Order: By Market Cap or Company Size Performance: Year-to-date, Week and Day | |
| Select Chart Type: | ||
 Best Stocks Today 12Stocks.com |
© 2024 12Stocks.com Terms & Conditions Privacy Contact Us
All Information Provided Only For Education And Not To Be Used For Investing or Trading. See Terms & Conditions


One More Thing ... Get Best Stocks Delivered Daily!
Never Ever Miss A Move With Our Top Ten Stocks Lists
Find Best Stocks In Any Market - Bull or Bear Market
Take A Peek At Our Top Ten Stocks Lists: Daily, Weekly, Year-to-Date & Top Trends
Find Best Stocks In Any Market - Bull or Bear Market
Take A Peek At Our Top Ten Stocks Lists: Daily, Weekly, Year-to-Date & Top Trends
Latin America Stocks With Best Up Trends [0-bearish to 100-bullish]: Grupo Aeroportuario[100], Grupo Aeroportuario[100], Controladora Vuela[100], BRF S.A[100], Descartes Systems[100], IMAX [100], IRSA Inversiones[100], Aurora Cannabis[95], Banco BBVA[95], Grupo Financiero[95], Grupo Supervielle[95]
Best Latin America Stocks Year-to-Date:
Aurora Cannabis[1458.17%], Fusion [123.13%], Banco Macro[81.43%], Grupo Financiero[76.83%], Canopy Growth[76.71%], D-Wave Quantum[76.66%], Banco BBVA[72.79%], McEwen Mining[54.09%], Grupo Supervielle[49.75%], Celestica [49.45%], OrganiGram [48.85%] Best Latin America Stocks This Week:
Aurora Cannabis[14.86%], Grupo Aeroportuario[14.29%], Canopy Growth[13.73%], Central Puerto[12.49%], Repare [11.26%], Grupo Supervielle[10.55%], SunOpta [9.9%], Grupo Aeroportuario[9.79%], Banco BBVA[9.68%], Controladora Vuela[8.72%], Grupo Aeroportuario[8.7%] Best Latin America Stocks Daily:
Aurora Cannabis[18.15%], Canopy Growth[15.03%], Grupo Aeroportuario[11.24%], Grupo Aeroportuario[7.33%], Grupo Aeroportuario[7.24%], Tilray [6.98%], IAMGOLD [6.30%], Endeavour Silver[6.25%], Controladora Vuela[5.74%], New Found[5.26%], Shopify [4.90%]