
 Login Sign Up


| |||||
 |  | ||||

| 12Stocks.com Market Intelligence |
Best Latin America Stocks
|
|
| Quick Read: Top Latin America Stocks By Performances & Trends: Daily, Weekly, Year-to-Date, Market Cap (Size) & Technical Trends | |||
| Best Latin America Views: Quick Browse View, Summary & Slide Show | |||
| 12Stocks.com Latin America Stocks Performances & Trends Daily | |||||||||
|
|  The overall market intelligence score is 35 (0-bearish to 100-bullish) which puts Latin America index in short term bearish to neutral trend. The market intelligence score from previous trading session is 25 and hence an improvement of trend.
| ||||||||
| Here are the market intelligence trend scores of the most requested Latin America stocks at 12Stocks.com (click stock name for detailed review): | |
| Scroll down this page for most comprehensive review of Latin America stocks by performance, trends, technical analysis, charts, fund plays & more | |


| 12Stocks.com: Top Performing Latin America Index Stocks | ||||||||||||||||||||||||||||||||||||||||||||||||
 The top performing Latin America Index stocks year to date are
Now, more recently, over last week, the top performing Latin America Index stocks on the move are


|
||||||||||||||||||||||||||||||||||||||||||||||||
| 12Stocks.com: Investing in Latin America Index with Stocks | |
|
The following table helps investors and traders sort through current performance and trends (as measured by market intelligence score) of various
stocks in the Latin America Index. Quick View: Move mouse or cursor over stock symbol (ticker) to view short-term technical chart and over stock name to view long term chart. Click on  to add stock symbol to your watchlist and to add stock symbol to your watchlist and  to view watchlist. Click on any ticker or stock name for detailed market intelligence report for that stock. to view watchlist. Click on any ticker or stock name for detailed market intelligence report for that stock. |
12Stocks.com Performance of Stocks in Latin America Index
| Ticker | Stock Name | Watchlist | Category | Recent Price | Market Intelligence Score | Change % | YTD Change% |
| SBS | Companhia de |   | Utilities | 15.63 | 0 | 0.00 | 2.63% |
| NFGC | New Found | | Materials | 3.56 | 36 | 0.00 | 1.14% |
| VMAR | Vision Marine | | Services & Goods | 0.61 | 54 | 0.00 | -43.78% |
| VSTA | Vasta Platform | | Consumer Staples | 3.80 | 20 | 0.00 | -13.64% |
| EDSA | Edesa Biotech | | Health Care | 4.44 | 28 | 0.00 | -4.25% |
| BAM | Brookfield Asset | | Financials | 38.19 | 0 | 0.00 | -4.93% |
| FUSN | Fusion | | Health Care | 21.42 | 63 | -0.05 | 123.13% |
| RCI | Rogers | | Technology | 37.44 | 28 | -0.08 | -20.02% |
| DOOO | BRP | | Consumer Staples | 67.20 | 46 | -0.10 | -6.26% |
| BHC | Bausch Health | | Health Care | 8.75 | 17 | -0.11 | 9.10% |
| MELI | MercadoLibre | | Services & Goods | 1456.99 | 64 | -0.12 | -7.29% |
| GFL | GFL Environmental | | Industrials | 31.86 | 18 | -0.13 | -7.68% |
| PBR | Petroleo Brasileiro | | Energy | 16.94 | 71 | -0.18 | 6.07% |
| GIL | Gildan Activewear | | Consumer Staples | 34.59 | 23 | -0.20 | 4.63% |
| GGAL | Grupo Financiero | | Financials | 32.36 | 100 | -0.22 | 87.43% |
| RBA | Ritchie Bros. | | Services & Goods | 71.37 | 0 | -0.29 | 6.70% |
| TRP | TC Energy | | Energy | 35.73 | 42 | -0.33 | -8.60% |
| MGA | Magna | | Services & Goods | 47.64 | 10 | -0.33 | -19.36% |
| PAC | Grupo Aeroportuario | | Transports | 181.21 | 76 | -0.34 | 3.42% |
| TV | Grupo Televisa | | Services & Goods | 2.91 | 10 | -0.34 | -12.87% |
| FSV | FirstService | | Financials | 146.49 | 10 | -0.35 | -9.63% |
| CNI | Canadian National | | Transports | 121.01 | 0 | -0.35 | -3.68% |
| CX | CEMEX S.A.B. | | Industrials | 7.88 | 36 | -0.38 | 1.68% |
| TFII | TFI | | Transports | 129.75 | 10 | -0.41 | -4.58% |
| IRS | IRSA Inversiones | | Financials | 9.46 | 83 | -0.42 | 10.00% |
| To view more stocks, click on Next / Previous arrows or select different range: 0 - 25 , 25 - 50 , 50 - 75 , 75 - 100 , 100 - 125 , 125 - 150 , 150 - 175 , 175 - 200 , 200 - 225 | ||
 | Click To Change The Sort Order: By Market Cap or Company Size Performance: Year-to-date, Week and Day |  |
| Detailed Overview Of Latin America Stocks |
| Latin America Technical Overview, Leaders & Laggards, Top Latin America ETF Funds & Detailed Latin America Stocks List, Charts, Trends & More |
| Latin America: Technical Analysis, Trends & YTD Performance | |
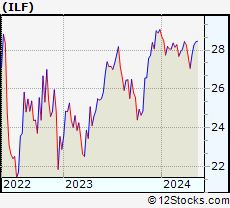
 ILF Weekly Chart |
|
| Long Term Trend: Not Good | |
| Medium Term Trend: Very Good | |
 ILF Daily Chart |
|
| Short Term Trend: Deteriorating | |
| Overall Trend Score: 35 | |
| YTD Performance: -5.54% | |
| **Trend Scores & Views Are Only For Educational Purposes And Not For Investing | |
| 12Stocks.com: Investing in Latin America Index using Exchange Traded Funds | |
|
The following table shows list of key exchange traded funds (ETF) that
help investors play Latin America stock market. For detailed view, check out our ETF Funds section of our website. Quick View: Move mouse or cursor over ETF symbol (ticker) to view short-term technical chart and over ETF name to view long term chart. Click on ticker or stock name for detailed view. Click on to add stock symbol to your watchlist and to view watchlist. |
12Stocks.com List of ETFs that track Latin America Index
| Ticker | ETF Name | Watchlist | Recent Price | Market Intelligence Score | Change % | Week % | Year-to-date % |
| ILF | Latin America 40 | | 27.45 | 35 | 0.26 | -1.12 | -5.54% |
| EWC | Canada | | 36.94 | 39 | 0.05 | -1.83 | 0.71% |
| FLN | Latin America AlphaDEX | | 19.48 | 17 | 0.23 | -1.09 | -6.33% |
| EWZ | Brazil | | 31.15 | 57 | 0.39 | -1.24 | -10.9% |
| EWW | Mexico | | 65.93 | 51 | 0.69 | -1.38 | -2.83% |
| ARGT | Argentina | | 57.42 | 37 | 0.00 | 1.94 | 11.84% |
| EWZS | Brazil Small-Cap | | 13.23 | 24 | 0.92 | -1.78 | -12.15% |
| BRF | Brazil Small-Cap | | 15.00 | 7 | -0.27 | -2.91 | -14.71% |
| BZQ | Short Brazil | | 12.29 | 81 | -1.21 | 1.82 | 22.53% |
| BRZU | Brazil Bull 3X | | 79.04 | 17 | 1.26 | -1.94 | -23.17% |
| FBZ | Brazil AlphaDEX | | 11.22 | 15 | -0.10 | -2.18 | -8.2% |
| 12Stocks.com: Charts, Trends, Fundamental Data and Performances of Latin America Stocks | |
|
We now take in-depth look at all Latin America stocks including charts, multi-period performances and overall trends (as measured by market intelligence score). One can sort Latin America stocks (click link to choose) by Daily, Weekly and by Year-to-Date performances. Also, one can sort by size of the company or by market capitalization. |
| Select Your Default Chart Type: | |||||
| |||||
| Click on stock symbol or name for detailed view. Click on to add stock symbol to your watchlist and to view watchlist. Quick View: Move mouse or cursor over "Daily" to quickly view daily technical stock chart and over "Weekly" to view weekly technical stock chart. | |||||

 | SBS Companhia de Saneamento Basico do Estado de Sao Paulo - SABESP |
| Sector: Utilities | |
| SubSector: Water Utilities | |
| MarketCap: 5498.72 Millions | |
| Recent Price: 15.63 Market Intelligence Score: 0 | |
| Day Percent Change: 0.00% Day Change: 0.00 | |
| Week Change: -2.31% Year-to-date Change: 2.6% | |
| SBS Links: Profile News Message Board | |
| Charts:- Daily , Weekly | |
| Add SBS to Watchlist: View: Get Complete SBS Trend Analysis ➞ | |
 | NFGC New Found Gold Corp. |
| Sector: Materials | |
| SubSector: Gold | |
| MarketCap: 868 Millions | |
| Recent Price: 3.56 Market Intelligence Score: 36 | |
| Day Percent Change: 0.00% Day Change: 0.00 | |
| Week Change: -5.07% Year-to-date Change: 1.1% | |
| NFGC Links: Profile News Message Board | |
| Charts:- Daily , Weekly | |
| Add NFGC to Watchlist: View: Get Complete NFGC Trend Analysis ➞ | |
 | VMAR Vision Marine Technologies Inc. |
| Sector: Services & Goods | |
| SubSector: Leisure | |
| MarketCap: 99027 Millions | |
| Recent Price: 0.61 Market Intelligence Score: 54 | |
| Day Percent Change: 0.00% Day Change: 0.00 | |
| Week Change: 1.99% Year-to-date Change: -43.8% | |
| VMAR Links: Profile News Message Board | |
| Charts:- Daily , Weekly | |
| Add VMAR to Watchlist: View: Get Complete VMAR Trend Analysis ➞ | |
 | VSTA Vasta Platform Limited |
| Sector: Consumer Staples | |
| SubSector: Education & Training Services | |
| MarketCap: 12747 Millions | |
| Recent Price: 3.80 Market Intelligence Score: 20 | |
| Day Percent Change: 0.00% Day Change: 0.00 | |
| Week Change: 0% Year-to-date Change: -13.6% | |
| VSTA Links: Profile News Message Board | |
| Charts:- Daily , Weekly | |
| Add VSTA to Watchlist: View: Get Complete VSTA Trend Analysis ➞ | |
 | EDSA Edesa Biotech, Inc. |
| Sector: Health Care | |
| SubSector: Biotechnology | |
| MarketCap: 19.6785 Millions | |
| Recent Price: 4.44 Market Intelligence Score: 28 | |
| Day Percent Change: 0.00% Day Change: 0.00 | |
| Week Change: 0.52% Year-to-date Change: -4.3% | |
| EDSA Links: Profile News Message Board | |
| Charts:- Daily , Weekly | |
| Add EDSA to Watchlist: View: Get Complete EDSA Trend Analysis ➞ | |
 | BAM Brookfield Asset Management Inc. |
| Sector: Financials | |
| SubSector: Real Estate Development | |
| MarketCap: 47134.9 Millions | |
| Recent Price: 38.19 Market Intelligence Score: 0 | |
| Day Percent Change: 0.00% Day Change: 0.00 | |
| Week Change: -3.8% Year-to-date Change: -4.9% | |
| BAM Links: Profile News Message Board | |
| Charts:- Daily , Weekly | |
| Add BAM to Watchlist: View: Get Complete BAM Trend Analysis ➞ | |
 | FUSN Fusion Pharmaceuticals Inc. |
| Sector: Health Care | |
| SubSector: Biotechnology | |
| MarketCap: 52487 Millions | |
| Recent Price: 21.42 Market Intelligence Score: 63 | |
| Day Percent Change: -0.05% Day Change: -0.01 | |
| Week Change: 0% Year-to-date Change: 123.1% | |
| FUSN Links: Profile News Message Board | |
| Charts:- Daily , Weekly | |
| Add FUSN to Watchlist: View: Get Complete FUSN Trend Analysis ➞ | |
 | RCI Rogers Communications Inc. |
| Sector: Technology | |
| SubSector: Wireless Communications | |
| MarketCap: 22111.6 Millions | |
| Recent Price: 37.44 Market Intelligence Score: 28 | |
| Day Percent Change: -0.08% Day Change: -0.03 | |
| Week Change: -1.37% Year-to-date Change: -20.0% | |
| RCI Links: Profile News Message Board | |
| Charts:- Daily , Weekly | |
| Add RCI to Watchlist: View: Get Complete RCI Trend Analysis ➞ | |
 | DOOO BRP Inc. |
| Sector: Consumer Staples | |
| SubSector: Recreational Vehicles | |
| MarketCap: 638.559 Millions | |
| Recent Price: 67.20 Market Intelligence Score: 46 | |
| Day Percent Change: -0.10% Day Change: -0.07 | |
| Week Change: -2.24% Year-to-date Change: -6.3% | |
| DOOO Links: Profile News Message Board | |
| Charts:- Daily , Weekly | |
| Add DOOO to Watchlist: View: Get Complete DOOO Trend Analysis ➞ | |
 | BHC Bausch Health Companies Inc. |
| Sector: Health Care | |
| SubSector: Drug Delivery | |
| MarketCap: 5485.3 Millions | |
| Recent Price: 8.75 Market Intelligence Score: 17 | |
| Day Percent Change: -0.11% Day Change: -0.01 | |
| Week Change: 0.46% Year-to-date Change: 9.1% | |
| BHC Links: Profile News Message Board | |
| Charts:- Daily , Weekly | |
| Add BHC to Watchlist: View: Get Complete BHC Trend Analysis ➞ | |
 | MELI MercadoLibre, Inc. |
| Sector: Services & Goods | |
| SubSector: Catalog & Mail Order Houses | |
| MarketCap: 24695.5 Millions | |
| Recent Price: 1456.99 Market Intelligence Score: 64 | |
| Day Percent Change: -0.12% Day Change: -1.71 | |
| Week Change: 3.63% Year-to-date Change: -7.3% | |
| MELI Links: Profile News Message Board | |
| Charts:- Daily , Weekly | |
| Add MELI to Watchlist: View: Get Complete MELI Trend Analysis ➞ | |
 | GFL GFL Environmental Inc. |
| Sector: Industrials | |
| SubSector: Waste Management | |
| MarketCap: 87627 Millions | |
| Recent Price: 31.86 Market Intelligence Score: 18 | |
| Day Percent Change: -0.13% Day Change: -0.04 | |
| Week Change: -0.59% Year-to-date Change: -7.7% | |
| GFL Links: Profile News Message Board | |
| Charts:- Daily , Weekly | |
| Add GFL to Watchlist: View: Get Complete GFL Trend Analysis ➞ | |
 | PBR Petroleo Brasileiro S.A. - Petrobras |
| Sector: Energy | |
| SubSector: Oil & Gas Drilling & Exploration | |
| MarketCap: 38939.2 Millions | |
| Recent Price: 16.94 Market Intelligence Score: 71 | |
| Day Percent Change: -0.18% Day Change: -0.03 | |
| Week Change: -0.65% Year-to-date Change: 6.1% | |
| PBR Links: Profile News Message Board | |
| Charts:- Daily , Weekly | |
| Add PBR to Watchlist: View: Get Complete PBR Trend Analysis ➞ | |
 | GIL Gildan Activewear Inc. |
| Sector: Consumer Staples | |
| SubSector: Textile - Apparel Clothing | |
| MarketCap: 2411.65 Millions | |
| Recent Price: 34.59 Market Intelligence Score: 23 | |
| Day Percent Change: -0.20% Day Change: -0.07 | |
| Week Change: -2.01% Year-to-date Change: 4.6% | |
| GIL Links: Profile News Message Board | |
| Charts:- Daily , Weekly | |
| Add GIL to Watchlist: View: Get Complete GIL Trend Analysis ➞ | |
 | GGAL Grupo Financiero Galicia S.A. |
| Sector: Financials | |
| SubSector: Foreign Regional Banks | |
| MarketCap: 1274.69 Millions | |
| Recent Price: 32.36 Market Intelligence Score: 100 | |
| Day Percent Change: -0.22% Day Change: -0.07 | |
| Week Change: 5.41% Year-to-date Change: 87.4% | |
| GGAL Links: Profile News Message Board | |
| Charts:- Daily , Weekly | |
| Add GGAL to Watchlist: View: Get Complete GGAL Trend Analysis ➞ | |
 | RBA Ritchie Bros. Auctioneers Incorporated |
| Sector: Services & Goods | |
| SubSector: Business Services | |
| MarketCap: 3491.02 Millions | |
| Recent Price: 71.37 Market Intelligence Score: 0 | |
| Day Percent Change: -0.29% Day Change: -0.21 | |
| Week Change: -2.47% Year-to-date Change: 6.7% | |
| RBA Links: Profile News Message Board | |
| Charts:- Daily , Weekly | |
| Add RBA to Watchlist: View: Get Complete RBA Trend Analysis ➞ | |
 | TRP TC Energy Corporation |
| Sector: Energy | |
| SubSector: Oil & Gas Pipelines | |
| MarketCap: 44071.1 Millions | |
| Recent Price: 35.73 Market Intelligence Score: 42 | |
| Day Percent Change: -0.33% Day Change: -0.12 | |
| Week Change: -1.02% Year-to-date Change: -8.6% | |
| TRP Links: Profile News Message Board | |
| Charts:- Daily , Weekly | |
| Add TRP to Watchlist: View: Get Complete TRP Trend Analysis ➞ | |
 | MGA Magna International Inc. |
| Sector: Services & Goods | |
| SubSector: Auto Parts Wholesale | |
| MarketCap: 8967.3 Millions | |
| Recent Price: 47.64 Market Intelligence Score: 10 | |
| Day Percent Change: -0.33% Day Change: -0.16 | |
| Week Change: -3.01% Year-to-date Change: -19.4% | |
| MGA Links: Profile News Message Board | |
| Charts:- Daily , Weekly | |
| Add MGA to Watchlist: View: Get Complete MGA Trend Analysis ➞ | |
 | PAC Grupo Aeroportuario del Pacifico, S.A.B. de C.V. |
| Sector: Transports | |
| SubSector: Air Services, Other | |
| MarketCap: 3204.18 Millions | |
| Recent Price: 181.21 Market Intelligence Score: 76 | |
| Day Percent Change: -0.34% Day Change: -0.62 | |
| Week Change: -1.23% Year-to-date Change: 3.4% | |
| PAC Links: Profile News Message Board | |
| Charts:- Daily , Weekly | |
| Add PAC to Watchlist: View: Get Complete PAC Trend Analysis ➞ | |
 | TV Grupo Televisa, S.A.B. |
| Sector: Services & Goods | |
| SubSector: Broadcasting - TV | |
| MarketCap: 3740.43 Millions | |
| Recent Price: 2.91 Market Intelligence Score: 10 | |
| Day Percent Change: -0.34% Day Change: -0.01 | |
| Week Change: -7.91% Year-to-date Change: -12.9% | |
| TV Links: Profile News Message Board | |
| Charts:- Daily , Weekly | |
| Add TV to Watchlist: View: Get Complete TV Trend Analysis ➞ | |
 | FSV FirstService Corporation |
| Sector: Financials | |
| SubSector: Property Management | |
| MarketCap: 2793.92 Millions | |
| Recent Price: 146.49 Market Intelligence Score: 10 | |
| Day Percent Change: -0.35% Day Change: -0.51 | |
| Week Change: -2.21% Year-to-date Change: -9.6% | |
| FSV Links: Profile News Message Board | |
| Charts:- Daily , Weekly | |
| Add FSV to Watchlist: View: Get Complete FSV Trend Analysis ➞ | |
 | CNI Canadian National Railway Company |
| Sector: Transports | |
| SubSector: Railroads | |
| MarketCap: 54114.1 Millions | |
| Recent Price: 121.01 Market Intelligence Score: 0 | |
| Day Percent Change: -0.35% Day Change: -0.43 | |
| Week Change: -3.37% Year-to-date Change: -3.7% | |
| CNI Links: Profile News Message Board | |
| Charts:- Daily , Weekly | |
| Add CNI to Watchlist: View: Get Complete CNI Trend Analysis ➞ | |
 | CX CEMEX, S.A.B. de C.V. |
| Sector: Industrials | |
| SubSector: Cement | |
| MarketCap: 2948.23 Millions | |
| Recent Price: 7.88 Market Intelligence Score: 36 | |
| Day Percent Change: -0.38% Day Change: -0.03 | |
| Week Change: -4.72% Year-to-date Change: 1.7% | |
| CX Links: Profile News Message Board | |
| Charts:- Daily , Weekly | |
| Add CX to Watchlist: View: Get Complete CX Trend Analysis ➞ | |
 | TFII TFI International Inc. |
| Sector: Transports | |
| SubSector: Trucking | |
| MarketCap: 1621.25 Millions | |
| Recent Price: 129.75 Market Intelligence Score: 10 | |
| Day Percent Change: -0.41% Day Change: -0.54 | |
| Week Change: -5.87% Year-to-date Change: -4.6% | |
| TFII Links: Profile News Message Board | |
| Charts:- Daily , Weekly | |
| Add TFII to Watchlist: View: Get Complete TFII Trend Analysis ➞ | |
 | IRS IRSA Inversiones y Representaciones Sociedad Anonima |
| Sector: Financials | |
| SubSector: Real Estate Development | |
| MarketCap: 257.519 Millions | |
| Recent Price: 9.46 Market Intelligence Score: 83 | |
| Day Percent Change: -0.42% Day Change: -0.04 | |
| Week Change: 0.11% Year-to-date Change: 10.0% | |
| IRS Links: Profile News Message Board | |
| Charts:- Daily , Weekly | |
| Add IRS to Watchlist: View: Get Complete IRS Trend Analysis ➞ | |
| To view more stocks, click on Next / Previous arrows or select different range: 0 - 25 , 25 - 50 , 50 - 75 , 75 - 100 , 100 - 125 , 125 - 150 , 150 - 175 , 175 - 200 , 200 - 225 | ||
| Click To Change The Sort Order: By Market Cap or Company Size Performance: Year-to-date, Week and Day | |
| Select Chart Type: | ||
 Best Stocks Today 12Stocks.com |
© 2024 12Stocks.com Terms & Conditions Privacy Contact Us
All Information Provided Only For Education And Not To Be Used For Investing or Trading. See Terms & Conditions


One More Thing ... Get Best Stocks Delivered Daily!
Never Ever Miss A Move With Our Top Ten Stocks Lists
Find Best Stocks In Any Market - Bull or Bear Market
Take A Peek At Our Top Ten Stocks Lists: Daily, Weekly, Year-to-Date & Top Trends
Find Best Stocks In Any Market - Bull or Bear Market
Take A Peek At Our Top Ten Stocks Lists: Daily, Weekly, Year-to-Date & Top Trends
Latin America Stocks With Best Up Trends [0-bearish to 100-bullish]: Brookfield Renewable[100], New Gold[100], Transportadora de[100], CAE [100], Descartes Systems[100], Mercer [100], City Office[100], Grupo Financiero[100], Algonquin Power[95], Sandstorm Gold[95], YPF Sociedad[95]
Best Latin America Stocks Year-to-Date:
Aurora Cannabis[1443.47%], Canopy Growth[124.27%], Fusion [123.13%], Banco Macro[90.49%], Grupo Financiero[87.43%], Banco BBVA[77.94%], D-Wave Quantum[60.7%], McEwen Mining[60.19%], Grupo Supervielle[58.37%], Hudbay Minerals[50.91%], OrganiGram [45.8%] Best Latin America Stocks This Week:
Canopy Growth[28.62%], Tilray [12.92%], Aurora Cannabis[9.7%], Brookfield Renewable[9.18%], Canadian Solar[7.92%], Transportadora de[7.67%], Grupo Supervielle[6.63%], Banco Macro[6.4%], Xenon [6.16%], Zymeworks [6.05%], Aurinia [6.01%] Best Latin America Stocks Daily:
Brookfield Renewable[10.90%], New Gold[8.62%], Repare [7.74%], Lavoro [5.27%], NovaGold Resources[4.48%], Lion Electric[4.44%], Fortuna Silver[3.30%], Denison Mines[3.03%], Transportadora de[2.96%], D-Wave Quantum[2.92%], Cameco [2.83%]