
 Login Sign Up


| |||||
 |  | ||||

| 12Stocks.com Market Intelligence |
Best Latin America Stocks
|
|
| Quick Read: Top Latin America Stocks By Performances & Trends: Daily, Weekly, Year-to-Date, Market Cap (Size) & Technical Trends | |||
| Best Latin America Views: Quick Browse View, Summary & Slide Show | |||
| 12Stocks.com Latin America Stocks Performances & Trends Daily | |||||||||
|
|  The overall market intelligence score is 18 (0-bearish to 100-bullish) which puts Latin America index in short term bearish trend. The market intelligence score from previous trading session is 0 and hence an improvement of trend.
| ||||||||
| Here are the market intelligence trend scores of the most requested Latin America stocks at 12Stocks.com (click stock name for detailed review): | |
| Scroll down this page for most comprehensive review of Latin America stocks by performance, trends, technical analysis, charts, fund plays & more | |


| 12Stocks.com: Top Performing Latin America Index Stocks | ||||||||||||||||||||||||||||||||||||||||||||||||
 The top performing Latin America Index stocks year to date are
Now, more recently, over last week, the top performing Latin America Index stocks on the move are


|
||||||||||||||||||||||||||||||||||||||||||||||||
| 12Stocks.com: Investing in Latin America Index with Stocks | |
|
The following table helps investors and traders sort through current performance and trends (as measured by market intelligence score) of various
stocks in the Latin America Index. Quick View: Move mouse or cursor over stock symbol (ticker) to view short-term technical chart and over stock name to view long term chart. Click on  to add stock symbol to your watchlist and to add stock symbol to your watchlist and  to view watchlist. Click on any ticker or stock name for detailed market intelligence report for that stock. to view watchlist. Click on any ticker or stock name for detailed market intelligence report for that stock. |
12Stocks.com Performance of Stocks in Latin America Index
| Ticker | Stock Name | Watchlist | Category | Recent Price | Market Intelligence Score | Change % | YTD Change% |
| BHC | Bausch Health |   | Health Care | 8.67 | 44 | 0.81 | 8.10% |
| BEP | Brookfield Renewable | | Utilities | 20.75 | 32 | 0.80 | -21.06% |
| MGA | Magna | | Services & Goods | 48.22 | 10 | 0.76 | -18.39% |
| CNQ | Canadian Natural | | Energy | 77.36 | 69 | 0.69 | 18.07% |
| CP | Canadian Pacific | | Transports | 84.51 | 61 | 0.68 | 6.89% |
| TU | TELUS | | Technology | 15.89 | 60 | 0.67 | -10.71% |
| OTEX | Open Text | | Technology | 34.98 | 32 | 0.66 | -16.75% |
| CNI | Canadian National | | Transports | 128.00 | 68 | 0.66 | 1.89% |
| ABEV | Ambev S.A | | Consumer Staples | 2.29 | 17 | 0.66 | -18.04% |
| RCI | Rogers | | Technology | 38.55 | 42 | 0.65 | -17.65% |
| CIGI | Colliers | | Financials | 107.61 | 10 | 0.63 | -14.95% |
| AMX | America Movil | | Technology | 17.86 | 28 | 0.62 | -3.56% |
| GIL | Gildan Activewear | | Consumer Staples | 35.34 | 41 | 0.61 | 6.88% |
| CINT | CI&T | | Technology | 4.12 | 22 | 0.61 | -22.63% |
| VINP | Vi Partners | | Financials | 10.21 | 7 | 0.59 | -7.10% |
| BTG | B2Gold | | Materials | 2.63 | 10 | 0.57 | -16.93% |
| BBD | Banco Bradesco | | Financials | 2.65 | 10 | 0.57 | -24.43% |
| CEF | Sprott Physical | | Financials | 22.35 | 75 | 0.54 | 16.71% |
| FMX | Fomento Economico | | Consumer Staples | 119.69 | 25 | 0.52 | -8.17% |
| DNN | Denison Mines | | Materials | 2.02 | 51 | 0.50 | 14.12% |
| PAGS | PagSeguro Digital | | Financials | 11.61 | 10 | 0.48 | -6.94% |
| PDS | Precision Drilling | | Energy | 67.70 | 44 | 0.46 | 24.70% |
| XP | XP | | Financials | 21.16 | 0 | 0.45 | -18.81% |
| NTR | Nutrien | | Materials | 52.88 | 61 | 0.44 | -6.12% |
| AEM | Agnico Eagle | | Materials | 63.75 | 93 | 0.44 | 16.23% |
| To view more stocks, click on Next / Previous arrows or select different range: 0 - 25 , 25 - 50 , 50 - 75 , 75 - 100 , 100 - 125 , 125 - 150 , 150 - 175 , 175 - 200 | ||
 | Click To Change The Sort Order: By Market Cap or Company Size Performance: Year-to-date, Week and Day |  |
| Detailed Overview Of Latin America Stocks |
| Latin America Technical Overview, Leaders & Laggards, Top Latin America ETF Funds & Detailed Latin America Stocks List, Charts, Trends & More |
| Latin America: Technical Analysis, Trends & YTD Performance | |
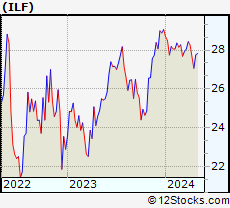
 ILF Weekly Chart |
|
| Long Term Trend: Not Good | |
| Medium Term Trend: Not Good | |
 ILF Daily Chart |
|
| Short Term Trend: Very Good | |
| Overall Trend Score: 18 | |
| YTD Performance: -6.99% | |
| **Trend Scores & Views Are Only For Educational Purposes And Not For Investing | |
| 12Stocks.com: Investing in Latin America Index using Exchange Traded Funds | |
|
The following table shows list of key exchange traded funds (ETF) that
help investors play Latin America stock market. For detailed view, check out our ETF Funds section of our website. Quick View: Move mouse or cursor over ETF symbol (ticker) to view short-term technical chart and over ETF name to view long term chart. Click on ticker or stock name for detailed view. Click on to add stock symbol to your watchlist and to view watchlist. |
12Stocks.com List of ETFs that track Latin America Index
| Ticker | ETF Name | Watchlist | Recent Price | Market Intelligence Score | Change % | Week % | Year-to-date % |
| ILF | Latin America 40 | | 27.03 | 18 | 1.05 | -2.24 | -6.99% |
| EWC | Canada | | 37.22 | 68 | 1.00 | 0.19 | 1.47% |
| EWZ | Brazil | | 30.73 | 32 | 2.06 | -1.73 | -12.1% |
| EWW | Mexico | | 64.37 | 0 | -0.85 | -4.52 | -5.13% |
| 12Stocks.com: Charts, Trends, Fundamental Data and Performances of Latin America Stocks | |
|
We now take in-depth look at all Latin America stocks including charts, multi-period performances and overall trends (as measured by market intelligence score). One can sort Latin America stocks (click link to choose) by Daily, Weekly and by Year-to-Date performances. Also, one can sort by size of the company or by market capitalization. |
| Select Your Default Chart Type: | |||||
| |||||
| Click on stock symbol or name for detailed view. Click on to add stock symbol to your watchlist and to view watchlist. Quick View: Move mouse or cursor over "Daily" to quickly view daily technical stock chart and over "Weekly" to view weekly technical stock chart. | |||||

 | BHC Bausch Health Companies Inc. |
| Sector: Health Care | |
| SubSector: Drug Delivery | |
| MarketCap: 5485.3 Millions | |
| Recent Price: 8.67 Market Intelligence Score: 44 | |
| Day Percent Change: 0.81% Day Change: 0.07 | |
| Week Change: -1.03% Year-to-date Change: 8.1% | |
| BHC Links: Profile News Message Board | |
| Charts:- Daily , Weekly | |
| Add BHC to Watchlist: View: Get Complete BHC Trend Analysis ➞ | |
 | BEP Brookfield Renewable Partners L.P. |
| Sector: Utilities | |
| SubSector: Diversified Utilities | |
| MarketCap: 6419.9 Millions | |
| Recent Price: 20.75 Market Intelligence Score: 32 | |
| Day Percent Change: 0.80% Day Change: 0.17 | |
| Week Change: -1.4% Year-to-date Change: -21.1% | |
| BEP Links: Profile News Message Board | |
| Charts:- Daily , Weekly | |
| Add BEP to Watchlist: View: Get Complete BEP Trend Analysis ➞ | |
 | MGA Magna International Inc. |
| Sector: Services & Goods | |
| SubSector: Auto Parts Wholesale | |
| MarketCap: 8967.3 Millions | |
| Recent Price: 48.22 Market Intelligence Score: 10 | |
| Day Percent Change: 0.76% Day Change: 0.37 | |
| Week Change: -5.98% Year-to-date Change: -18.4% | |
| MGA Links: Profile News Message Board | |
| Charts:- Daily , Weekly | |
| Add MGA to Watchlist: View: Get Complete MGA Trend Analysis ➞ | |
 | CNQ Canadian Natural Resources Limited |
| Sector: Energy | |
| SubSector: Independent Oil & Gas | |
| MarketCap: 11925.2 Millions | |
| Recent Price: 77.36 Market Intelligence Score: 69 | |
| Day Percent Change: 0.69% Day Change: 0.53 | |
| Week Change: -2.36% Year-to-date Change: 18.1% | |
| CNQ Links: Profile News Message Board | |
| Charts:- Daily , Weekly | |
| Add CNQ to Watchlist: View: Get Complete CNQ Trend Analysis ➞ | |
 | CP Canadian Pacific Railway Limited |
| Sector: Transports | |
| SubSector: Railroads | |
| MarketCap: 25428.5 Millions | |
| Recent Price: 84.51 Market Intelligence Score: 61 | |
| Day Percent Change: 0.68% Day Change: 0.57 | |
| Week Change: -1.79% Year-to-date Change: 6.9% | |
| CP Links: Profile News Message Board | |
| Charts:- Daily , Weekly | |
| Add CP to Watchlist: View: Get Complete CP Trend Analysis ➞ | |
 | TU TELUS Corporation |
| Sector: Technology | |
| SubSector: Wireless Communications | |
| MarketCap: 10864.7 Millions | |
| Recent Price: 15.89 Market Intelligence Score: 60 | |
| Day Percent Change: 0.67% Day Change: 0.11 | |
| Week Change: 0.22% Year-to-date Change: -10.7% | |
| TU Links: Profile News Message Board | |
| Charts:- Daily , Weekly | |
| Add TU to Watchlist: View: Get Complete TU Trend Analysis ➞ | |
 | OTEX Open Text Corporation |
| Sector: Technology | |
| SubSector: Application Software | |
| MarketCap: 9291.92 Millions | |
| Recent Price: 34.98 Market Intelligence Score: 32 | |
| Day Percent Change: 0.66% Day Change: 0.23 | |
| Week Change: -1.52% Year-to-date Change: -16.8% | |
| OTEX Links: Profile News Message Board | |
| Charts:- Daily , Weekly | |
| Add OTEX to Watchlist: View: Get Complete OTEX Trend Analysis ➞ | |
 | CNI Canadian National Railway Company |
| Sector: Transports | |
| SubSector: Railroads | |
| MarketCap: 54114.1 Millions | |
| Recent Price: 128.00 Market Intelligence Score: 68 | |
| Day Percent Change: 0.66% Day Change: 0.84 | |
| Week Change: -0.35% Year-to-date Change: 1.9% | |
| CNI Links: Profile News Message Board | |
| Charts:- Daily , Weekly | |
| Add CNI to Watchlist: View: Get Complete CNI Trend Analysis ➞ | |
 | ABEV Ambev S.A. |
| Sector: Consumer Staples | |
| SubSector: Beverages - Brewers | |
| MarketCap: 37753.5 Millions | |
| Recent Price: 2.29 Market Intelligence Score: 17 | |
| Day Percent Change: 0.66% Day Change: 0.02 | |
| Week Change: -2.34% Year-to-date Change: -18.0% | |
| ABEV Links: Profile News Message Board | |
| Charts:- Daily , Weekly | |
| Add ABEV to Watchlist: View: Get Complete ABEV Trend Analysis ➞ | |
 | RCI Rogers Communications Inc. |
| Sector: Technology | |
| SubSector: Wireless Communications | |
| MarketCap: 22111.6 Millions | |
| Recent Price: 38.55 Market Intelligence Score: 42 | |
| Day Percent Change: 0.65% Day Change: 0.25 | |
| Week Change: -1.58% Year-to-date Change: -17.7% | |
| RCI Links: Profile News Message Board | |
| Charts:- Daily , Weekly | |
| Add RCI to Watchlist: View: Get Complete RCI Trend Analysis ➞ | |
 | CIGI Colliers International Group Inc. |
| Sector: Financials | |
| SubSector: Property Management | |
| MarketCap: 1928.42 Millions | |
| Recent Price: 107.61 Market Intelligence Score: 10 | |
| Day Percent Change: 0.63% Day Change: 0.67 | |
| Week Change: -4.9% Year-to-date Change: -15.0% | |
| CIGI Links: Profile News Message Board | |
| Charts:- Daily , Weekly | |
| Add CIGI to Watchlist: View: Get Complete CIGI Trend Analysis ➞ | |
 | AMX America Movil, S.A.B. de C.V. |
| Sector: Technology | |
| SubSector: Wireless Communications | |
| MarketCap: 44726.6 Millions | |
| Recent Price: 17.86 Market Intelligence Score: 28 | |
| Day Percent Change: 0.62% Day Change: 0.11 | |
| Week Change: -1.05% Year-to-date Change: -3.6% | |
| AMX Links: Profile News Message Board | |
| Charts:- Daily , Weekly | |
| Add AMX to Watchlist: View: Get Complete AMX Trend Analysis ➞ | |
 | GIL Gildan Activewear Inc. |
| Sector: Consumer Staples | |
| SubSector: Textile - Apparel Clothing | |
| MarketCap: 2411.65 Millions | |
| Recent Price: 35.34 Market Intelligence Score: 41 | |
| Day Percent Change: 0.61% Day Change: 0.22 | |
| Week Change: -0.72% Year-to-date Change: 6.9% | |
| GIL Links: Profile News Message Board | |
| Charts:- Daily , Weekly | |
| Add GIL to Watchlist: View: Get Complete GIL Trend Analysis ➞ | |
 | CINT CI&T Inc |
| Sector: Technology | |
| SubSector: Software - Infrastructure | |
| MarketCap: 806 Millions | |
| Recent Price: 4.12 Market Intelligence Score: 22 | |
| Day Percent Change: 0.61% Day Change: 0.03 | |
| Week Change: -12.34% Year-to-date Change: -22.6% | |
| CINT Links: Profile News Message Board | |
| Charts:- Daily , Weekly | |
| Add CINT to Watchlist: View: Get Complete CINT Trend Analysis ➞ | |
 | VINP Vinci Partners Investments Ltd. |
| Sector: Financials | |
| SubSector: Asset Management | |
| MarketCap: 537 Millions | |
| Recent Price: 10.21 Market Intelligence Score: 7 | |
| Day Percent Change: 0.59% Day Change: 0.06 | |
| Week Change: -5.46% Year-to-date Change: -7.1% | |
| VINP Links: Profile News Message Board | |
| Charts:- Daily , Weekly | |
| Add VINP to Watchlist: View: Get Complete VINP Trend Analysis ➞ | |
 | BTG B2Gold Corp. |
| Sector: Materials | |
| SubSector: Gold | |
| MarketCap: 2792.39 Millions | |
| Recent Price: 2.63 Market Intelligence Score: 10 | |
| Day Percent Change: 0.57% Day Change: 0.02 | |
| Week Change: -9.17% Year-to-date Change: -16.9% | |
| BTG Links: Profile News Message Board | |
| Charts:- Daily , Weekly | |
| Add BTG to Watchlist: View: Get Complete BTG Trend Analysis ➞ | |
 | BBD Banco Bradesco S.A. |
| Sector: Financials | |
| SubSector: Foreign Regional Banks | |
| MarketCap: 30281.7 Millions | |
| Recent Price: 2.65 Market Intelligence Score: 10 | |
| Day Percent Change: 0.57% Day Change: 0.02 | |
| Week Change: -4.51% Year-to-date Change: -24.4% | |
| BBD Links: Profile News Message Board | |
| Charts:- Daily , Weekly | |
| Add BBD to Watchlist: View: Get Complete BBD Trend Analysis ➞ | |
 | CEF Sprott Physical Gold and Silver Trust |
| Sector: Financials | |
| SubSector: Asset Management | |
| MarketCap: 2485.33 Millions | |
| Recent Price: 22.35 Market Intelligence Score: 75 | |
| Day Percent Change: 0.54% Day Change: 0.12 | |
| Week Change: 1.59% Year-to-date Change: 16.7% | |
| CEF Links: Profile News Message Board | |
| Charts:- Daily , Weekly | |
| Add CEF to Watchlist: View: Get Complete CEF Trend Analysis ➞ | |
 | FMX Fomento Economico Mexicano, S.A.B. de C.V. |
| Sector: Consumer Staples | |
| SubSector: Beverages - Brewers | |
| MarketCap: 22018.7 Millions | |
| Recent Price: 119.69 Market Intelligence Score: 25 | |
| Day Percent Change: 0.52% Day Change: 0.63 | |
| Week Change: -3.66% Year-to-date Change: -8.2% | |
| FMX Links: Profile News Message Board | |
| Charts:- Daily , Weekly | |
| Add FMX to Watchlist: View: Get Complete FMX Trend Analysis ➞ | |
 | DNN Denison Mines Corp. |
| Sector: Materials | |
| SubSector: Industrial Metals & Minerals | |
| MarketCap: 154.11 Millions | |
| Recent Price: 2.02 Market Intelligence Score: 51 | |
| Day Percent Change: 0.50% Day Change: 0.01 | |
| Week Change: -4.27% Year-to-date Change: 14.1% | |
| DNN Links: Profile News Message Board | |
| Charts:- Daily , Weekly | |
| Add DNN to Watchlist: View: Get Complete DNN Trend Analysis ➞ | |
 | PAGS PagSeguro Digital Ltd. |
| Sector: Financials | |
| SubSector: Credit Services | |
| MarketCap: 6500.78 Millions | |
| Recent Price: 11.61 Market Intelligence Score: 10 | |
| Day Percent Change: 0.48% Day Change: 0.05 | |
| Week Change: -7.75% Year-to-date Change: -6.9% | |
| PAGS Links: Profile News Message Board | |
| Charts:- Daily , Weekly | |
| Add PAGS to Watchlist: View: Get Complete PAGS Trend Analysis ➞ | |
 | PDS Precision Drilling Corporation |
| Sector: Energy | |
| SubSector: Oil & Gas Equipment & Services | |
| MarketCap: 103.461 Millions | |
| Recent Price: 67.70 Market Intelligence Score: 44 | |
| Day Percent Change: 0.46% Day Change: 0.31 | |
| Week Change: -7.43% Year-to-date Change: 24.7% | |
| PDS Links: Profile News Message Board | |
| Charts:- Daily , Weekly | |
| Add PDS to Watchlist: View: Get Complete PDS Trend Analysis ➞ | |
 | XP XP Inc. |
| Sector: Financials | |
| SubSector: Asset Management | |
| MarketCap: 12990.3 Millions | |
| Recent Price: 21.16 Market Intelligence Score: 0 | |
| Day Percent Change: 0.45% Day Change: 0.09 | |
| Week Change: -9.4% Year-to-date Change: -18.8% | |
| XP Links: Profile News Message Board | |
| Charts:- Daily , Weekly | |
| Add XP to Watchlist: View: Get Complete XP Trend Analysis ➞ | |
 | NTR Nutrien Ltd. |
| Sector: Materials | |
| SubSector: Agricultural Chemicals | |
| MarketCap: 15897.9 Millions | |
| Recent Price: 52.88 Market Intelligence Score: 61 | |
| Day Percent Change: 0.44% Day Change: 0.23 | |
| Week Change: -3.13% Year-to-date Change: -6.1% | |
| NTR Links: Profile News Message Board | |
| Charts:- Daily , Weekly | |
| Add NTR to Watchlist: View: Get Complete NTR Trend Analysis ➞ | |
 | AEM Agnico Eagle Mines Limited |
| Sector: Materials | |
| SubSector: Gold | |
| MarketCap: 9491.49 Millions | |
| Recent Price: 63.75 Market Intelligence Score: 93 | |
| Day Percent Change: 0.44% Day Change: 0.28 | |
| Week Change: 3.74% Year-to-date Change: 16.2% | |
| AEM Links: Profile News Message Board | |
| Charts:- Daily , Weekly | |
| Add AEM to Watchlist: View: Get Complete AEM Trend Analysis ➞ | |
| To view more stocks, click on Next / Previous arrows or select different range: 0 - 25 , 25 - 50 , 50 - 75 , 75 - 100 , 100 - 125 , 125 - 150 , 150 - 175 , 175 - 200 | ||
| Click To Change The Sort Order: By Market Cap or Company Size Performance: Year-to-date, Week and Day | |
| Select Chart Type: | ||
 Best Stocks Today 12Stocks.com |
© 2024 12Stocks.com Terms & Conditions Privacy Contact Us
All Information Provided Only For Education And Not To Be Used For Investing or Trading. See Terms & Conditions


One More Thing ... Get Best Stocks Delivered Daily!
Never Ever Miss A Move With Our Top Ten Stocks Lists
Find Best Stocks In Any Market - Bull or Bear Market
Take A Peek At Our Top Ten Stocks Lists: Daily, Weekly, Year-to-Date & Top Trends
Find Best Stocks In Any Market - Bull or Bear Market
Take A Peek At Our Top Ten Stocks Lists: Daily, Weekly, Year-to-Date & Top Trends
Latin America Stocks With Best Up Trends [0-bearish to 100-bullish]: Alamos Gold[100], IMAX [100], Methanex [93], Kinross Gold[93], SilverCrest Metals[93], Agnico Eagle[93], Hudbay Minerals[93], Ivanhoe Electric[93], Pan American[90], Suncor Energy[88], IAMGOLD [88]
Best Latin America Stocks Year-to-Date:
Aurora Cannabis[1275.47%], Fusion [121.04%], D-Wave Quantum[89.2%], Banco Macro[71.53%], Grupo Financiero[63.89%], McEwen Mining[55.89%], Banco BBVA[52.76%], Canopy Growth[51.57%], OrganiGram [46.56%], IAMGOLD [46.25%], Celestica [43.1%] Best Latin America Stocks This Week:
Controladora Vuela[12.34%], TransAlta [7.84%], SilverCrest Metals[7.35%], Canada Goose[5.19%], Lululemon Athletica[4.66%], IMAX [4.38%], Silvercorp Metals[3.82%], Agnico Eagle[3.74%], BRF S.A[3.61%], Hudbay Minerals[3.41%], Kinross Gold[3.32%] Best Latin America Stocks Daily:
Ambipar Emergency[13.26%], Vision Marine[7.40%], Northern Dynasty[6.14%], Fortuna Silver[4.43%], Inter & Co[4.34%], Petroleo Brasileiro[3.98%], Endeavour Silver[3.75%], SSR Mining[3.50%], Sendas Distribuidora[3.36%], Lavoro [3.24%], IRSA Inversiones[3.11%]