
 Login Sign Up


| |||||
 |  | ||||

| 12Stocks.com Market Intelligence |
Best Japan Stocks
|
On this page, you will find the most comprehensive analysis of Japanese stocks and ETFs - from latest trends to performances to charts ➞. First, Year-to-Date (YTD) performances of the most requested Japan & other Asia-Pacific stocks at 12Stocks.com (click stock for review):
| Alibaba 97% | ||
| NetEase 85% | ||
| Baidu 67% | ||
| Mizuho Financial 37% | ||
| Nomura 34% | ||
| Taiwan Semiconductor 31% | ||
| Orix 30% | ||
| Honda Motor 23% | ||
| Sumitomo Mitsui 17% | ||
| Toyota Motor 6% | ||
| AU Optronics 0% | ||
| Bitauto 0% | ||
| China Eastern 0% | ||
| China Mobile 0% | ||
| Kyocera 0% | ||
| China Life 0% | ||
| Melco Crown 0% | ||
| Mitsubishi UFJ 0% | ||
| PetroChina 0% | ||
| Sony 0% | ||
| China Southern 0% | ||
| New Oriental -12% | ||
| In a hurry? Japan Stocks Lists: Performance Trends Table, Stock Charts
Sort Japan stocks: Daily, Weekly, Year-to-Date, Market Cap & Trends. |
| 12Stocks.com Japan Stocks Performances & Trends Daily | |||||||||
|
| 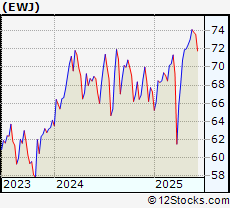 The overall Smart Investing & Trading Score is 80 (0-bearish to 100-bullish) which puts Japan index in short term neutral to bullish trend. The Smart Investing & Trading Score from previous trading session is 100 and hence a deterioration of trend.
| ||||||||
Here are the Smart Investing & Trading Scores of the most requested Japan stocks at 12Stocks.com (click stock name for detailed review):
|


| 12Stocks.com: Top Performing Japan Index Stocks | ||||||||||||||||||||||||||||||||||||||||||||||||
 The top performing Japan Index stocks year to date are
Now, more recently, over last week, the top performing Japan Index stocks on the move are


|
||||||||||||||||||||||||||||||||||||||||||||||||
| 12Stocks.com: Investing in Japan Index with Stocks | |
|
The following table helps investors and traders sort through current performance and trends (as measured by Smart Investing & Trading Score) of various
stocks in the Japan Index. Quick View: Move mouse or cursor over stock symbol (ticker) to view short-term technical chart and over stock name to view long term chart. Click on  to add stock symbol to your watchlist and to add stock symbol to your watchlist and  to view watchlist. Click on any ticker or stock name for detailed market intelligence report for that stock. to view watchlist. Click on any ticker or stock name for detailed market intelligence report for that stock. |
12Stocks.com Performance of Stocks in Japan Index
| Ticker | Stock Name | Watchlist | Category | Recent Price | Smart Investing & Trading Score | Change % | YTD Change% |
| TM | Toyota Motor |   | Services & Goods | 201.38 | 100 | 1.24% | 6.33% |
| SMFG | Sumitomo Mitsui | | Financials | 16.61 | 50 | 0.06% | 17.21% |
| DCM | NTT DOCOMO | | Technology | 4.16 | 10 | -0.72% | 0.00% |
| MTU | Mitsubishi UFJ | | Financials | 6.64 | 10 | 0.00% | 0.00% |
| NTT | Nippon Telegraph | | Technology | 9.25 | 10 | 0.00% | 0.00% |
| MFG | Mizuho Financial | | Financials | 6.56 | 40 | -0.15% | 36.64% |
| SNE | Sony | | Technology | 288.85 | 100 | 194.57% | 0.00% |
| TAK | Takeda Pharmaceutical | | Health Care | 15.09 | 20 | -0.20% | 16.51% |
| HMC | Honda Motor | | Services & Goods | 34.12 | 90 | 0.65% | 22.99% |
| CAJ | Canon | | Consumer Staples | 1.71 | 10 | 0.00% | 0.00% |
| IX | Orix | | Financials | 26.96 | 60 | -0.37% | 29.64% |
| NMR | Nomura | | Financials | 7.49 | 50 | -0.79% | 33.89% |
| KYO | Kyocera | | Technology | 1.29 | 20 | -5.15% | 0.00% |
| LN | LINE | | Technology | 20.80 | 30 | -0.29% | 0.00% |
| IIJI | Internet Initiative | | Technology | 31.11 | 70 | -2.63% | 0.00% |
| SYT | SYLA | | Technology | 1.50 | 0 | 0.00% | -25.00% |
| For chart view version of above stock list: Chart View ➞ 0 - 25 | ||
 | Click To Change The Sort Order: By Market Cap or Company Size Performance: Year-to-date, Week and Day |  |
|
Get the most comprehensive stock market coverage daily at 12Stocks.com ➞ Best Stocks Today ➞ Best Stocks Weekly ➞ Best Stocks Year-to-Date ➞ Best Stocks Trends ➞  Best Stocks Today 12Stocks.com Best Nasdaq Stocks ➞ Best S&P 500 Stocks ➞ Best Tech Stocks ➞ Best Biotech Stocks ➞ |
| Detailed Overview of Japan Stocks |
| Japan Technical Overview, Leaders & Laggards, Top Japan ETF Funds & Detailed Japan Stocks List, Charts, Trends & More |
| Japan: Technical Analysis, Trends & YTD Performance | |
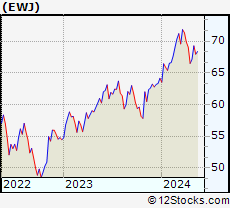
 EWJ Weekly Chart |
|
| Long Term Trend: Very Good | |
| Medium Term Trend: Very Good | |
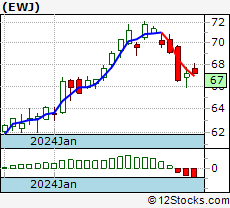
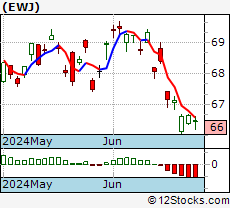 EWJ Daily Chart |
|
| Short Term Trend: Good | |
| Overall Trend Score: 80 | |
| YTD Performance: 22.1119% | |
| **Trend Scores & Views Are Only For Educational Purposes And Not For Investing | |
| 12Stocks.com: Investing in Japan Index using Exchange Traded Funds | |
|
The following table shows list of key exchange traded funds (ETF) that
help investors play Japan stock market. For detailed view, check out our ETF Funds section of our website. Quick View: Move mouse or cursor over ETF symbol (ticker) to view short-term technical chart and over ETF name to view long term chart. Click on ticker or stock name for detailed view. Click on to add stock symbol to your watchlist and to view watchlist. |
12Stocks.com List of ETFs that track Japan Index
| Ticker | ETF Name | Watchlist | Recent Price | Smart Investing & Trading Score | Change % | Week % | Year-to-date % |
| JPNL | Japan Bull 3X | | 4.93 | 10 | -2.95276 | -94.147 | 0% |
| SCIJ | Scientific Beta Japan | | 21.85 | 80 | -0.273848 | 6.84597 | 0% |
| JHDG | Japan Hedged Qual | | 120.75 | 30 | -3.02763 | -11.2263 | 0% |
| DXJS | Japan Hedged SmallCap | | 39.83 | 100 | 1.59672 | 6.36479 | 15.2677% |
| DXJR | Japan Hedged Real | | 17.49 | 20 | 0.0572082 | -13.9695 | 0% |
| DXJH | Japan Hedged Health | | 31.21 | 70 | -1.39021 | 5.40358 | 0% |
| DXJF | Japan Hedged Financials | | 53.78 | 80 | -0.278138 | 164.535 | 0% |
| DXJC | Japan Hedged | | 9.72 | 50 | 0.206186 | -41.1622 | 0% |
| DEWJ | Adaptive Ccy Hdgd | | 24.47 | 70 | -0.0408497 | 2.42779 | 0% |
| ALD | Asia Local Debt | | 31.68 | 70 | -0.0946074 | 6.30872 | 0% |
| HFXJ | 50 Percent Hedged | | 67.14 | 40 | -1.69839 | -0.385757 | 0% |
| 12Stocks.com: Charts, Trends, Fundamental Data and Performances of Japan Stocks | |
|
We now take in-depth look at all Japan stocks including charts, multi-period performances and overall trends (as measured by Smart Investing & Trading Score). One can sort Japan stocks (click link to choose) by Daily, Weekly and by Year-to-Date performances. Also, one can sort by size of the company or by market capitalization. |
| Select Your Default Chart Type: | |||||
| |||||
| Click on stock symbol or name for detailed view. Click on to add stock symbol to your watchlist and to view watchlist. Quick View: Move mouse or cursor over "Daily" to quickly view daily technical stock chart and over "Weekly" to view weekly technical stock chart. | |||||
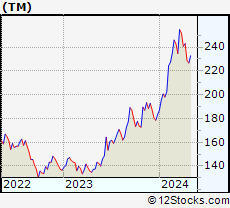 | TM Toyota Motor Corporation ADR |
| Sector: Services & Goods | |
| SubSector: Auto Manufacturers | |
| MarketCap: 260173 Millions | |
| Recent Price: 201.38 Smart Investing & Trading Score: 100 | |
| Day Percent Change: 1.23922% Day Change: -1.92 | |
| Week Change: 0.288845% Year-to-date Change: 6.3% | |
| TM Links: Profile News Message Board | |
| Charts:- Daily , Weekly | |
| Add TM to Watchlist: View: Get Complete TM Trend Analysis ➞ | |
 | SMFG Sumitomo Mitsui Financial Group Inc ADR |
| Sector: Financials | |
| SubSector: Banks - Diversified | |
| MarketCap: 104905 Millions | |
| Recent Price: 16.61 Smart Investing & Trading Score: 50 | |
| Day Percent Change: 0.060241% Day Change: -0.16 | |
| Week Change: 0.180941% Year-to-date Change: 17.2% | |
| SMFG Links: Profile News Message Board | |
| Charts:- Daily , Weekly | |
| Add SMFG to Watchlist: View: Get Complete SMFG Trend Analysis ➞ | |
 | DCM NTT DOCOMO, Inc. |
| Sector: Technology | |
| SubSector: Diversified Communication Services | |
| MarketCap: 94439.2 Millions | |
| Recent Price: 4.16 Smart Investing & Trading Score: 10 | |
| Day Percent Change: -0.71599% Day Change: -9999 | |
| Week Change: -99.9887% Year-to-date Change: 0.0% | |
| DCM Links: Profile News Message Board | |
| Charts:- Daily , Weekly | |
| Add DCM to Watchlist: View: Get Complete DCM Trend Analysis ➞ | |
 | MTU Mitsubishi UFJ Financial Group, Inc. |
| Sector: Financials | |
| SubSector: Money Center Banks | |
| MarketCap: 94306.7 Millions | |
| Recent Price: 6.64 Smart Investing & Trading Score: 10 | |
| Day Percent Change: 0% Day Change: -9999 | |
| Week Change: 0% Year-to-date Change: 0.0% | |
| MTU Links: Profile News Message Board | |
| Charts:- Daily , Weekly | |
| Add MTU to Watchlist: View: Get Complete MTU Trend Analysis ➞ | |
 | NTT Nippon Telegraph and Telephone Corporation |
| Sector: Technology | |
| SubSector: Telecom Services - Foreign | |
| MarketCap: 90891.7 Millions | |
| Recent Price: 9.25 Smart Investing & Trading Score: 10 | |
| Day Percent Change: 0% Day Change: -9999 | |
| Week Change: -82.8163% Year-to-date Change: 0.0% | |
| NTT Links: Profile News Message Board | |
| Charts:- Daily , Weekly | |
| Add NTT to Watchlist: View: Get Complete NTT Trend Analysis ➞ | |
 | MFG Mizuho Financial Group, Inc. ADR |
| Sector: Financials | |
| SubSector: Banks - Regional | |
| MarketCap: 81353.5 Millions | |
| Recent Price: 6.56 Smart Investing & Trading Score: 40 | |
| Day Percent Change: -0.152207% Day Change: -0.06 | |
| Week Change: -1.05581% Year-to-date Change: 36.6% | |
| MFG Links: Profile News Message Board | |
| Charts:- Daily , Weekly | |
| Add MFG to Watchlist: View: Get Complete MFG Trend Analysis ➞ | |
 | SNE Sony Corporation |
| Sector: Technology | |
| SubSector: Electronic Equipment | |
| MarketCap: 74750.9 Millions | |
| Recent Price: 288.85 Smart Investing & Trading Score: 100 | |
| Day Percent Change: 194.565% Day Change: -9999 | |
| Week Change: 193.696% Year-to-date Change: 0.0% | |
| SNE Links: Profile News Message Board | |
| Charts:- Daily , Weekly | |
| Add SNE to Watchlist: View: Get Complete SNE Trend Analysis ➞ | |
 | TAK Takeda Pharmaceutical Co ADR |
| Sector: Health Care | |
| SubSector: Drug Manufacturers - Specialty & Generic | |
| MarketCap: 48109.6 Millions | |
| Recent Price: 15.09 Smart Investing & Trading Score: 20 | |
| Day Percent Change: -0.198413% Day Change: -0.17 | |
| Week Change: -1.17878% Year-to-date Change: 16.5% | |
| TAK Links: Profile News Message Board | |
| Charts:- Daily , Weekly | |
| Add TAK to Watchlist: View: Get Complete TAK Trend Analysis ➞ | |
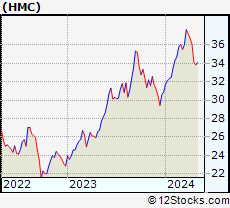 | HMC Honda Motor ADR |
| Sector: Services & Goods | |
| SubSector: Auto Manufacturers | |
| MarketCap: 46777.5 Millions | |
| Recent Price: 34.12 Smart Investing & Trading Score: 90 | |
| Day Percent Change: 0.648968% Day Change: -0.6 | |
| Week Change: -2.09469% Year-to-date Change: 23.0% | |
| HMC Links: Profile News Message Board | |
| Charts:- Daily , Weekly | |
| Add HMC to Watchlist: View: Get Complete HMC Trend Analysis ➞ | |
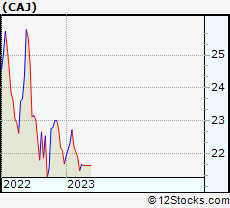 | CAJ Canon Inc. |
| Sector: Consumer Staples | |
| SubSector: Business Equipment | |
| MarketCap: 31754.7 Millions | |
| Recent Price: 1.71 Smart Investing & Trading Score: 10 | |
| Day Percent Change: 0% Day Change: -9999 | |
| Week Change: -92.1811% Year-to-date Change: 0.0% | |
| CAJ Links: Profile News Message Board | |
| Charts:- Daily , Weekly | |
| Add CAJ to Watchlist: View: Get Complete CAJ Trend Analysis ➞ | |
 | IX Orix Corporation ADR |
| Sector: Financials | |
| SubSector: Financial Conglomerates | |
| MarketCap: 29685.2 Millions | |
| Recent Price: 26.96 Smart Investing & Trading Score: 60 | |
| Day Percent Change: -0.369549% Day Change: -0.27 | |
| Week Change: 1.96672% Year-to-date Change: 29.6% | |
| IX Links: Profile News Message Board | |
| Charts:- Daily , Weekly | |
| Add IX to Watchlist: View: Get Complete IX Trend Analysis ➞ | |
 | NMR Nomura Holdings Inc. ADR |
| Sector: Financials | |
| SubSector: Capital Markets | |
| MarketCap: 21257.9 Millions | |
| Recent Price: 7.49 Smart Investing & Trading Score: 50 | |
| Day Percent Change: -0.794702% Day Change: -0.05 | |
| Week Change: 1.21622% Year-to-date Change: 33.9% | |
| NMR Links: Profile News Message Board | |
| Charts:- Daily , Weekly | |
| Add NMR to Watchlist: View: Get Complete NMR Trend Analysis ➞ | |
 | KYO Kyocera Corporation |
| Sector: Technology | |
| SubSector: Diversified Electronics | |
| MarketCap: 20759.9 Millions | |
| Recent Price: 1.29 Smart Investing & Trading Score: 20 | |
| Day Percent Change: -5.14706% Day Change: -9999 | |
| Week Change: -89.9922% Year-to-date Change: 0.0% | |
| KYO Links: Profile News Message Board | |
| Charts:- Daily , Weekly | |
| Add KYO to Watchlist: View: Get Complete KYO Trend Analysis ➞ | |
 | LN LINE Corporation |
| Sector: Technology | |
| SubSector: Application Software | |
| MarketCap: 11338.1 Millions | |
| Recent Price: 20.80 Smart Investing & Trading Score: 30 | |
| Day Percent Change: -0.287632% Day Change: -9999 | |
| Week Change: 23.7359% Year-to-date Change: 0.0% | |
| LN Links: Profile News Message Board | |
| Charts:- Daily , Weekly | |
| Add LN to Watchlist: View: Get Complete LN Trend Analysis ➞ | |
 | IIJI Internet Initiative Japan Inc. |
| Sector: Technology | |
| SubSector: Communication Equipment | |
| MarketCap: 833.51 Millions | |
| Recent Price: 31.11 Smart Investing & Trading Score: 70 | |
| Day Percent Change: -2.62911% Day Change: -9999 | |
| Week Change: 913.355% Year-to-date Change: 0.0% | |
| IIJI Links: Profile News Message Board | |
| Charts:- Daily , Weekly | |
| Add IIJI to Watchlist: View: Get Complete IIJI Trend Analysis ➞ | |
 | SYT SYLA Technologies Co., Ltd. |
| Sector: Technology | |
| SubSector: Software - Application | |
| MarketCap: 187 Millions | |
| Recent Price: 1.50 Smart Investing & Trading Score: 0 | |
| Day Percent Change: 0% Day Change: -9999 | |
| Week Change: -29.2453% Year-to-date Change: -25.0% | |
| SYT Links: Profile News Message Board | |
| Charts:- Daily , Weekly | |
| Add SYT to Watchlist: View: Get Complete SYT Trend Analysis ➞ | |
| For tabular summary view of above stock list: Summary View ➞ 0 - 25 | ||
| Click To Change The Sort Order: By Market Cap or Company Size Performance: Year-to-date, Week and Day | |
| Select Chart Type: | ||
|
Best Stocks Today 12Stocks.com |
© 2025 12Stocks.com Terms & Conditions Privacy Contact Us
All Information Provided Only For Education And Not To Be Used For Investing or Trading. See Terms & Conditions


One More Thing ... Get Best Stocks Delivered Daily!
Never Ever Miss A Move With Our Top Ten Stocks Lists
Find Best Stocks In Any Market - Bull or Bear Market
Take A Peek At Our Top Ten Stocks Lists: Daily, Weekly, Year-to-Date & Top Trends
Find Best Stocks In Any Market - Bull or Bear Market
Take A Peek At Our Top Ten Stocks Lists: Daily, Weekly, Year-to-Date & Top Trends
Japan Stocks With Best Up Trends [0-bearish to 100-bullish]: Sony [100], Toyota Motor[100], Honda Motor[90], Internet Initiative[70], Orix [60], Sumitomo Mitsui[50], Nomura [50], Mizuho Financial[40], LINE [30], Takeda Pharmaceutical[20], Kyocera [20]
Best Japan Stocks Year-to-Date:
Mizuho Financial[36.6354%], Nomura [33.8935%], Orix [29.6397%], Honda Motor[22.9855%], Sumitomo Mitsui[17.2104%], Takeda Pharmaceutical[16.5116%], Toyota Motor[6.32973%], NTT DOCOMO[0%], Mitsubishi UFJ[0%], Nippon Telegraph[0%], Canon [0%] Best Japan Stocks This Week:
Internet Initiative[913.355%], Sony [193.696%], LINE [23.7359%], Orix [1.96672%], Nomura [1.21622%], Toyota Motor[0.288845%], Sumitomo Mitsui[0.180941%], Mitsubishi UFJ[0%], Mizuho Financial[-1.05581%], Takeda Pharmaceutical[-1.17878%], Honda Motor[-2.09469%] Best Japan Stocks Daily:
Sony [194.565%], Toyota Motor[1.23922%], Honda Motor[0.648968%], Sumitomo Mitsui[0.060241%], Mitsubishi UFJ[0%], Nippon Telegraph[0%], SYLA [0%], Canon [0%], Mizuho Financial[-0.152207%], Takeda Pharmaceutical[-0.198413%], LINE [-0.287632%]