
 Login Sign Up


| |||||
 |  | ||||

| 12Stocks.com Market Intelligence |
Best MidCap Stocks
|
| In a hurry? Mid Cap Stocks Lists: Performance Trends Table, Stock Charts
Sort midcap stocks: Daily, Weekly, Year-to-Date, Market Cap & Trends. Filter midcap stocks list by sector: Show all, Tech, Finance, Energy, Staples, Retail, Industrial, Materials, Utilities and HealthCare Filter midcap stocks list by size:All MidCap Large Mid-Range Small |
| 12Stocks.com Mid Cap Stocks Performances & Trends Daily | |||||||||
|
|  The overall Smart Investing & Trading Score is 70 (0-bearish to 100-bullish) which puts Mid Cap index in short term neutral to bullish trend. The Smart Investing & Trading Score from previous trading session is 80 and a deterioration of trend continues.
| ||||||||
Here are the Smart Investing & Trading Scores of the most requested mid cap stocks at 12Stocks.com (click stock name for detailed review):
|


| 12Stocks.com: Top Performing Mid Cap Index Stocks | ||||||||||||||||||||||||||||||||||||||||||||||||
 The top performing Mid Cap Index stocks year to date are
Now, more recently, over last week, the top performing Mid Cap Index stocks on the move are


|
||||||||||||||||||||||||||||||||||||||||||||||||
| 12Stocks.com: Investing in Midcap Index with Stocks | |
|
The following table helps investors and traders sort through current performance and trends (as measured by Smart Investing & Trading Score) of various
stocks in the Midcap Index. Quick View: Move mouse or cursor over stock symbol (ticker) to view short-term technical chart and over stock name to view long term chart. Click on  to add stock symbol to your watchlist and to add stock symbol to your watchlist and  to view watchlist. Click on any ticker or stock name for detailed market intelligence report for that stock. to view watchlist. Click on any ticker or stock name for detailed market intelligence report for that stock. |
12Stocks.com Performance of Stocks in Midcap Index
| Ticker | Stock Name | Watchlist | Category | Recent Price | Smart Investing & Trading Score | Change % | YTD Change% |
| PLTR | Palantir Technologies |   | Technology | 168.33 | 30 | -1.13% | 123.87% |
| APP | Applovin Corp | | Technology | 606.66 | 90 | 0.47% | 77.50% |
| SPOT | Spotify | | Technology | 707.19 | 70 | 0.44% | 54.48% |
| APH | Amphenol Corp | | Technology | 118.41 | 80 | -0.53% | 72.33% |
| KKR | KKR | | Financials | 144.40 | 80 | 0.01% | -2.81% |
| WELL | Welltower | | Financials | 165.91 | 20 | 0.42% | 34.84% |
| DASH | DoorDash | | Services & Goods | 259.25 | 70 | -1.46% | 51.92% |
| CRWD | Crowdstrike | | Technology | 445.50 | 70 | 0.12% | 28.26% |
| PH | Parker-Hannifin Corp | | Industrials | 738.50 | 20 | -2.06% | 17.92% |
| RCL | Royal Caribbean | | Services & Goods | 323.07 | 20 | 0.43% | 41.96% |
| CEG | Constellation Energy | | Utilities | 321.27 | 30 | -0.51% | 32.86% |
| TT | Trane Technologies | | Industrials | 397.88 | 0 | -0.53% | 9.99% |
| HOOD | Robinhood Markets | | Financials | 118.64 | 100 | 1.07% | 200.81% |
| RBLX | Roblox | | Technology | 135.38 | 80 | -0.34% | 130.08% |
| CTAS | Cintas | | Industrials | 199.98 | 30 | 0.35% | 10.23% |
| COIN | Coinbase Global | | Financials | 320.56 | 20 | -2.24% | 24.63% |
| AJG | Arthur J. | | Financials | 292.66 | 40 | 0.41% | 6.49% |
| APO | Apollo Global | | Financials | 138.82 | 70 | -0.88% | -15.77% |
| NET | Cloudflare | | Technology | 213.88 | 30 | -2.44% | 90.05% |
| BK | Bank Of | | Financials | 107.01 | 90 | 1.44% | 40.63% |
| RSG | Republic Services | | Industrials | 226.27 | 0 | 0.42% | 13.62% |
| TDG | Transdigm | | Industrials | 1275.96 | 30 | -0.45% | 1.74% |
| NU | Nu | | Financials | 15.96 | 90 | 0.44% | 50.14% |
| WMB | Williams Cos | | Energy | 59.02 | 70 | 1.85% | 7.46% |
| SPG | Simon Property | | Financials | 181.56 | 70 | 0.02% | 7.32% |
| For chart view version of above stock list: Chart View ➞ 0 - 25 , 25 - 50 , 50 - 75 , 75 - 100 , 100 - 125 , 125 - 150 , 150 - 175 , 175 - 200 , 200 - 225 , 225 - 250 , 250 - 275 , 275 - 300 , 300 - 325 , 325 - 350 , 350 - 375 , 375 - 400 , 400 - 425 , 425 - 450 , 450 - 475 , 475 - 500 , 500 - 525 , 525 - 550 , 550 - 575 , 575 - 600 , 600 - 625 , 625 - 650 , 650 - 675 , 675 - 700 , 700 - 725 , 725 - 750 , 750 - 775 | ||
 | Click To Change The Sort Order: By Market Cap or Company Size Performance: Year-to-date, Week and Day |  |
|
Get the most comprehensive stock market coverage daily at 12Stocks.com ➞ Best Stocks Today ➞ Best Stocks Weekly ➞ Best Stocks Year-to-Date ➞ Best Stocks Trends ➞  Best Stocks Today 12Stocks.com Best Nasdaq Stocks ➞ Best S&P 500 Stocks ➞ Best Tech Stocks ➞ Best Biotech Stocks ➞ |
| Detailed Overview of Midcap Stocks |
| Midcap Technical Overview, Leaders & Laggards, Top Midcap ETF Funds & Detailed Midcap Stocks List, Charts, Trends & More |
| Midcap: Technical Analysis, Trends & YTD Performance | |
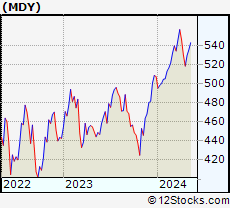
| MidCap segment as represented by
MDY, an exchange-traded fund [ETF], holds basket of about four hundred midcap stocks from across all major sectors of the US stock market. The midcap index (contains stocks like Green Mountain Coffee Roasters and Tractor Supply Company) is up by 5.88117% and is currently underperforming the overall market by -7.26563% year-to-date. Below is a quick view of technical charts and trends: | |
 MDY Weekly Chart |
|
| Long Term Trend: Very Good | |
| Medium Term Trend: Good | |
 MDY Daily Chart |
|
| Short Term Trend: Not Good | |
| Overall Trend Score: 70 | |
| YTD Performance: 5.88117% | |
| **Trend Scores & Views Are Only For Educational Purposes And Not For Investing | |
| 12Stocks.com: Investing in Midcap Index using Exchange Traded Funds | |
|
The following table shows list of key exchange traded funds (ETF) that
help investors track Midcap index. The following list also includes leveraged ETF funds that track twice or thrice the daily returns of Midcap indices. Short or inverse ETF funds move in the opposite direction to the index they track and are useful during market pullbacks or during bear markets. Quick View: Move mouse or cursor over ETF symbol (ticker) to view short-term technical chart and over ETF name to view long term chart. Click on ticker or stock name for detailed view. Click on to add stock symbol to your watchlist and to view watchlist. |
12Stocks.com List of ETFs that track Midcap Index
| Ticker | ETF Name | Watchlist | Recent Price | Smart Investing & Trading Score | Change % | Week % | Year-to-date % |
| IJH | iShares Core S&P Mid-Cap ETF | | 65.31 | 50 | -0.122343 | -0.213904 | 5.70647% |
| IWR | iShares Russell Mid-Cap ETF | | 96.01 | 40 | 0.0208355 | -0.135219 | 9.38556% |
| IWS | iShares Russell Mid-Cap Value ETF | | 138.33 | 40 | 0.00722961 | -0.180401 | 8.12607% |
| IWP | iShares Russell Mid-Cap Growth ETF | | 143.52 | 40 | -0.0696282 | -0.180832 | 12.7956% |
| MDY | S&P MidCap 400 ETF | | 598.29 | 70 | -0.0868389 | 0.125515 | 5.88117% |
| IJK | iShares S&P Mid-Cap 400 Growth ETF | | 95.93 | 50 | -0.145727 | 0.0834637 | 5.67457% |
| IJJ | iShares S&P Mid-Cap 400 Value ETF | | 129.87 | 30 | -0.130729 | -0.619835 | 5.41396% |
| XMLV | Invesco S&P MidCap Low Volatility ETF | | 63.29 | 20 | 0.269328 | -0.674827 | 5.98482% |
| UMDD | ProShares UltraPro MidCap400 3x Shares | | 25.76 | 50 | -0.313468 | 0.268587 | -1.97392% |
| MVV | ProShares Ultra MidCap400 2X Shares | | 69.56 | 50 | -0.286697 | -0.0431096 | 3.36916% |
| SMDD | ProShares UltraPro Short MidCap400 -3x Shares | | 13.28 | 50 | 0.365791 | -0.363882 | -24.841% |
| MYY | ProShares Short Midcap400 -1x Shares | | 17.96 | 50 | 0.111483 | -0.0128046 | -4.22559% |
| MZZ | ProShares UltraShort MidCap400 -2x Shares | | 8.34 | 30 | 0.404629 | 0.106861 | -13.4351% |
| 12Stocks.com: Charts, Trends, Fundamental Data and Performances of MidCap Stocks | |
|
We now take in-depth look at all MidCap stocks including charts, multi-period performances and overall trends (as measured by Smart Investing & Trading Score). One can sort MidCap stocks (click link to choose) by Daily, Weekly and by Year-to-Date performances. Also, one can sort by size of the company or by market capitalization. |
| Select Your Default Chart Type: | |||||
| |||||
| Click on stock symbol or name for detailed view. Click on to add stock symbol to your watchlist and to view watchlist. Quick View: Move mouse or cursor over "Daily" to quickly view daily technical stock chart and over "Weekly" to view weekly technical stock chart. | |||||

 | PLTR Palantir Technologies Inc |
| Sector: Technology | |
| SubSector: Software - Infrastructure | |
| MarketCap: 363230 Millions | |
| Recent Price: 168.33 Smart Investing & Trading Score: 30 | |
| Day Percent Change: -1.13356% Day Change: 0.17 | |
| Week Change: 3.67701% Year-to-date Change: 123.9% | |
| PLTR Links: Profile News Message Board | |
| Charts:- Daily , Weekly | |
| Add PLTR to Watchlist: View: Get Complete PLTR Trend Analysis ➞ | |
 | APP Applovin Corp |
| Sector: Technology | |
| SubSector: Advertising Agencies | |
| MarketCap: 165824 Millions | |
| Recent Price: 606.66 Smart Investing & Trading Score: 90 | |
| Day Percent Change: 0.473667% Day Change: 3.89 | |
| Week Change: 8.68732% Year-to-date Change: 77.5% | |
| APP Links: Profile News Message Board | |
| Charts:- Daily , Weekly | |
| Add APP to Watchlist: View: Get Complete APP Trend Analysis ➞ | |
 | SPOT Spotify Technology S.A |
| Sector: Technology | |
| SubSector: Internet Content & Information | |
| MarketCap: 143360 Millions | |
| Recent Price: 707.19 Smart Investing & Trading Score: 70 | |
| Day Percent Change: 0.444564% Day Change: -14.32 | |
| Week Change: -1.66444% Year-to-date Change: 54.5% | |
| SPOT Links: Profile News Message Board | |
| Charts:- Daily , Weekly | |
| Add SPOT to Watchlist: View: Get Complete SPOT Trend Analysis ➞ | |
 | APH Amphenol Corp |
| Sector: Technology | |
| SubSector: Electronic Components | |
| MarketCap: 134851 Millions | |
| Recent Price: 118.41 Smart Investing & Trading Score: 80 | |
| Day Percent Change: -0.529234% Day Change: -0.33 | |
| Week Change: 1.38711% Year-to-date Change: 72.3% | |
| APH Links: Profile News Message Board | |
| Charts:- Daily , Weekly | |
| Add APH to Watchlist: View: Get Complete APH Trend Analysis ➞ | |
 | KKR KKR & Co. Inc |
| Sector: Financials | |
| SubSector: Asset Management | |
| MarketCap: 120750 Millions | |
| Recent Price: 144.40 Smart Investing & Trading Score: 80 | |
| Day Percent Change: 0.0138523% Day Change: 0.69 | |
| Week Change: 5.10226% Year-to-date Change: -2.8% | |
| KKR Links: Profile News Message Board | |
| Charts:- Daily , Weekly | |
| Add KKR to Watchlist: View: Get Complete KKR Trend Analysis ➞ | |
 | WELL Welltower Inc |
| Sector: Financials | |
| SubSector: REIT - Healthcare Facilities | |
| MarketCap: 112094 Millions | |
| Recent Price: 165.91 Smart Investing & Trading Score: 20 | |
| Day Percent Change: 0.423703% Day Change: 1.27 | |
| Week Change: -1.74119% Year-to-date Change: 34.8% | |
| WELL Links: Profile News Message Board | |
| Charts:- Daily , Weekly | |
| Add WELL to Watchlist: View: Get Complete WELL Trend Analysis ➞ | |
 | DASH DoorDash Inc |
| Sector: Services & Goods | |
| SubSector: Internet Retail | |
| MarketCap: 105453 Millions | |
| Recent Price: 259.25 Smart Investing & Trading Score: 70 | |
| Day Percent Change: -1.45958% Day Change: -5.29 | |
| Week Change: 1.0603% Year-to-date Change: 51.9% | |
| DASH Links: Profile News Message Board | |
| Charts:- Daily , Weekly | |
| Add DASH to Watchlist: View: Get Complete DASH Trend Analysis ➞ | |
 | CRWD Crowdstrike Holdings Inc |
| Sector: Technology | |
| SubSector: Software - Infrastructure | |
| MarketCap: 104806 Millions | |
| Recent Price: 445.50 Smart Investing & Trading Score: 70 | |
| Day Percent Change: 0.116859% Day Change: -0.34 | |
| Week Change: 5.19232% Year-to-date Change: 28.3% | |
| CRWD Links: Profile News Message Board | |
| Charts:- Daily , Weekly | |
| Add CRWD to Watchlist: View: Get Complete CRWD Trend Analysis ➞ | |
 | PH Parker-Hannifin Corp |
| Sector: Industrials | |
| SubSector: Specialty Industrial Machinery | |
| MarketCap: 96096 Millions | |
| Recent Price: 738.50 Smart Investing & Trading Score: 20 | |
| Day Percent Change: -2.0622% Day Change: -15.59 | |
| Week Change: -2.21651% Year-to-date Change: 17.9% | |
| PH Links: Profile News Message Board | |
| Charts:- Daily , Weekly | |
| Add PH to Watchlist: View: Get Complete PH Trend Analysis ➞ | |
 | RCL Royal Caribbean Group |
| Sector: Services & Goods | |
| SubSector: Travel Services | |
| MarketCap: 95686.3 Millions | |
| Recent Price: 323.07 Smart Investing & Trading Score: 20 | |
| Day Percent Change: 0.425863% Day Change: 0.07 | |
| Week Change: -6.44059% Year-to-date Change: 42.0% | |
| RCL Links: Profile News Message Board | |
| Charts:- Daily , Weekly | |
| Add RCL to Watchlist: View: Get Complete RCL Trend Analysis ➞ | |
 | CEG Constellation Energy Corporation |
| Sector: Utilities | |
| SubSector: Utilities - Renewable | |
| MarketCap: 94215.3 Millions | |
| Recent Price: 321.27 Smart Investing & Trading Score: 30 | |
| Day Percent Change: -0.506333% Day Change: -1.37 | |
| Week Change: 6.79975% Year-to-date Change: 32.9% | |
| CEG Links: Profile News Message Board | |
| Charts:- Daily , Weekly | |
| Add CEG to Watchlist: View: Get Complete CEG Trend Analysis ➞ | |
 | TT Trane Technologies plc |
| Sector: Industrials | |
| SubSector: Building Products & Equipment | |
| MarketCap: 92083.5 Millions | |
| Recent Price: 397.88 Smart Investing & Trading Score: 0 | |
| Day Percent Change: -0.53% Day Change: -2.11 | |
| Week Change: -0.72% Year-to-date Change: 10.0% | |
| TT Links: Profile News Message Board | |
| Charts:- Daily , Weekly | |
| Add TT to Watchlist: View: Get Complete TT Trend Analysis ➞ | |
 | HOOD Robinhood Markets Inc |
| Sector: Financials | |
| SubSector: Capital Markets | |
| MarketCap: 89978.4 Millions | |
| Recent Price: 118.64 Smart Investing & Trading Score: 100 | |
| Day Percent Change: 1.07344% Day Change: 0.96 | |
| Week Change: 0.118143% Year-to-date Change: 200.8% | |
| HOOD Links: Profile News Message Board | |
| Charts:- Daily , Weekly | |
| Add HOOD to Watchlist: View: Get Complete HOOD Trend Analysis ➞ | |
 | RBLX Roblox Corporation |
| Sector: Technology | |
| SubSector: Electronic Gaming & Multimedia | |
| MarketCap: 88520.7 Millions | |
| Recent Price: 135.38 Smart Investing & Trading Score: 80 | |
| Day Percent Change: -0.338634% Day Change: -3.64 | |
| Week Change: 2.72403% Year-to-date Change: 130.1% | |
| RBLX Links: Profile News Message Board | |
| Charts:- Daily , Weekly | |
| Add RBLX to Watchlist: View: Get Complete RBLX Trend Analysis ➞ | |
 | CTAS Cintas Corporation |
| Sector: Industrials | |
| SubSector: Specialty Business Services | |
| MarketCap: 82409 Millions | |
| Recent Price: 199.98 Smart Investing & Trading Score: 30 | |
| Day Percent Change: 0.346229% Day Change: 1.11 | |
| Week Change: -1.0343% Year-to-date Change: 10.2% | |
| CTAS Links: Profile News Message Board | |
| Charts:- Daily , Weekly | |
| Add CTAS to Watchlist: View: Get Complete CTAS Trend Analysis ➞ | |
 | COIN Coinbase Global Inc |
| Sector: Financials | |
| SubSector: Financial Data & Stock Exchanges | |
| MarketCap: 76842.5 Millions | |
| Recent Price: 320.56 Smart Investing & Trading Score: 20 | |
| Day Percent Change: -2.24147% Day Change: -7.63 | |
| Week Change: 0.558379% Year-to-date Change: 24.6% | |
| COIN Links: Profile News Message Board | |
| Charts:- Daily , Weekly | |
| Add COIN to Watchlist: View: Get Complete COIN Trend Analysis ➞ | |
 | AJG Arthur J. Gallagher & Co |
| Sector: Financials | |
| SubSector: Insurance Brokers | |
| MarketCap: 76709.8 Millions | |
| Recent Price: 292.66 Smart Investing & Trading Score: 40 | |
| Day Percent Change: 0.41172% Day Change: 1.9 | |
| Week Change: -1.95645% Year-to-date Change: 6.5% | |
| AJG Links: Profile News Message Board | |
| Charts:- Daily , Weekly | |
| Add AJG to Watchlist: View: Get Complete AJG Trend Analysis ➞ | |
 | APO Apollo Global Management Inc |
| Sector: Financials | |
| SubSector: Asset Management | |
| MarketCap: 75692.1 Millions | |
| Recent Price: 138.82 Smart Investing & Trading Score: 70 | |
| Day Percent Change: -0.878258% Day Change: -1.31 | |
| Week Change: 3.27332% Year-to-date Change: -15.8% | |
| APO Links: Profile News Message Board | |
| Charts:- Daily , Weekly | |
| Add APO to Watchlist: View: Get Complete APO Trend Analysis ➞ | |
 | NET Cloudflare Inc |
| Sector: Technology | |
| SubSector: Software - Infrastructure | |
| MarketCap: 74724.9 Millions | |
| Recent Price: 213.88 Smart Investing & Trading Score: 30 | |
| Day Percent Change: -2.44481% Day Change: -6.28 | |
| Week Change: -2.14129% Year-to-date Change: 90.0% | |
| NET Links: Profile News Message Board | |
| Charts:- Daily , Weekly | |
| Add NET to Watchlist: View: Get Complete NET Trend Analysis ➞ | |
 | BK Bank Of New York Mellon Corp |
| Sector: Financials | |
| SubSector: Banks - Diversified | |
| MarketCap: 73126.4 Millions | |
| Recent Price: 107.01 Smart Investing & Trading Score: 90 | |
| Day Percent Change: 1.44089% Day Change: 1.2 | |
| Week Change: 2.13802% Year-to-date Change: 40.6% | |
| BK Links: Profile News Message Board | |
| Charts:- Daily , Weekly | |
| Add BK to Watchlist: View: Get Complete BK Trend Analysis ➞ | |
 | RSG Republic Services, Inc |
| Sector: Industrials | |
| SubSector: Waste Management | |
| MarketCap: 71725.3 Millions | |
| Recent Price: 226.27 Smart Investing & Trading Score: 0 | |
| Day Percent Change: 0.417166% Day Change: 1.23 | |
| Week Change: -1.22233% Year-to-date Change: 13.6% | |
| RSG Links: Profile News Message Board | |
| Charts:- Daily , Weekly | |
| Add RSG to Watchlist: View: Get Complete RSG Trend Analysis ➞ | |
 | TDG Transdigm Group Incorporated |
| Sector: Industrials | |
| SubSector: Aerospace & Defense | |
| MarketCap: 71623.5 Millions | |
| Recent Price: 1275.96 Smart Investing & Trading Score: 30 | |
| Day Percent Change: -0.450173% Day Change: -6.01 | |
| Week Change: -2.75362% Year-to-date Change: 1.7% | |
| TDG Links: Profile News Message Board | |
| Charts:- Daily , Weekly | |
| Add TDG to Watchlist: View: Get Complete TDG Trend Analysis ➞ | |
 | NU Nu Holdings Ltd |
| Sector: Financials | |
| SubSector: Banks - Regional | |
| MarketCap: 71027 Millions | |
| Recent Price: 15.96 Smart Investing & Trading Score: 90 | |
| Day Percent Change: 0.440529% Day Change: 0.06 | |
| Week Change: 3.23415% Year-to-date Change: 50.1% | |
| NU Links: Profile News Message Board | |
| Charts:- Daily , Weekly | |
| Add NU to Watchlist: View: Get Complete NU Trend Analysis ➞ | |
 | WMB Williams Cos Inc |
| Sector: Energy | |
| SubSector: Oil & Gas Midstream | |
| MarketCap: 69851.4 Millions | |
| Recent Price: 59.02 Smart Investing & Trading Score: 70 | |
| Day Percent Change: 1.84642% Day Change: 0.99 | |
| Week Change: 2.51867% Year-to-date Change: 7.5% | |
| WMB Links: Profile News Message Board | |
| Charts:- Daily , Weekly | |
| Add WMB to Watchlist: View: Get Complete WMB Trend Analysis ➞ | |
 | SPG Simon Property Group, Inc |
| Sector: Financials | |
| SubSector: REIT - Retail | |
| MarketCap: 68746 Millions | |
| Recent Price: 181.56 Smart Investing & Trading Score: 70 | |
| Day Percent Change: 0.0220361% Day Change: 0.21 | |
| Week Change: 1.20965% Year-to-date Change: 7.3% | |
| SPG Links: Profile News Message Board | |
| Charts:- Daily , Weekly | |
| Add SPG to Watchlist: View: Get Complete SPG Trend Analysis ➞ | |
| For tabular summary view of above stock list: Summary View ➞ 0 - 25 , 25 - 50 , 50 - 75 , 75 - 100 , 100 - 125 , 125 - 150 , 150 - 175 , 175 - 200 , 200 - 225 , 225 - 250 , 250 - 275 , 275 - 300 , 300 - 325 , 325 - 350 , 350 - 375 , 375 - 400 , 400 - 425 , 425 - 450 , 450 - 475 , 475 - 500 , 500 - 525 , 525 - 550 , 550 - 575 , 575 - 600 , 600 - 625 , 625 - 650 , 650 - 675 , 675 - 700 , 700 - 725 , 725 - 750 , 750 - 775 | ||
| Click To Change The Sort Order: By Market Cap or Company Size Performance: Year-to-date, Week and Day | |
| Select Chart Type: | ||
|
Best Stocks Today 12Stocks.com |
© 2025 12Stocks.com Terms & Conditions Privacy Contact Us
All Information Provided Only For Education And Not To Be Used For Investing or Trading. See Terms & Conditions


One More Thing ... Get Best Stocks Delivered Daily!
Never Ever Miss A Move With Our Top Ten Stocks Lists
Find Best Stocks In Any Market - Bull or Bear Market
Take A Peek At Our Top Ten Stocks Lists: Daily, Weekly, Year-to-Date & Top Trends
Find Best Stocks In Any Market - Bull or Bear Market
Take A Peek At Our Top Ten Stocks Lists: Daily, Weekly, Year-to-Date & Top Trends
Midcap Stocks With Best Up Trends [0-bearish to 100-bullish]: Plug Power[100], Lyft [100], Roivant Sciences[100], Performance Food[100], Kohl's Corp[100], Zillow [100], Ally Financial[100], Aflac [100], Zoom [100], Concentrix Corp[100], Cable One[100]
Best Midcap Stocks Year-to-Date:
Lucid [571.947%], MP Materials[307.627%], Viasat [239.559%], SSR Mining[203.343%], Robinhood Markets[200.811%], Roblox [130.082%], Palantir Technologies[123.873%], Western Digital[116.248%], Celsius [107.132%], Rocket [106.089%], Alnylam [93.3589%] Best Midcap Stocks This Week:
New Fortress[54.2857%], Plug Power[41.844%], Splunk [38.7643%], Stericycle [31.4276%], Lyft [24.3883%], QuantumScape Corp[20.2814%], Wolfspeed [16.74%], Entegris [13.3957%], Roivant Sciences[13.3531%], CIENA Corp[11.6131%], APA [11.5189%] Best Midcap Stocks Daily:
Plug Power[19.0476%], Lyft [13.2426%], Wolfspeed [10.12%], New Fortress[8%], Roivant Sciences[7.7574%], Hologic [7.68988%], XP [4.23198%], Ginkgo Bioworks[4.13923%], Performance Food[3.79989%], Kohl's Corp[3.54354%], DocuSign [3.43899%]