12Stocks.com
Market
Intelligence

Stock Charts, Performance & Trend Analysis for IJJ
iShares MidCap 400 Value

IJJ
Year-to-Date: 5.9%
This Week: 0.9%
IJJ Stock Charts
See Daily ➞
See Weekly ➞
See Monthly ➞

IJJ
Year-to-Date (YTD) Return: 5.90097%
 
All about FANG Stocks ➞
Popular Trends!AAPL ➞ MSFT ➞ TSLA ➞
S&P 500 ➞ AMZN ➞ GOOGL ➞ FB ➞
Long Term Trend: Very Good
Medium Term Trend: Not Good
Short Term Trend: Very Good
MidCap
Overall Trend Score:
70 Out Of 100
Bottomline: Neutral to Bullish Trend


Get YOUR Stock Review:

October 3, 2025 - The year-to-date (YTD) performance of MidCap 400 Value (IJJ) ETF is up 5.90097% but is underperforming the overall stock market by -8.85693%.

Recently, the weekly returns of MidCap 400 Value (IJJ) is up 0.850274% but is underperforming the overall market by -0.036875%.

New! 12Stocks.com introduces Big Monthly, Weekly & Daily Charts
View IJJ Stock Charts      Daily    Weekly    Monthly

Although long term and short term trends for iShares MidCap 400 Value are good, the mid term i.e weekly trends are deteriorating.

The overall 12Stocks.com Smart Investing & Trading Score is 70 (measures stock trend from 0-bearish to 100-bullish) which puts IJJ in short term neutral to bullish trend.

The Smart Investing & Trading Score from previous trading session is 60 and an improvement of trend continues. Scroll down for key technical charts, support & resistance levels and analysis for MidCap.

Stock Analysis for IJJ
Name: iShares MidCap 400 Value
Sector:
SubSector:
In A Glance
IJJ Technical Trend Chart View

Daily IJJ Technical Chart
Add IJJ To Watch List   View List
12Stocks.com
Short Term Trend Analysis for
70 / 100
The current technical trend score is 70 in a scale where 0 is bearish and 100 is bullish.
The technical trend score from previous session is 70.
Trend score updated daily. Not to be used for investing.
Recent Price: 130.47    
MarketCap: Millions
Day Percent Change: 0.138153%
Day Change: -0.15
Week Change: 0.850274%
Year-to-date Change: 5.90097%

Technical Levels: For the trading inclined, the following are the key levels of resistance (ceiling) and support (floor) for IJJ. Ceiling and floor levels are stock prices at which the stock trend gets resistance or support respectively and traders have an eye on them. Long term levels are more important. Stocks that have broken thru their resistance or supports convincingly tend to have stronger trends (confirm with charts above visually).
Key Levels for IJJ
 Short TermWeeklyLong Term
Resistance (Ceiling)127.6128.69129.17
Support (Floor)126.58123.1123.09

The table below shows stocks similar to iShares MidCap 400 Value , i.e, from same subsector or sector along with year-to-date (YTD), weekly & daily performaces for comparison. Usually, stocks from similar sector tend to move together but companies that have innovative products, services or good management tend to outperform. Quick View: Move mouse or cursor over stock symbol (ticker) to view short-term technical chart and over stock name to view long term chart. Click on ticker or stock name for detailed view. Click on to add stock symbol to your watchlist and to view watchlist.
TickerStock NameWatchlistCategoryRecent PriceChange %Weekly Change%YTD Change%
GOOGAlphabet Inc Internet Content & Information246.430.362466-0.56490329.5745%
LRCXLam Research Corp Semiconductor146.952.9133714.5184103.976%
SNPSSynopsys, Inc Software471.08-3.621260.638766-2.4174%
VRTXVertex Pharmaceuticals, Inc Biotechnology408.851.147928.55770.761534%
CDNSCadence Design Systems, Inc Software347.24-1.34386-2.7229916.6566%
AJGArthur J. Gallagher & Co Insurance308.670.925321.3528212.3184%
URIUnited Rentals, Inc Services978.221.588924.5352542.4971%
ORealty Income Corp REIT60.08-0.6285150.16672218.0634%
WCNWaste Connections Inc Industrial173.03-1.193470.452832.35433%
RKTRocket Companies Inc Housing18.37-6.22767-6.2276778.9158%
MLMMartin Marietta Materials, Inc Housing627.871.259563.4723123.3561%
FICOFair Isaac Corp Software1784.6817.97915.6495-10.5836%
WABWestinghouse Air Brake Technologies Corp Delivery197.87-0.3475022.891174.97528%
RJFRaymond James Financial, Inc Brokers166.460.337553-3.170268.13374%
BROBrown & Brown, Inc Insurance93.450.7438550.246728-6.7942%
TWTradeweb Markets Inc Brokers107.980.35316-2.47471-17.6385%
ROLRollins, Inc Services58.310.3096513.9208727.7887%
WRBW.R. Berkley Corp Insurance76.181.021081.8313132.5494%
REGRegency Centers Corporation REIT71.88-0.2913030.7004761.48887%
ATOAtmos Energy Corp Utilities168.85-0.3129061.2472323.4961%
NVRNVR Inc Housing8071.610.4371320.4352571.02279%
STESteris Plc Instrument242.400.455864-1.4594120.3193%
CHDChurch & Dwight Co., Inc Staples88.400.5459511.77297-14.3635%
LIILennox International Inc Housing546.611.77824.62637-9.17671%
FSTFAST Acquisition Corp. Financial10.18000%
You can find complete coverage in the following
Related Pages: 2025 Best Performing Stocks, 2025 Best Performing ETF Funds

Technical Levels: For the trading inclined, the following are the key levels of resistance (ceiling) and support (floor) for IJJ. Ceiling and floor levels are stock prices at which the stock trend gets resistance or support respectively. Stocks & their trends tend to pause at these levels and hence traders have an eye on them.

Long term levels are more important. Stocks that have broken thru their resistance or support levels convincingly tend to have stronger trends (confirm with charts above visually).
Key Technical Levels for IJJ
 Short TermWeeklyLong Term
Resistance (Ceiling)127.6128.69129.17
Support (Floor)126.58123.1123.09

        
RELATIVE PERFORMANCE OF
iShares MidCap 400 Value
Vs
THE MARKET
Relative performance of iShares MidCap 400 Value
How is IJJ faring versus the market [S&P 500] ? Is it lagging or leading ? How is its relative performance ?
Symbol Day Change Week Change Year-to-Date Change
VTI 0.145759% 0.887149% 14.7579%
IJJ 0.138153% 0.850274% 5.90097%

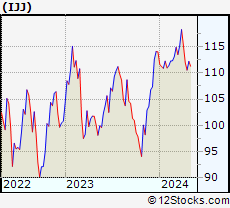
IJJ Daily Chart

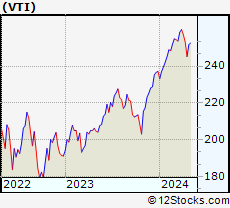
Total Market Daily Chart
Year to date returns IJJ is underperforming the market by -8.85693%
This week, IJJ is underperforming the market by -0.036875%


List Of ETF Funds Similar To iShares MidCap 400 Value

The table below shows ETFs (Exchange Traded Funds) similar to iShares MidCap 400 Value , i.e, from same sector along with year-to-date (YTD), weekly & daily performaces for comparison. Usually, ETFs and associated stocks from similar sector tend to move together but companies that have innovative products, services or good management tend to outperform. Move mouse or cursor over ETF symbol to view short-term technical chart and over ETF name to view long term chart. Click on to add ETF symbol to your watchlist and to view watchlist.
TickerStock NameWatchlistCategoryRecent PriceChange %Weekly Change%YTD Change%
DIADIAMONDS Dow  General465.110.1830870.88716310.6604%
IWNiShares Russell 2000 Value Index General178.040.2759790.6671949.458%
IWSiShares Russell Midcap Value Index General140.240.2932131.24179.61902%
EFViShares Foreign LargeCap Value Global68.06-0.2491571.4155933.0482%
VYMVanguard High Dividend General140.91-0.1204990.27754111.956%
IWMiShares Russell 2000 Index General244.040.6392021.0099310.9091%
SRTYProShares Triple Short Russel 2000 General11.47-1.88195-2.79661-37.6091%
TWMProShares UltraShort Russell 2000  General33.32-1.21554-1.76887-23.3967%
URTYProShares UltraPro Russel2000 General54.321.818182.664910.6145%
UWMProShares Ultra Russell 2000  General47.151.245441.7699112.6775%
SMDDProShares Triple Short Midcap General13.01-0.306513-1.99919-26.369%
MZZProShares Double Short MidCap400 General8.16-0.237155-1.19976-15.2687%
MDYMidCap SPDRs General598.780.1354580.7996235.96788%
UMDDProShares UltraPro Midcap General25.880.6220842.09476-1.51345%
QQQNASDAQ 100  General605.730.4111061.615519.0275%
SQQQProShares Triple Short Nasdaq 100 General14.84-1.13324-4.44366-51.3663%
SDOWProShares Triple Short Dow 30 General35.47-0.504909-2.34031-29.3485%
SPXUProShares Triple Short S&P 500 General13.34-0.224383-3.26323-40.0301%
SDSProShares Double Short S&P 500 General14.33-0.139373-2.1843-25.9516%
VXXS&P 500 VIX Short-Term Futures ETN General33.441.42554-1.2404-28.608%
Get the most comprehensive stock market coverage daily at 12Stocks.com ➞
Best Stocks Today ➞
Best Stocks Weekly ➞
Best Stocks Year-to-Date ➞
Best Stocks Trends ➞


Best Stocks Today
12Stocks.com


Best Nasdaq Stocks ➞
Best S&P 500 Stocks ➞
Best Tech Stocks ➞
Best Biotech Stocks ➞
 

© 2025 12Stocks.com       Terms & Conditions   Privacy   Contact Us
All Information Provided Only For Education And Not To Be Used For Investing or Trading. See Terms & Conditions

 WatchListmy12Stocks
Best Stocks Today