
 Login Sign Up


| |||||
 |  | ||||

| 12Stocks.com Market Intelligence |
Best Tech Stocks
| In a hurry? Tech Stocks Lists: Performance & Trends, Stock Charts, FANG Stocks
Sort Tech stocks: Daily, Weekly, Year-to-Date, Market Cap & Trends. Filter Tech stocks list by size:All Tech Large Mid-Range Small and MicroCap |
| 12Stocks.com Tech Stocks Performances & Trends Daily | |||||||||
|
|  The overall Smart Investing & Trading Score is 90 (0-bearish to 100-bullish) which puts Technology sector in short term bullish trend. The Smart Investing & Trading Score from previous trading session is 100 and hence a deterioration of trend.
| ||||||||
Here are the Smart Investing & Trading Scores of the most requested Technology stocks at 12Stocks.com (click stock name for detailed review):
|


| 12Stocks.com: Investing in Technology sector with Stocks | |
|
The following table helps investors and traders sort through current performance and trends (as measured by Smart Investing & Trading Score) of various
stocks in the Tech sector. Quick View: Move mouse or cursor over stock symbol (ticker) to view short-term technical chart and over stock name to view long term chart. Click on  to add stock symbol to your watchlist and to add stock symbol to your watchlist and  to view watchlist. Click on any ticker or stock name for detailed market intelligence report for that stock. to view watchlist. Click on any ticker or stock name for detailed market intelligence report for that stock. |
12Stocks.com Performance of Stocks in Tech Sector
| Ticker | Stock Name | Watchlist | Category | Recent Price | Smart Investing & Trading Score | Change % | YTD Change% |
| NVDA | NVIDIA Corp |   | Semiconductors | 177.82 | 70 | 0.37% | 28.59% |
| MSFT | Microsoft | | Software - Infrastructure | 509.90 | 80 | 1.77% | 22.28% |
| AAPL | Apple | | Consumer Electronics | 234.07 | 70 | 1.76% | -3.67% |
| GOOGL | Alphabet | | Internet Content & Information | 240.80 | 90 | 0.18% | 27.42% |
| GOOG | Alphabet | | Internet Content & Information | 241.38 | 90 | 0.25% | 26.92% |
| META | Meta Platforms | | Internet Content & Information | 755.59 | 40 | 0.62% | 26.30% |
| AVGO | Broadcom | | Semiconductors | 359.87 | 90 | 0.07% | 55.97% |
| TSM | Taiwan Semiconductor | | Semiconductors | 259.33 | 100 | 0.16% | 29.62% |
| ORCL | Oracle Corp | | Software - Infrastructure | 292.18 | 70 | -5.09% | 77.45% |
| NFLX | Netflix | | Entertainment | 1188.44 | 20 | -1.25% | 34.03% |
| PLTR | Palantir | | Software - Infrastructure | 171.43 | 90 | 4.30% | 128.00% |
| SAP | Sap SE | | Software - | 257.16 | 0 | -0.40% | 6.70% |
| ASML | ASML Holding | | Semiconductor | 813.87 | 100 | 1.21% | 17.07% |
| TMUS | T-Mobile US | | Telecom | 241.72 | 50 | 0.14% | 10.88% |
| CSCO | Cisco Systems | | Communication | 66.52 | 0 | -1.70% | 14.76% |
| AMD | Advanced Micro | | Semiconductors | 158.57 | 40 | 1.86% | 31.45% |
| CRM | Salesforce | | Software - | 242.76 | 10 | -1.43% | -26.35% |
| IBM | IBM Corp | | IT | 253.44 | 40 | -1.39% | 17.56% |
| DIS | Walt Disney | | Entertainment | 115.96 | 0 | -0.96% | 5.08% |
| T | AT&T | | Telecom | 29.57 | 90 | 0.27% | 33.92% |
| SHOP | Shopify | | Software - | 143.38 | 70 | -1.14% | 33.34% |
| NOW | ServiceNow | | Software - | 928.96 | 40 | -0.99% | -11.89% |
| UBER | Uber | | Software - | 95.89 | 80 | 1.28% | 51.80% |
| INTU | Intuit | | Software - | 646.03 | 0 | -2.19% | 4.23% |
| VZ | Verizon | | Telecom | 43.97 | 60 | -0.39% | 14.96% |
| For chart view version of above stock list: Chart View ➞ 0 - 25 , 25 - 50 , 50 - 75 , 75 - 100 , 100 - 125 , 125 - 150 , 150 - 175 , 175 - 200 , 200 - 225 , 225 - 250 , 250 - 275 , 275 - 300 , 300 - 325 , 325 - 350 , 350 - 375 , 375 - 400 , 400 - 425 , 425 - 450 , 450 - 475 , 475 - 500 , 500 - 525 , 525 - 550 , 550 - 575 , 575 - 600 , 600 - 625 , 625 - 650 , 650 - 675 , 675 - 700 , 700 - 725 , 725 - 750 , 750 - 775 , 775 - 800 , 800 - 825 , 825 - 850 , 850 - 875 , 875 - 900 | ||
 | Click To Change The Sort Order: By Market Cap or Company Size Performance: Year-to-date, Week and Day |  |
|
Get the most comprehensive stock market coverage daily at 12Stocks.com ➞ Best Stocks Today ➞ Best Stocks Weekly ➞ Best Stocks Year-to-Date ➞ Best Stocks Trends ➞  Best Stocks Today 12Stocks.com Best Nasdaq Stocks ➞ Best S&P 500 Stocks ➞ Best Tech Stocks ➞ Best Biotech Stocks ➞ |
| Detailed Overview of Tech Stocks |
| Tech Technical Overview, Leaders & Laggards, Top Tech ETF Funds & Detailed Tech Stocks List, Charts, Trends & More |
| Tech Sector: Technical Analysis, Trends & YTD Performance | |
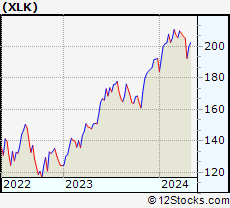
| Technology sector is composed of stocks
from semiconductors, software, web, social media
and services subsectors. Technology sector, as represented by XLK, an exchange-traded fund [ETF] that holds basket of tech stocks (e.g, Intel, Google) is up by 17.1728% and is currently outperforming the overall market by 4.3218% year-to-date. Below is a quick view of technical charts and trends: |
|
 XLK Weekly Chart |
|
| Long Term Trend: Very Good | |
| Medium Term Trend: Good | |
 XLK Daily Chart |
|
| Short Term Trend: Very Good | |
| Overall Trend Score: 90 | |
| YTD Performance: 17.1728% | |
| **Trend Scores & Views Are Only For Educational Purposes And Not For Investing | |
| 12Stocks.com: Top Performing Technology Sector Stocks | ||||||||||||||||||||||||||||||||||||||||||||||||
 The top performing Technology sector stocks year to date are
Now, more recently, over last week, the top performing Technology sector stocks on the move are


|
||||||||||||||||||||||||||||||||||||||||||||||||
| 12Stocks.com: Investing in Tech Sector using Exchange Traded Funds | |
|
The following table shows list of key exchange traded funds (ETF) that
help investors track Tech Index. For detailed view, check out our ETF Funds section of our website. Quick View: Move mouse or cursor over ETF symbol (ticker) to view short-term technical chart and over ETF name to view long term chart. Click on ticker or stock name for detailed view. Click on to add stock symbol to your watchlist and to view watchlist. |
12Stocks.com List of ETFs that track Tech Index
| Ticker | ETF Name | Watchlist | Recent Price | Smart Investing & Trading Score | Change % | Week % | Year-to-date % |
| IGN | Tech-Multimd Ntwk | | 53.86 | 40 | 0.918119 | -20.6435 | 0% |
| 12Stocks.com: Charts, Trends, Fundamental Data and Performances of Tech Stocks | |
|
We now take in-depth look at all Tech stocks including charts, multi-period performances and overall trends (as measured by Smart Investing & Trading Score). One can sort Tech stocks (click link to choose) by Daily, Weekly and by Year-to-Date performances. Also, one can sort by size of the company or by market capitalization. |
| Select Your Default Chart Type: | |||||
| |||||
| Click on stock symbol or name for detailed view. Click on to add stock symbol to your watchlist and to view watchlist. Quick View: Move mouse or cursor over "Daily" to quickly view daily technical stock chart and over "Weekly" to view weekly technical stock chart. | |||||


 | NVDA NVIDIA Corp |
| Sector: Technology | |
| SubSector: Semiconductors | |
| MarketCap: 4058590 Millions | |
| Recent Price: 177.82 Smart Investing & Trading Score: 70 | |
| Day Percent Change: 0.366879% Day Change: 0.7 | |
| Week Change: 3.58849% Year-to-date Change: 28.6% | |
| NVDA Links: Profile News Message Board | |
| Charts:- Daily , Weekly | |
| Add NVDA to Watchlist: View: Get Complete NVDA Trend Analysis ➞ | |
 | MSFT Microsoft Corporation |
| Sector: Technology | |
| SubSector: Software - Infrastructure | |
| MarketCap: 3679420 Millions | |
| Recent Price: 509.90 Smart Investing & Trading Score: 80 | |
| Day Percent Change: 1.77442% Day Change: 10.99 | |
| Week Change: 0.379944% Year-to-date Change: 22.3% | |
| MSFT Links: Profile News Message Board | |
| Charts:- Daily , Weekly | |
| Add MSFT to Watchlist: View: Get Complete MSFT Trend Analysis ➞ | |
 | AAPL Apple Inc |
| Sector: Technology | |
| SubSector: Consumer Electronics | |
| MarketCap: 3557090 Millions | |
| Recent Price: 234.07 Smart Investing & Trading Score: 70 | |
| Day Percent Change: 1.75629% Day Change: 3.75 | |
| Week Change: -2.38135% Year-to-date Change: -3.7% | |
| AAPL Links: Profile News Message Board | |
| Charts:- Daily , Weekly | |
| Add AAPL to Watchlist: View: Get Complete AAPL Trend Analysis ➞ | |
 | GOOGL Alphabet Inc |
| Sector: Technology | |
| SubSector: Internet Content & Information | |
| MarketCap: 2843010 Millions | |
| Recent Price: 240.80 Smart Investing & Trading Score: 90 | |
| Day Percent Change: 0.178891% Day Change: 1.26 | |
| Week Change: 3.65906% Year-to-date Change: 27.4% | |
| GOOGL Links: Profile News Message Board | |
| Charts:- Daily , Weekly | |
| Add GOOGL to Watchlist: View: Get Complete GOOGL Trend Analysis ➞ | |
 | GOOG Alphabet Inc |
| Sector: Technology | |
| SubSector: Internet Content & Information | |
| MarketCap: 2843010 Millions | |
| Recent Price: 241.38 Smart Investing & Trading Score: 90 | |
| Day Percent Change: 0.24919% Day Change: 1.22 | |
| Week Change: 3.74796% Year-to-date Change: 26.9% | |
| GOOG Links: Profile News Message Board | |
| Charts:- Daily , Weekly | |
| Add GOOG to Watchlist: View: Get Complete GOOG Trend Analysis ➞ | |
 | META Meta Platforms Inc |
| Sector: Technology | |
| SubSector: Internet Content & Information | |
| MarketCap: 1890130 Millions | |
| Recent Price: 755.59 Smart Investing & Trading Score: 40 | |
| Day Percent Change: 0.624584% Day Change: 4.28 | |
| Week Change: 0.927002% Year-to-date Change: 26.3% | |
| META Links: Profile News Message Board | |
| Charts:- Daily , Weekly | |
| Add META to Watchlist: View: Get Complete META Trend Analysis ➞ | |
 | AVGO Broadcom Inc |
| Sector: Technology | |
| SubSector: Semiconductors | |
| MarketCap: 1575150 Millions | |
| Recent Price: 359.87 Smart Investing & Trading Score: 90 | |
| Day Percent Change: 0.0667353% Day Change: 3.25 | |
| Week Change: 17.5662% Year-to-date Change: 56.0% | |
| AVGO Links: Profile News Message Board | |
| Charts:- Daily , Weekly | |
| Add AVGO to Watchlist: View: Get Complete AVGO Trend Analysis ➞ | |
 | TSM Taiwan Semiconductor Manufacturing ADR |
| Sector: Technology | |
| SubSector: Semiconductors | |
| MarketCap: 1262290 Millions | |
| Recent Price: 259.33 Smart Investing & Trading Score: 100 | |
| Day Percent Change: 0.162219% Day Change: -1.27 | |
| Week Change: 10.2547% Year-to-date Change: 29.6% | |
| TSM Links: Profile News Message Board | |
| Charts:- Daily , Weekly | |
| Add TSM to Watchlist: View: Get Complete TSM Trend Analysis ➞ | |
 | ORCL Oracle Corp |
| Sector: Technology | |
| SubSector: Software - Infrastructure | |
| MarketCap: 653896 Millions | |
| Recent Price: 292.18 Smart Investing & Trading Score: 70 | |
| Day Percent Change: -5.09322% Day Change: -13.04 | |
| Week Change: 31.0224% Year-to-date Change: 77.4% | |
| ORCL Links: Profile News Message Board | |
| Charts:- Daily , Weekly | |
| Add ORCL to Watchlist: View: Get Complete ORCL Trend Analysis ➞ | |
 | NFLX Netflix Inc |
| Sector: Technology | |
| SubSector: Entertainment | |
| MarketCap: 528532 Millions | |
| Recent Price: 1188.44 Smart Investing & Trading Score: 20 | |
| Day Percent Change: -1.25135% Day Change: -15.57 | |
| Week Change: -5.49035% Year-to-date Change: 34.0% | |
| NFLX Links: Profile News Message Board | |
| Charts:- Daily , Weekly | |
| Add NFLX to Watchlist: View: Get Complete NFLX Trend Analysis ➞ | |
 | PLTR Palantir Technologies Inc |
| Sector: Technology | |
| SubSector: Software - Infrastructure | |
| MarketCap: 363230 Millions | |
| Recent Price: 171.43 Smart Investing & Trading Score: 90 | |
| Day Percent Change: 4.30153% Day Change: 0.17 | |
| Week Change: 9.79249% Year-to-date Change: 128.0% | |
| PLTR Links: Profile News Message Board | |
| Charts:- Daily , Weekly | |
| Add PLTR to Watchlist: View: Get Complete PLTR Trend Analysis ➞ | |
 | SAP Sap SE ADR |
| Sector: Technology | |
| SubSector: Software - Application | |
| MarketCap: 313277 Millions | |
| Recent Price: 257.16 Smart Investing & Trading Score: 0 | |
| Day Percent Change: -0.398931% Day Change: -1.12 | |
| Week Change: -5.086% Year-to-date Change: 6.7% | |
| SAP Links: Profile News Message Board | |
| Charts:- Daily , Weekly | |
| Add SAP to Watchlist: View: Get Complete SAP Trend Analysis ➞ | |
 | ASML ASML Holding NV |
| Sector: Technology | |
| SubSector: Semiconductor Equipment & Materials | |
| MarketCap: 307427 Millions | |
| Recent Price: 813.87 Smart Investing & Trading Score: 100 | |
| Day Percent Change: 1.20747% Day Change: 9.66 | |
| Week Change: 8.02198% Year-to-date Change: 17.1% | |
| ASML Links: Profile News Message Board | |
| Charts:- Daily , Weekly | |
| Add ASML to Watchlist: View: Get Complete ASML Trend Analysis ➞ | |
 | TMUS T-Mobile US Inc |
| Sector: Technology | |
| SubSector: Telecom Services | |
| MarketCap: 284461 Millions | |
| Recent Price: 241.72 Smart Investing & Trading Score: 50 | |
| Day Percent Change: 0.136708% Day Change: 0.27 | |
| Week Change: -4.12502% Year-to-date Change: 10.9% | |
| TMUS Links: Profile News Message Board | |
| Charts:- Daily , Weekly | |
| Add TMUS to Watchlist: View: Get Complete TMUS Trend Analysis ➞ | |
 | CSCO Cisco Systems, Inc |
| Sector: Technology | |
| SubSector: Communication Equipment | |
| MarketCap: 264469 Millions | |
| Recent Price: 66.52 Smart Investing & Trading Score: 0 | |
| Day Percent Change: -1.69942% Day Change: -1.27 | |
| Week Change: -2.16208% Year-to-date Change: 14.8% | |
| CSCO Links: Profile News Message Board | |
| Charts:- Daily , Weekly | |
| Add CSCO to Watchlist: View: Get Complete CSCO Trend Analysis ➞ | |
 | AMD Advanced Micro Devices Inc |
| Sector: Technology | |
| SubSector: Semiconductors | |
| MarketCap: 245277 Millions | |
| Recent Price: 158.57 Smart Investing & Trading Score: 40 | |
| Day Percent Change: 1.86292% Day Change: 3.15 | |
| Week Change: -1.99023% Year-to-date Change: 31.5% | |
| AMD Links: Profile News Message Board | |
| Charts:- Daily , Weekly | |
| Add AMD to Watchlist: View: Get Complete AMD Trend Analysis ➞ | |
 | CRM Salesforce Inc |
| Sector: Technology | |
| SubSector: Software - Application | |
| MarketCap: 238724 Millions | |
| Recent Price: 242.76 Smart Investing & Trading Score: 10 | |
| Day Percent Change: -1.42927% Day Change: -3.87 | |
| Week Change: -0.512274% Year-to-date Change: -26.4% | |
| CRM Links: Profile News Message Board | |
| Charts:- Daily , Weekly | |
| Add CRM to Watchlist: View: Get Complete CRM Trend Analysis ➞ | |
 | IBM International Business Machines Corp |
| Sector: Technology | |
| SubSector: Information Technology Services | |
| MarketCap: 231510 Millions | |
| Recent Price: 253.44 Smart Investing & Trading Score: 40 | |
| Day Percent Change: -1.38905% Day Change: -3.64 | |
| Week Change: 2.53257% Year-to-date Change: 17.6% | |
| IBM Links: Profile News Message Board | |
| Charts:- Daily , Weekly | |
| Add IBM to Watchlist: View: Get Complete IBM Trend Analysis ➞ | |
 | DIS Walt Disney Co |
| Sector: Technology | |
| SubSector: Entertainment | |
| MarketCap: 211994 Millions | |
| Recent Price: 115.96 Smart Investing & Trading Score: 0 | |
| Day Percent Change: -0.956611% Day Change: -1.04 | |
| Week Change: -2.39879% Year-to-date Change: 5.1% | |
| DIS Links: Profile News Message Board | |
| Charts:- Daily , Weekly | |
| Add DIS to Watchlist: View: Get Complete DIS Trend Analysis ➞ | |
 | T AT&T, Inc |
| Sector: Technology | |
| SubSector: Telecom Services | |
| MarketCap: 211580 Millions | |
| Recent Price: 29.57 Smart Investing & Trading Score: 90 | |
| Day Percent Change: 0.271278% Day Change: 0.08 | |
| Week Change: -0.0338066% Year-to-date Change: 33.9% | |
| T Links: Profile News Message Board | |
| Charts:- Daily , Weekly | |
| Add T to Watchlist: View: Get Complete T Trend Analysis ➞ | |
 | SHOP Shopify Inc |
| Sector: Technology | |
| SubSector: Software - Application | |
| MarketCap: 190816 Millions | |
| Recent Price: 143.38 Smart Investing & Trading Score: 70 | |
| Day Percent Change: -1.1377% Day Change: -2.15 | |
| Week Change: -1.21943% Year-to-date Change: 33.3% | |
| SHOP Links: Profile News Message Board | |
| Charts:- Daily , Weekly | |
| Add SHOP to Watchlist: View: Get Complete SHOP Trend Analysis ➞ | |
 | NOW ServiceNow Inc |
| Sector: Technology | |
| SubSector: Software - Application | |
| MarketCap: 190070 Millions | |
| Recent Price: 928.96 Smart Investing & Trading Score: 40 | |
| Day Percent Change: -0.993307% Day Change: -9.72 | |
| Week Change: 3.38319% Year-to-date Change: -11.9% | |
| NOW Links: Profile News Message Board | |
| Charts:- Daily , Weekly | |
| Add NOW to Watchlist: View: Get Complete NOW Trend Analysis ➞ | |
 | UBER Uber Technologies Inc |
| Sector: Technology | |
| SubSector: Software - Application | |
| MarketCap: 189752 Millions | |
| Recent Price: 95.89 Smart Investing & Trading Score: 80 | |
| Day Percent Change: 1.27799% Day Change: 1.1 | |
| Week Change: 4.25092% Year-to-date Change: 51.8% | |
| UBER Links: Profile News Message Board | |
| Charts:- Daily , Weekly | |
| Add UBER to Watchlist: View: Get Complete UBER Trend Analysis ➞ | |
 | INTU Intuit Inc |
| Sector: Technology | |
| SubSector: Software - Application | |
| MarketCap: 187586 Millions | |
| Recent Price: 646.03 Smart Investing & Trading Score: 0 | |
| Day Percent Change: -2.19373% Day Change: -12.93 | |
| Week Change: -3.33089% Year-to-date Change: 4.2% | |
| INTU Links: Profile News Message Board | |
| Charts:- Daily , Weekly | |
| Add INTU to Watchlist: View: Get Complete INTU Trend Analysis ➞ | |
 | VZ Verizon Communications Inc |
| Sector: Technology | |
| SubSector: Telecom Services | |
| MarketCap: 187121 Millions | |
| Recent Price: 43.97 Smart Investing & Trading Score: 60 | |
| Day Percent Change: -0.385138% Day Change: -0.1 | |
| Week Change: -0.475328% Year-to-date Change: 15.0% | |
| VZ Links: Profile News Message Board | |
| Charts:- Daily , Weekly | |
| Add VZ to Watchlist: View: Get Complete VZ Trend Analysis ➞ | |
| For tabular summary view of above stock list: Summary View ➞ 0 - 25 , 25 - 50 , 50 - 75 , 75 - 100 , 100 - 125 , 125 - 150 , 150 - 175 , 175 - 200 , 200 - 225 , 225 - 250 , 250 - 275 , 275 - 300 , 300 - 325 , 325 - 350 , 350 - 375 , 375 - 400 , 400 - 425 , 425 - 450 , 450 - 475 , 475 - 500 , 500 - 525 , 525 - 550 , 550 - 575 , 575 - 600 , 600 - 625 , 625 - 650 , 650 - 675 , 675 - 700 , 700 - 725 , 725 - 750 , 750 - 775 , 775 - 800 , 800 - 825 , 825 - 850 , 850 - 875 , 875 - 900 | ||
| Click To Change The Sort Order: By Market Cap or Company Size Performance: Year-to-date, Week and Day | |
| Select Chart Type: | ||
|
Best Stocks Today 12Stocks.com |
© 2025 12Stocks.com Terms & Conditions Privacy Contact Us
All Information Provided Only For Education And Not To Be Used For Investing or Trading. See Terms & Conditions


One More Thing ... Get Best Stocks Delivered Daily!
Never Ever Miss A Move With Our Top Ten Stocks Lists
Find Best Stocks In Any Market - Bull or Bear Market
Take A Peek At Our Top Ten Stocks Lists: Daily, Weekly, Year-to-Date & Top Trends
Find Best Stocks In Any Market - Bull or Bear Market
Take A Peek At Our Top Ten Stocks Lists: Daily, Weekly, Year-to-Date & Top Trends
Technology Stocks With Best Up Trends [0-bearish to 100-bullish]: Sony [100], IBEX [100], IonQ [100], Bitdeer [100], Rigetti Computing[100], Kopin Corp[100], iHeartMedia [100], Grab [100], Truecar [100], AXT [100], Daktronics [100]
Best Technology Stocks Year-to-Date:
Pagaya [311.838%], Sify [281.373%], Xunlei [259.524%], EchoStar Corp[229.187%], CuriosityStream [222.645%], Viasat [220.567%], CommScope Holding[216.085%], Oneconnect Financial[196.708%], nLIGHT [175.673%], Dave [165.809%], Digital Turbine[162.5%] Best Technology Stocks This Week:
GTT [443626%], Barracuda Networks[71050%], Mobile TeleSystems[10483.5%], Nam Tai[5033.33%], Ebix [4200.85%], Fang [4150%], NantHealth [3114.02%], Hemisphere Media[2981.82%], Yandex N.V[2935.27%], Castlight Health[1751.96%], Benefitfocus [1254.48%] Best Technology Stocks Daily:
Sony [194.565%], IBEX [36.5069%], Wolfspeed [19.15%], Warner Bros.[18.55%], IonQ [18.1934%], Latch [16.6667%], Oclaro [14.734%], Bitdeer [14.4578%], Rigetti Computing[14.26%], Kopin Corp[12.4444%], Arqit Quantum[11.4196%]