
 Login Sign Up


| |||||
 |  | ||||

| 12Stocks.com Market Intelligence |
Best Tech Stocks
| In a hurry? Tech Stocks Lists: Performance & Trends, Stock Charts, FANG Stocks
Sort Tech stocks: Daily, Weekly, Year-to-Date, Market Cap & Trends. Filter Tech stocks list by size:All Tech Large Mid-Range Small and MicroCap |
| 12Stocks.com Tech Stocks Performances & Trends Daily | |||||||||
|
|  The overall Smart Investing & Trading Score is 13 (0-bearish to 100-bullish) which puts Technology sector in short term bearish trend. The Smart Investing & Trading Score from previous trading session is 26 and hence a deterioration of trend.
| ||||||||
Here are the Smart Investing & Trading Scores of the most requested Technology stocks at 12Stocks.com (click stock name for detailed review):
|


| 12Stocks.com: Investing in Technology sector with Stocks | |
|
The following table helps investors and traders sort through current performance and trends (as measured by Smart Investing & Trading Score) of various
stocks in the Tech sector. Quick View: Move mouse or cursor over stock symbol (ticker) to view short-term technical chart and over stock name to view long term chart. Click on  to add stock symbol to your watchlist and to add stock symbol to your watchlist and  to view watchlist. Click on any ticker or stock name for detailed market intelligence report for that stock. to view watchlist. Click on any ticker or stock name for detailed market intelligence report for that stock. |
12Stocks.com Performance of Stocks in Tech Sector
| Ticker | Stock Name | Watchlist | Category | Recent Price | Smart Investing & Trading Score | Change % | YTD Change% |
| EGHT | 8x8 |   | Communication | 2.23 | 0 | -2.62% | -41.01% |
| TDS | Telephone and | | Wireless | 14.96 | 17 | -0.66% | -18.47% |
| VNET | 21Vianet | | IT | 1.47 | 5 | -2.00% | -48.78% |
| PGNY | Progyny | | Healthcare Information | 32.75 | 0 | -1.92% | -11.92% |
| SYNA | Synaptics | | Software | 83.32 | 0 | -4.08% | -26.96% |
| SANM | Sanmina | | Electronics | 58.35 | 35 | 0.76% | 13.59% |
| NVTS | Navitas Semiconductor | | Semiconductors | 3.90 | 10 | -4.18% | -52.00% |
| EXLS | ExlService | | IT | 29.41 | 17 | -0.17% | -4.67% |
| ZETA | Zeta Global | | Software - | 11.85 | 58 | 1.46% | 34.28% |
| ROG | Rogers | | Electronics | 105.82 | 10 | -3.57% | -19.88% |
| TSEM | Tower Semiconductor | | Semiconductor | 31.59 | 36 | -0.66% | 3.51% |
| DAVA | Endava | | Software | 30.09 | 15 | -2.21% | -61.35% |
| VRNS | Varonis Systems | | Software | 43.51 | 10 | -1.02% | -3.91% |
| PAYO | Payoneer Global | | Software - Infrastructure | 4.86 | 78 | 0.73% | -8.22% |
| PD | PagerDuty | | Software | 21.22 | 7 | 2.41% | -8.34% |
| NTCT | NetScout Systems | | Software | 18.94 | 20 | -1.20% | -13.71% |
| EVTC | EVERTEC | | Software | 37.09 | 8 | 0.46% | -9.40% |
| AEIS | Advanced Energy | | Electronics | 92.43 | 0 | -2.65% | -15.14% |
| MLNK | MeridianLink | | Software - | 17.15 | 10 | 2.08% | -30.76% |
| COMM | CommScope Holding | | Communication | 0.99 | 20 | -0.41% | -64.89% |
| CVLT | Commvault Systems | | Software | 94.63 | 48 | -1.05% | 18.51% |
| COMP | Compass | | Software - | 3.34 | 12 | -3.19% | -10.34% |
| BAND | Bandwidth | | Software | 17.16 | 48 | 0.23% | 18.59% |
| WK | Workiva | | Software | 76.97 | 17 | -0.12% | -24.19% |
| BMI | Badger Meter | | Instruments | 153.00 | 44 | -0.71% | -0.89% |
| For chart view version of above stock list: Chart View ➞ 0 - 25 , 25 - 50 , 50 - 75 , 75 - 100 , 100 - 125 , 125 - 150 , 150 - 175 , 175 - 200 , 200 - 225 , 225 - 250 , 250 - 275 , 275 - 300 , 300 - 325 , 325 - 350 , 350 - 375 , 375 - 400 , 400 - 425 , 425 - 450 , 450 - 475 , 475 - 500 , 500 - 525 , 525 - 550 , 550 - 575 , 575 - 600 , 600 - 625 , 625 - 650 | ||
 | Click To Change The Sort Order: By Market Cap or Company Size Performance: Year-to-date, Week and Day |  |
|
Get the most comprehensive stock market coverage daily at 12Stocks.com ➞ Best Stocks Today ➞ Best Stocks Weekly ➞ Best Stocks Year-to-Date ➞ Best Stocks Trends ➞  Best Stocks Today 12Stocks.com Best Nasdaq Stocks ➞ Best S&P 500 Stocks ➞ Best Tech Stocks ➞ Best Biotech Stocks ➞ |
| Detailed Overview of Tech Stocks |
| Tech Technical Overview, Leaders & Laggards, Top Tech ETF Funds & Detailed Tech Stocks List, Charts, Trends & More |
| Tech Sector: Technical Analysis, Trends & YTD Performance | |
| Technology sector is composed of stocks
from semiconductors, software, web, social media
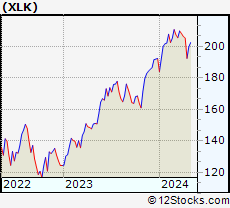
and services subsectors. Technology sector, as represented by XLK, an exchange-traded fund [ETF] that holds basket of tech stocks (e.g, Intel, Google) is up by 3.31% and is currently underperforming the overall market by -1.1% year-to-date. Below is a quick view of technical charts and trends: |
|
 XLK Weekly Chart |
|
| Long Term Trend: Good | |
| Medium Term Trend: Not Good | |
 XLK Daily Chart |
|
| Short Term Trend: Not Good | |
| Overall Trend Score: 13 | |
| YTD Performance: 3.31% | |
| **Trend Scores & Views Are Only For Educational Purposes And Not For Investing | |
| 12Stocks.com: Top Performing Technology Sector Stocks | ||||||||||||||||||||||||||||||||||||||||||||||||
 The top performing Technology sector stocks year to date are
Now, more recently, over last week, the top performing Technology sector stocks on the move are


|
||||||||||||||||||||||||||||||||||||||||||||||||
| 12Stocks.com: Investing in Tech Sector using Exchange Traded Funds | |
|
The following table shows list of key exchange traded funds (ETF) that
help investors track Tech Index. For detailed view, check out our ETF Funds section of our website. Quick View: Move mouse or cursor over ETF symbol (ticker) to view short-term technical chart and over ETF name to view long term chart. Click on ticker or stock name for detailed view. Click on to add stock symbol to your watchlist and to view watchlist. |
12Stocks.com List of ETFs that track Tech Index
| Ticker | ETF Name | Watchlist | Recent Price | Smart Investing & Trading Score | Change % | Week % | Year-to-date % |
| XLK | Technology | | 198.85 | 13 | -1.44 | -3.2 | 3.31% |
| QQQ | QQQ | | 425.84 | 26 | -1.31 | -2.84 | 3.99% |
| IYW | Technology | | 129.34 | 26 | -1.55 | -3.44 | 5.37% |
| VGT | Information Technology | | 497.69 | 26 | -1.48 | -3.3 | 2.83% |
| IXN | Global Tech | | 71.31 | 26 | -1.75 | -3.37 | 4.59% |
| IGV | Tech-Software | | 80.06 | 0 | -0.79 | -3.26 | -1.32% |
| XSD | Semiconductor | | 214.44 | 26 | -2.18 | -3.91 | -4.6% |
| TQQQ | QQQ | | 53.71 | 26 | -3.71 | -8.53 | 5.94% |
| SQQQ | Short QQQ | | 11.86 | 69 | 3.67 | 8.91 | -11.82% |
| SOXL | Semicondct Bull 3X | | 37.06 | 26 | -8.58 | -10.72 | 18.03% |
| SOXS | Semicondct Bear 3X | | 39.15 | 90 | 8.18 | 1012.22 | 572.68% |
| SOXX | PHLX Semiconductor | | 210.36 | 31 | -2.77 | -3.54 | 9.54% |
| QTEC | First -100-Tech | | 179.73 | 26 | -1.93 | -3.38 | 2.43% |
| SMH | Semiconductor | | 212.40 | 31 | -3.08 | -3.75 | 21.46% |
| 12Stocks.com: Charts, Trends, Fundamental Data and Performances of Tech Stocks | |
|
We now take in-depth look at all Tech stocks including charts, multi-period performances and overall trends (as measured by Smart Investing & Trading Score). One can sort Tech stocks (click link to choose) by Daily, Weekly and by Year-to-Date performances. Also, one can sort by size of the company or by market capitalization. |
| Select Your Default Chart Type: | |||||
| |||||
| Click on stock symbol or name for detailed view. Click on to add stock symbol to your watchlist and to view watchlist. Quick View: Move mouse or cursor over "Daily" to quickly view daily technical stock chart and over "Weekly" to view weekly technical stock chart. | |||||


 | EGHT 8x8, Inc. |
| Sector: Technology | |
| SubSector: Diversified Communication Services | |
| MarketCap: 1861.64 Millions | |
| Recent Price: 2.23 Smart Investing & Trading Score: 0 | |
| Day Percent Change: -2.62% Day Change: -0.06 | |
| Week Change: -4.29% Year-to-date Change: -41.0% | |
| EGHT Links: Profile News Message Board | |
| Charts:- Daily , Weekly | |
| Add EGHT to Watchlist: View: Get Complete EGHT Trend Analysis ➞ | |
 | TDS Telephone and Data Systems, Inc. |
| Sector: Technology | |
| SubSector: Wireless Communications | |
| MarketCap: 1851.87 Millions | |
| Recent Price: 14.96 Smart Investing & Trading Score: 17 | |
| Day Percent Change: -0.66% Day Change: -0.10 | |
| Week Change: -4.41% Year-to-date Change: -18.5% | |
| TDS Links: Profile News Message Board | |
| Charts:- Daily , Weekly | |
| Add TDS to Watchlist: View: Get Complete TDS Trend Analysis ➞ | |
 | VNET 21Vianet Group, Inc. |
| Sector: Technology | |
| SubSector: Information Technology Services | |
| MarketCap: 1846.98 Millions | |
| Recent Price: 1.47 Smart Investing & Trading Score: 5 | |
| Day Percent Change: -2.00% Day Change: -0.03 | |
| Week Change: -8.7% Year-to-date Change: -48.8% | |
| VNET Links: Profile News Message Board | |
| Charts:- Daily , Weekly | |
| Add VNET to Watchlist: View: Get Complete VNET Trend Analysis ➞ | |
 | PGNY Progyny, Inc. |
| Sector: Technology | |
| SubSector: Healthcare Information Services | |
| MarketCap: 1839.05 Millions | |
| Recent Price: 32.75 Smart Investing & Trading Score: 0 | |
| Day Percent Change: -1.92% Day Change: -0.64 | |
| Week Change: -4.24% Year-to-date Change: -11.9% | |
| PGNY Links: Profile News Message Board | |
| Charts:- Daily , Weekly | |
| Add PGNY to Watchlist: View: Get Complete PGNY Trend Analysis ➞ | |
 | SYNA Synaptics Incorporated |
| Sector: Technology | |
| SubSector: Application Software | |
| MarketCap: 1822.82 Millions | |
| Recent Price: 83.32 Smart Investing & Trading Score: 0 | |
| Day Percent Change: -4.08% Day Change: -3.54 | |
| Week Change: -8.44% Year-to-date Change: -27.0% | |
| SYNA Links: Profile News Message Board | |
| Charts:- Daily , Weekly | |
| Add SYNA to Watchlist: View: Get Complete SYNA Trend Analysis ➞ | |
 | SANM Sanmina Corporation |
| Sector: Technology | |
| SubSector: Diversified Electronics | |
| MarketCap: 1790.36 Millions | |
| Recent Price: 58.35 Smart Investing & Trading Score: 35 | |
| Day Percent Change: 0.76% Day Change: 0.44 | |
| Week Change: 0.29% Year-to-date Change: 13.6% | |
| SANM Links: Profile News Message Board | |
| Charts:- Daily , Weekly | |
| Add SANM to Watchlist: View: Get Complete SANM Trend Analysis ➞ | |
 | NVTS Navitas Semiconductor Corporation |
| Sector: Technology | |
| SubSector: Semiconductors | |
| MarketCap: 1790 Millions | |
| Recent Price: 3.90 Smart Investing & Trading Score: 10 | |
| Day Percent Change: -4.18% Day Change: -0.17 | |
| Week Change: -9.72% Year-to-date Change: -52.0% | |
| NVTS Links: Profile News Message Board | |
| Charts:- Daily , Weekly | |
| Add NVTS to Watchlist: View: Get Complete NVTS Trend Analysis ➞ | |
 | EXLS ExlService Holdings, Inc. |
| Sector: Technology | |
| SubSector: Information Technology Services | |
| MarketCap: 1781.78 Millions | |
| Recent Price: 29.41 Smart Investing & Trading Score: 17 | |
| Day Percent Change: -0.17% Day Change: -0.05 | |
| Week Change: -3.32% Year-to-date Change: -4.7% | |
| EXLS Links: Profile News Message Board | |
| Charts:- Daily , Weekly | |
| Add EXLS to Watchlist: View: Get Complete EXLS Trend Analysis ➞ | |
 | ZETA Zeta Global Holdings Corp. |
| Sector: Technology | |
| SubSector: Software - Application | |
| MarketCap: 1780 Millions | |
| Recent Price: 11.85 Smart Investing & Trading Score: 58 | |
| Day Percent Change: 1.46% Day Change: 0.17 | |
| Week Change: -0.92% Year-to-date Change: 34.3% | |
| ZETA Links: Profile News Message Board | |
| Charts:- Daily , Weekly | |
| Add ZETA to Watchlist: View: Get Complete ZETA Trend Analysis ➞ | |
 | ROG Rogers Corporation |
| Sector: Technology | |
| SubSector: Diversified Electronics | |
| MarketCap: 1756.36 Millions | |
| Recent Price: 105.82 Smart Investing & Trading Score: 10 | |
| Day Percent Change: -3.57% Day Change: -3.92 | |
| Week Change: -4.55% Year-to-date Change: -19.9% | |
| ROG Links: Profile News Message Board | |
| Charts:- Daily , Weekly | |
| Add ROG to Watchlist: View: Get Complete ROG Trend Analysis ➞ | |
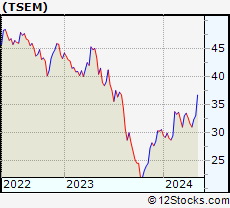 | TSEM Tower Semiconductor Ltd. |
| Sector: Technology | |
| SubSector: Semiconductor - Integrated Circuits | |
| MarketCap: 1745.1 Millions | |
| Recent Price: 31.59 Smart Investing & Trading Score: 36 | |
| Day Percent Change: -0.66% Day Change: -0.21 | |
| Week Change: 0.03% Year-to-date Change: 3.5% | |
| TSEM Links: Profile News Message Board | |
| Charts:- Daily , Weekly | |
| Add TSEM to Watchlist: View: Get Complete TSEM Trend Analysis ➞ | |
 | DAVA Endava plc |
| Sector: Technology | |
| SubSector: Business Software & Services | |
| MarketCap: 1744.68 Millions | |
| Recent Price: 30.09 Smart Investing & Trading Score: 15 | |
| Day Percent Change: -2.21% Day Change: -0.68 | |
| Week Change: -1.67% Year-to-date Change: -61.4% | |
| DAVA Links: Profile News Message Board | |
| Charts:- Daily , Weekly | |
| Add DAVA to Watchlist: View: Get Complete DAVA Trend Analysis ➞ | |
 | VRNS Varonis Systems, Inc. |
| Sector: Technology | |
| SubSector: Technical & System Software | |
| MarketCap: 1715 Millions | |
| Recent Price: 43.51 Smart Investing & Trading Score: 10 | |
| Day Percent Change: -1.02% Day Change: -0.45 | |
| Week Change: -2.27% Year-to-date Change: -3.9% | |
| VRNS Links: Profile News Message Board | |
| Charts:- Daily , Weekly | |
| Add VRNS to Watchlist: View: Get Complete VRNS Trend Analysis ➞ | |
 | PAYO Payoneer Global Inc. |
| Sector: Technology | |
| SubSector: Software - Infrastructure | |
| MarketCap: 1710 Millions | |
| Recent Price: 4.86 Smart Investing & Trading Score: 78 | |
| Day Percent Change: 0.73% Day Change: 0.04 | |
| Week Change: 0.52% Year-to-date Change: -8.2% | |
| PAYO Links: Profile News Message Board | |
| Charts:- Daily , Weekly | |
| Add PAYO to Watchlist: View: Get Complete PAYO Trend Analysis ➞ | |
 | PD PagerDuty, Inc. |
| Sector: Technology | |
| SubSector: Application Software | |
| MarketCap: 1690.32 Millions | |
| Recent Price: 21.22 Smart Investing & Trading Score: 7 | |
| Day Percent Change: 2.41% Day Change: 0.50 | |
| Week Change: -4.07% Year-to-date Change: -8.3% | |
| PD Links: Profile News Message Board | |
| Charts:- Daily , Weekly | |
| Add PD to Watchlist: View: Get Complete PD Trend Analysis ➞ | |
 | NTCT NetScout Systems, Inc. |
| Sector: Technology | |
| SubSector: Business Software & Services | |
| MarketCap: 1657.28 Millions | |
| Recent Price: 18.94 Smart Investing & Trading Score: 20 | |
| Day Percent Change: -1.20% Day Change: -0.23 | |
| Week Change: -3.76% Year-to-date Change: -13.7% | |
| NTCT Links: Profile News Message Board | |
| Charts:- Daily , Weekly | |
| Add NTCT to Watchlist: View: Get Complete NTCT Trend Analysis ➞ | |
 | EVTC EVERTEC, Inc. |
| Sector: Technology | |
| SubSector: Business Software & Services | |
| MarketCap: 1646.08 Millions | |
| Recent Price: 37.09 Smart Investing & Trading Score: 8 | |
| Day Percent Change: 0.46% Day Change: 0.17 | |
| Week Change: -0.75% Year-to-date Change: -9.4% | |
| EVTC Links: Profile News Message Board | |
| Charts:- Daily , Weekly | |
| Add EVTC to Watchlist: View: Get Complete EVTC Trend Analysis ➞ | |
 | AEIS Advanced Energy Industries, Inc. |
| Sector: Technology | |
| SubSector: Diversified Electronics | |
| MarketCap: 1641.86 Millions | |
| Recent Price: 92.43 Smart Investing & Trading Score: 0 | |
| Day Percent Change: -2.65% Day Change: -2.52 | |
| Week Change: -4.24% Year-to-date Change: -15.1% | |
| AEIS Links: Profile News Message Board | |
| Charts:- Daily , Weekly | |
| Add AEIS to Watchlist: View: Get Complete AEIS Trend Analysis ➞ | |
 | MLNK MeridianLink, Inc. |
| Sector: Technology | |
| SubSector: Software - Application | |
| MarketCap: 1630 Millions | |
| Recent Price: 17.15 Smart Investing & Trading Score: 10 | |
| Day Percent Change: 2.08% Day Change: 0.35 | |
| Week Change: 0.12% Year-to-date Change: -30.8% | |
| MLNK Links: Profile News Message Board | |
| Charts:- Daily , Weekly | |
| Add MLNK to Watchlist: View: Get Complete MLNK Trend Analysis ➞ | |
 | COMM CommScope Holding Company, Inc. |
| Sector: Technology | |
| SubSector: Communication Equipment | |
| MarketCap: 1614.29 Millions | |
| Recent Price: 0.99 Smart Investing & Trading Score: 20 | |
| Day Percent Change: -0.41% Day Change: 0.00 | |
| Week Change: -7.47% Year-to-date Change: -64.9% | |
| COMM Links: Profile News Message Board | |
| Charts:- Daily , Weekly | |
| Add COMM to Watchlist: View: Get Complete COMM Trend Analysis ➞ | |
 | CVLT Commvault Systems, Inc. |
| Sector: Technology | |
| SubSector: Application Software | |
| MarketCap: 1607.22 Millions | |
| Recent Price: 94.63 Smart Investing & Trading Score: 48 | |
| Day Percent Change: -1.05% Day Change: -1.00 | |
| Week Change: -1.93% Year-to-date Change: 18.5% | |
| CVLT Links: Profile News Message Board | |
| Charts:- Daily , Weekly | |
| Add CVLT to Watchlist: View: Get Complete CVLT Trend Analysis ➞ | |
 | COMP Compass, Inc. |
| Sector: Technology | |
| SubSector: Software - Application | |
| MarketCap: 1580 Millions | |
| Recent Price: 3.34 Smart Investing & Trading Score: 12 | |
| Day Percent Change: -3.19% Day Change: -0.11 | |
| Week Change: -7.48% Year-to-date Change: -10.3% | |
| COMP Links: Profile News Message Board | |
| Charts:- Daily , Weekly | |
| Add COMP to Watchlist: View: Get Complete COMP Trend Analysis ➞ | |
 | BAND Bandwidth Inc. |
| Sector: Technology | |
| SubSector: Business Software & Services | |
| MarketCap: 1549.38 Millions | |
| Recent Price: 17.16 Smart Investing & Trading Score: 48 | |
| Day Percent Change: 0.23% Day Change: 0.04 | |
| Week Change: -1.04% Year-to-date Change: 18.6% | |
| BAND Links: Profile News Message Board | |
| Charts:- Daily , Weekly | |
| Add BAND to Watchlist: View: Get Complete BAND Trend Analysis ➞ | |
 | WK Workiva Inc. |
| Sector: Technology | |
| SubSector: Application Software | |
| MarketCap: 1537.42 Millions | |
| Recent Price: 76.97 Smart Investing & Trading Score: 17 | |
| Day Percent Change: -0.12% Day Change: -0.09 | |
| Week Change: -1.91% Year-to-date Change: -24.2% | |
| WK Links: Profile News Message Board | |
| Charts:- Daily , Weekly | |
| Add WK to Watchlist: View: Get Complete WK Trend Analysis ➞ | |
 | BMI Badger Meter, Inc. |
| Sector: Technology | |
| SubSector: Scientific & Technical Instruments | |
| MarketCap: 1530.53 Millions | |
| Recent Price: 153.00 Smart Investing & Trading Score: 44 | |
| Day Percent Change: -0.71% Day Change: -1.09 | |
| Week Change: 0.06% Year-to-date Change: -0.9% | |
| BMI Links: Profile News Message Board | |
| Charts:- Daily , Weekly | |
| Add BMI to Watchlist: View: Get Complete BMI Trend Analysis ➞ | |
| For tabular summary view of above stock list: Summary View ➞ 0 - 25 , 25 - 50 , 50 - 75 , 75 - 100 , 100 - 125 , 125 - 150 , 150 - 175 , 175 - 200 , 200 - 225 , 225 - 250 , 250 - 275 , 275 - 300 , 300 - 325 , 325 - 350 , 350 - 375 , 375 - 400 , 400 - 425 , 425 - 450 , 450 - 475 , 475 - 500 , 500 - 525 , 525 - 550 , 550 - 575 , 575 - 600 , 600 - 625 , 625 - 650 | ||
| Click To Change The Sort Order: By Market Cap or Company Size Performance: Year-to-date, Week and Day | |
| Select Chart Type: | ||
|
Best Stocks Today 12Stocks.com |
© 2024 12Stocks.com Terms & Conditions Privacy Contact Us
All Information Provided Only For Education And Not To Be Used For Investing or Trading. See Terms & Conditions


One More Thing ... Get Best Stocks Delivered Daily!
Never Ever Miss A Move With Our Top Ten Stocks Lists
Find Best Stocks In Any Market - Bull or Bear Market
Take A Peek At Our Top Ten Stocks Lists: Daily, Weekly, Year-to-Date & Top Trends
Find Best Stocks In Any Market - Bull or Bear Market
Take A Peek At Our Top Ten Stocks Lists: Daily, Weekly, Year-to-Date & Top Trends
Technology Stocks With Best Up Trends [0-bearish to 100-bullish]: Zuora [100], GigaCloud [100], Inspire Medical[93], Allegro MicroSystems[93], Snap One[93], Encore Wire[93], Liberty Latin[90], NextNav [90], SYNNEX [88], Turkcell Iletisim[83], Model N[83]
Best Technology Stocks Year-to-Date:
MicroCloud Hologram[541.73%], MediaCo Holding[538.5%], Super Micro[237.75%], CXApp [223.55%], Smith Micro[136.08%], Uxin [133.95%], CuriosityStream [92.56%], GigaCloud [90.77%], D-Wave Quantum[90.34%], MicroStrategy [88.1%], SoundHound AI[85.28%] Best Technology Stocks This Week:
Snap One[29.85%], Mynaric AG[11.76%], Encore Wire[10.06%], Zuora [10%], Super Micro[6.85%], Applied Optoelectronics[6.68%], Luna Innovations[6.15%], NextNav [5.13%], Inspire Medical[5.08%], Sea [4.41%], Momo [4.15%] Best Technology Stocks Daily:
Zuora [11.69%], Inspire Medical[9.87%], MediaCo Holding[8.80%], Maxeon Solar[7.67%], CXApp [7.16%], FiscalNote [7.02%], Sunrun [4.99%], Snap [4.71%], Luna Innovations[4.55%], Cango [4.41%], Digital Turbine[4.20%]