
 Login Sign Up


| |||||
 |  | ||||

| 12Stocks.com Market Intelligence |
Best Tech Stocks
| In a hurry? Tech Stocks Lists: Performance & Trends, Stock Charts, FANG Stocks
Sort Tech stocks: Daily, Weekly, Year-to-Date, Market Cap & Trends. Filter Tech stocks list by size:All Tech Large Mid-Range Small and MicroCap |
| 12Stocks.com Tech Stocks Performances & Trends Daily | |||||||||
|
|  The overall Smart Investing & Trading Score is 0 (0-bearish to 100-bullish) which puts Technology sector in short term bearish trend. The Smart Investing & Trading Score from previous trading session is 13 and hence a deterioration of trend.
| ||||||||
Here are the Smart Investing & Trading Scores of the most requested Technology stocks at 12Stocks.com (click stock name for detailed review):
|


| 12Stocks.com: Investing in Technology sector with Stocks | |
|
The following table helps investors and traders sort through current performance and trends (as measured by Smart Investing & Trading Score) of various
stocks in the Tech sector. Quick View: Move mouse or cursor over stock symbol (ticker) to view short-term technical chart and over stock name to view long term chart. Click on  to add stock symbol to your watchlist and to add stock symbol to your watchlist and  to view watchlist. Click on any ticker or stock name for detailed market intelligence report for that stock. to view watchlist. Click on any ticker or stock name for detailed market intelligence report for that stock. |
12Stocks.com Performance of Stocks in Tech Sector
| Ticker | Stock Name | Watchlist | Category | Recent Price | Smart Investing & Trading Score | Change % | YTD Change% |
| VRNT | Verint Systems |   | Software | 29.14 | 35 | 0.17% | 7.81% |
| BLKB | Blackbaud | | Software | 76.48 | 42 | -0.30% | -11.79% |
| ANGI | ANGI Homeservices | | Internet | 2.02 | 32 | -1.46% | -18.88% |
| DSGX | Descartes Systems | | Software | 90.32 | 51 | 0.21% | 7.45% |
| INTA | Intapp | | Software - | 30.76 | 10 | -2.61% | -19.41% |
| QTWO | Q2 | | Software | 50.00 | 41 | 0.38% | 15.18% |
| OMCL | Omnicell | | Healthcare Information | 27.83 | 52 | 2.13% | -26.04% |
| NVT | nVent Electric | | Electronics | 71.63 | 41 | 0.13% | 21.22% |
| APPN | Appian | | Software | 34.59 | 36 | -0.77% | -8.15% |
| IRDM | Iridium | | Communication | 27.40 | 74 | 5.14% | -33.43% |
| NOVT | Novanta | | Instruments | 149.28 | 0 | -0.49% | -11.36% |
| IONQ | IonQ | | Computer Hardware | 7.09 | 10 | -6.34% | -43.12% |
| VIAV | Viavi | | Communication | 8.07 | 10 | -0.25% | -19.86% |
| MQ | Marqeta | | Software - Infrastructure | 5.31 | 8 | -5.43% | -24.52% |
| ACIW | ACI Worldwide | | Software | 31.95 | 63 | 1.40% | 4.41% |
| TRIP | TripAdvisor | | Internet | 25.04 | 49 | -0.83% | 16.30% |
| POWI | Power Integrations | | Semiconductor | 62.89 | 0 | -1.67% | -23.41% |
| NABL | N-able | | IT | 12.19 | 10 | -0.53% | -8.38% |
| CRDO | Credo | | Communication | 16.92 | 0 | -8.32% | -13.50% |
| USM | United States | | Wireless | 35.55 | 42 | 2.63% | -14.42% |
| TIGO | Millicom | | Telecom | 20.07 | 68 | 0.38% | 11.53% |
| RUM | Rumble | | Software - | 6.23 | 25 | -2.50% | 38.75% |
| VEON | VEON | | Telecom | 23.91 | 73 | 2.05% | 21.37% |
| TWKS | Thoughtworks Holding | | IT | 2.32 | 47 | -0.85% | -52.26% |
| SHEN | Shenandoah Tele | | Telecom | 14.69 | 35 | 1.66% | -32.05% |
| For chart view version of above stock list: Chart View ➞ 0 - 25 , 25 - 50 , 50 - 75 , 75 - 100 , 100 - 125 , 125 - 150 , 150 - 175 , 175 - 200 , 200 - 225 , 225 - 250 , 250 - 275 , 275 - 300 , 300 - 325 , 325 - 350 , 350 - 375 , 375 - 400 , 400 - 425 , 425 - 450 , 450 - 475 , 475 - 500 , 500 - 525 , 525 - 550 , 550 - 575 , 575 - 600 , 600 - 625 , 625 - 650 | ||
 | Click To Change The Sort Order: By Market Cap or Company Size Performance: Year-to-date, Week and Day |  |
|
Get the most comprehensive stock market coverage daily at 12Stocks.com ➞ Best Stocks Today ➞ Best Stocks Weekly ➞ Best Stocks Year-to-Date ➞ Best Stocks Trends ➞  Best Stocks Today 12Stocks.com Best Nasdaq Stocks ➞ Best S&P 500 Stocks ➞ Best Tech Stocks ➞ Best Biotech Stocks ➞ |
| Detailed Overview of Tech Stocks |
| Tech Technical Overview, Leaders & Laggards, Top Tech ETF Funds & Detailed Tech Stocks List, Charts, Trends & More |
| Tech Sector: Technical Analysis, Trends & YTD Performance | |
| Technology sector is composed of stocks
from semiconductors, software, web, social media
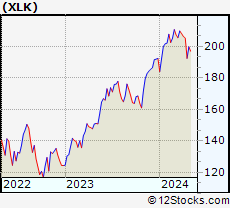
and services subsectors. Technology sector, as represented by XLK, an exchange-traded fund [ETF] that holds basket of tech stocks (e.g, Intel, Google) is up by 0.03% and is currently underperforming the overall market by -3.35% year-to-date. Below is a quick view of technical charts and trends: |
|
 XLK Weekly Chart |
|
| Long Term Trend: Not Good | |
| Medium Term Trend: Not Good | |
 XLK Daily Chart |
|
| Short Term Trend: Not Good | |
| Overall Trend Score: 0 | |
| YTD Performance: 0.03% | |
| **Trend Scores & Views Are Only For Educational Purposes And Not For Investing | |
| 12Stocks.com: Top Performing Technology Sector Stocks | ||||||||||||||||||||||||||||||||||||||||||||||||
 The top performing Technology sector stocks year to date are
Now, more recently, over last week, the top performing Technology sector stocks on the move are


|
||||||||||||||||||||||||||||||||||||||||||||||||
| 12Stocks.com: Investing in Tech Sector using Exchange Traded Funds | |
|
The following table shows list of key exchange traded funds (ETF) that
help investors track Tech Index. For detailed view, check out our ETF Funds section of our website. Quick View: Move mouse or cursor over ETF symbol (ticker) to view short-term technical chart and over ETF name to view long term chart. Click on ticker or stock name for detailed view. Click on to add stock symbol to your watchlist and to view watchlist. |
12Stocks.com List of ETFs that track Tech Index
| Ticker | ETF Name | Watchlist | Recent Price | Smart Investing & Trading Score | Change % | Week % | Year-to-date % |
| XLK | Technology | | 192.53 | 0 | -2.06 | -6.27 | 0.03% |
| QQQ | QQQ | | 414.65 | 13 | -2.07 | -5.39 | 1.25% |
| IYW | Technology | | 124.75 | 0 | -2.85 | -6.87 | 1.63% |
| VGT | Information Technology | | 479.90 | 0 | -2.65 | -6.76 | -0.85% |
| IXN | Global Tech | | 68.72 | 0 | -2.65 | -6.88 | 0.79% |
| IGV | Tech-Software | | 78.53 | 0 | -1.22 | -5.11 | -3.2% |
| XSD | Semiconductor | | 203.56 | 0 | -3.15 | -8.78 | -9.44% |
| TQQQ | QQQ | | 49.48 | 0 | -6.20 | -15.74 | -2.41% |
| SQQQ | Short QQQ | | 12.84 | 82 | 6.38 | 17.91 | -4.54% |
| SOXL | Semicondct Bull 3X | | 30.79 | 0 | -11.80 | -25.83 | -1.94% |
| SOXS | Semicondct Bear 3X | | 46.13 | 90 | 11.78 | 1210.51 | 692.61% |
| SOXX | PHLX Semiconductor | | 198.39 | 26 | -3.99 | -9.02 | 3.31% |
| QTEC | First -100-Tech | | 173.94 | 0 | -2.21 | -6.49 | -0.87% |
| SMH | Semiconductor | | 199.21 | 26 | -4.52 | -9.73 | 13.92% |
| 12Stocks.com: Charts, Trends, Fundamental Data and Performances of Tech Stocks | |
|
We now take in-depth look at all Tech stocks including charts, multi-period performances and overall trends (as measured by Smart Investing & Trading Score). One can sort Tech stocks (click link to choose) by Daily, Weekly and by Year-to-Date performances. Also, one can sort by size of the company or by market capitalization. |
| Select Your Default Chart Type: | |||||
| |||||
| Click on stock symbol or name for detailed view. Click on to add stock symbol to your watchlist and to view watchlist. Quick View: Move mouse or cursor over "Daily" to quickly view daily technical stock chart and over "Weekly" to view weekly technical stock chart. | |||||


 | VRNT Verint Systems Inc. |
| Sector: Technology | |
| SubSector: Business Software & Services | |
| MarketCap: 2902.18 Millions | |
| Recent Price: 29.14 Smart Investing & Trading Score: 35 | |
| Day Percent Change: 0.17% Day Change: 0.05 | |
| Week Change: -3.7% Year-to-date Change: 7.8% | |
| VRNT Links: Profile News Message Board | |
| Charts:- Daily , Weekly | |
| Add VRNT to Watchlist: View: Get Complete VRNT Trend Analysis ➞ | |
 | BLKB Blackbaud, Inc. |
| Sector: Technology | |
| SubSector: Business Software & Services | |
| MarketCap: 2838.48 Millions | |
| Recent Price: 76.48 Smart Investing & Trading Score: 42 | |
| Day Percent Change: -0.30% Day Change: -0.23 | |
| Week Change: -0.31% Year-to-date Change: -11.8% | |
| BLKB Links: Profile News Message Board | |
| Charts:- Daily , Weekly | |
| Add BLKB to Watchlist: View: Get Complete BLKB Trend Analysis ➞ | |
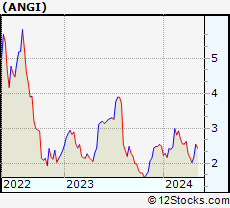 | ANGI ANGI Homeservices Inc. |
| Sector: Technology | |
| SubSector: Internet Software & Services | |
| MarketCap: 2830.61 Millions | |
| Recent Price: 2.02 Smart Investing & Trading Score: 32 | |
| Day Percent Change: -1.46% Day Change: -0.03 | |
| Week Change: -6.48% Year-to-date Change: -18.9% | |
| ANGI Links: Profile News Message Board | |
| Charts:- Daily , Weekly | |
| Add ANGI to Watchlist: View: Get Complete ANGI Trend Analysis ➞ | |
 | DSGX The Descartes Systems Group Inc |
| Sector: Technology | |
| SubSector: Business Software & Services | |
| MarketCap: 2830.58 Millions | |
| Recent Price: 90.32 Smart Investing & Trading Score: 51 | |
| Day Percent Change: 0.21% Day Change: 0.19 | |
| Week Change: 0.3% Year-to-date Change: 7.5% | |
| DSGX Links: Profile News Message Board | |
| Charts:- Daily , Weekly | |
| Add DSGX to Watchlist: View: Get Complete DSGX Trend Analysis ➞ | |
 | INTA Intapp, Inc. |
| Sector: Technology | |
| SubSector: Software - Application | |
| MarketCap: 2820 Millions | |
| Recent Price: 30.76 Smart Investing & Trading Score: 10 | |
| Day Percent Change: -2.61% Day Change: -0.82 | |
| Week Change: -1.88% Year-to-date Change: -19.4% | |
| INTA Links: Profile News Message Board | |
| Charts:- Daily , Weekly | |
| Add INTA to Watchlist: View: Get Complete INTA Trend Analysis ➞ | |
 | QTWO Q2 Holdings, Inc. |
| Sector: Technology | |
| SubSector: Business Software & Services | |
| MarketCap: 2815.88 Millions | |
| Recent Price: 50.00 Smart Investing & Trading Score: 41 | |
| Day Percent Change: 0.38% Day Change: 0.19 | |
| Week Change: -3.03% Year-to-date Change: 15.2% | |
| QTWO Links: Profile News Message Board | |
| Charts:- Daily , Weekly | |
| Add QTWO to Watchlist: View: Get Complete QTWO Trend Analysis ➞ | |
 | OMCL Omnicell, Inc. |
| Sector: Technology | |
| SubSector: Healthcare Information Services | |
| MarketCap: 2781.05 Millions | |
| Recent Price: 27.83 Smart Investing & Trading Score: 52 | |
| Day Percent Change: 2.13% Day Change: 0.58 | |
| Week Change: 2.39% Year-to-date Change: -26.0% | |
| OMCL Links: Profile News Message Board | |
| Charts:- Daily , Weekly | |
| Add OMCL to Watchlist: View: Get Complete OMCL Trend Analysis ➞ | |
 | NVT nVent Electric plc |
| Sector: Technology | |
| SubSector: Diversified Electronics | |
| MarketCap: 2752.86 Millions | |
| Recent Price: 71.63 Smart Investing & Trading Score: 41 | |
| Day Percent Change: 0.13% Day Change: 0.09 | |
| Week Change: -3.42% Year-to-date Change: 21.2% | |
| NVT Links: Profile News Message Board | |
| Charts:- Daily , Weekly | |
| Add NVT to Watchlist: View: Get Complete NVT Trend Analysis ➞ | |
 | APPN Appian Corporation |
| Sector: Technology | |
| SubSector: Application Software | |
| MarketCap: 2737.92 Millions | |
| Recent Price: 34.59 Smart Investing & Trading Score: 36 | |
| Day Percent Change: -0.77% Day Change: -0.27 | |
| Week Change: -10.09% Year-to-date Change: -8.2% | |
| APPN Links: Profile News Message Board | |
| Charts:- Daily , Weekly | |
| Add APPN to Watchlist: View: Get Complete APPN Trend Analysis ➞ | |
 | IRDM Iridium Communications Inc. |
| Sector: Technology | |
| SubSector: Diversified Communication Services | |
| MarketCap: 2711.24 Millions | |
| Recent Price: 27.40 Smart Investing & Trading Score: 74 | |
| Day Percent Change: 5.14% Day Change: 1.34 | |
| Week Change: 11.07% Year-to-date Change: -33.4% | |
| IRDM Links: Profile News Message Board | |
| Charts:- Daily , Weekly | |
| Add IRDM to Watchlist: View: Get Complete IRDM Trend Analysis ➞ | |
 | NOVT Novanta Inc. |
| Sector: Technology | |
| SubSector: Scientific & Technical Instruments | |
| MarketCap: 2680.83 Millions | |
| Recent Price: 149.28 Smart Investing & Trading Score: 0 | |
| Day Percent Change: -0.49% Day Change: -0.74 | |
| Week Change: -8.42% Year-to-date Change: -11.4% | |
| NOVT Links: Profile News Message Board | |
| Charts:- Daily , Weekly | |
| Add NOVT to Watchlist: View: Get Complete NOVT Trend Analysis ➞ | |
 | IONQ IonQ, Inc. |
| Sector: Technology | |
| SubSector: Computer Hardware | |
| MarketCap: 2680 Millions | |
| Recent Price: 7.09 Smart Investing & Trading Score: 10 | |
| Day Percent Change: -6.34% Day Change: -0.48 | |
| Week Change: -11.71% Year-to-date Change: -43.1% | |
| IONQ Links: Profile News Message Board | |
| Charts:- Daily , Weekly | |
| Add IONQ to Watchlist: View: Get Complete IONQ Trend Analysis ➞ | |
 | VIAV Viavi Solutions Inc. |
| Sector: Technology | |
| SubSector: Communication Equipment | |
| MarketCap: 2653.29 Millions | |
| Recent Price: 8.07 Smart Investing & Trading Score: 10 | |
| Day Percent Change: -0.25% Day Change: -0.02 | |
| Week Change: -4.5% Year-to-date Change: -19.9% | |
| VIAV Links: Profile News Message Board | |
| Charts:- Daily , Weekly | |
| Add VIAV to Watchlist: View: Get Complete VIAV Trend Analysis ➞ | |
 | MQ Marqeta, Inc. |
| Sector: Technology | |
| SubSector: Software - Infrastructure | |
| MarketCap: 2650 Millions | |
| Recent Price: 5.31 Smart Investing & Trading Score: 8 | |
| Day Percent Change: -5.43% Day Change: -0.31 | |
| Week Change: -2.39% Year-to-date Change: -24.5% | |
| MQ Links: Profile News Message Board | |
| Charts:- Daily , Weekly | |
| Add MQ to Watchlist: View: Get Complete MQ Trend Analysis ➞ | |
 | ACIW ACI Worldwide, Inc. |
| Sector: Technology | |
| SubSector: Technical & System Software | |
| MarketCap: 2645.7 Millions | |
| Recent Price: 31.95 Smart Investing & Trading Score: 63 | |
| Day Percent Change: 1.40% Day Change: 0.44 | |
| Week Change: -0.16% Year-to-date Change: 4.4% | |
| ACIW Links: Profile News Message Board | |
| Charts:- Daily , Weekly | |
| Add ACIW to Watchlist: View: Get Complete ACIW Trend Analysis ➞ | |
 | TRIP TripAdvisor, Inc. |
| Sector: Technology | |
| SubSector: Internet Information Providers | |
| MarketCap: 2633.9 Millions | |
| Recent Price: 25.04 Smart Investing & Trading Score: 49 | |
| Day Percent Change: -0.83% Day Change: -0.21 | |
| Week Change: -6.36% Year-to-date Change: 16.3% | |
| TRIP Links: Profile News Message Board | |
| Charts:- Daily , Weekly | |
| Add TRIP to Watchlist: View: Get Complete TRIP Trend Analysis ➞ | |
 | POWI Power Integrations, Inc. |
| Sector: Technology | |
| SubSector: Semiconductor - Integrated Circuits | |
| MarketCap: 2612.1 Millions | |
| Recent Price: 62.89 Smart Investing & Trading Score: 0 | |
| Day Percent Change: -1.67% Day Change: -1.07 | |
| Week Change: -7.57% Year-to-date Change: -23.4% | |
| POWI Links: Profile News Message Board | |
| Charts:- Daily , Weekly | |
| Add POWI to Watchlist: View: Get Complete POWI Trend Analysis ➞ | |
 | NABL N-able, Inc. |
| Sector: Technology | |
| SubSector: Information Technology Services | |
| MarketCap: 2590 Millions | |
| Recent Price: 12.19 Smart Investing & Trading Score: 10 | |
| Day Percent Change: -0.53% Day Change: -0.07 | |
| Week Change: -2.95% Year-to-date Change: -8.4% | |
| NABL Links: Profile News Message Board | |
| Charts:- Daily , Weekly | |
| Add NABL to Watchlist: View: Get Complete NABL Trend Analysis ➞ | |
 | CRDO Credo Technology Group Holding Ltd |
| Sector: Technology | |
| SubSector: Communication Equipment | |
| MarketCap: 2590 Millions | |
| Recent Price: 16.92 Smart Investing & Trading Score: 0 | |
| Day Percent Change: -8.32% Day Change: -1.53 | |
| Week Change: -21.08% Year-to-date Change: -13.5% | |
| CRDO Links: Profile News Message Board | |
| Charts:- Daily , Weekly | |
| Add CRDO to Watchlist: View: Get Complete CRDO Trend Analysis ➞ | |
 | USM United States Cellular Corporation |
| Sector: Technology | |
| SubSector: Wireless Communications | |
| MarketCap: 2587.67 Millions | |
| Recent Price: 35.55 Smart Investing & Trading Score: 42 | |
| Day Percent Change: 2.63% Day Change: 0.91 | |
| Week Change: 0.82% Year-to-date Change: -14.4% | |
| USM Links: Profile News Message Board | |
| Charts:- Daily , Weekly | |
| Add USM to Watchlist: View: Get Complete USM Trend Analysis ➞ | |
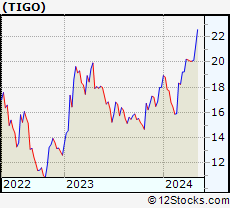 | TIGO Millicom International Cellular S.A. |
| Sector: Technology | |
| SubSector: Telecom Services - Domestic | |
| MarketCap: 2549.57 Millions | |
| Recent Price: 20.07 Smart Investing & Trading Score: 68 | |
| Day Percent Change: 0.38% Day Change: 0.07 | |
| Week Change: -0.02% Year-to-date Change: 11.5% | |
| TIGO Links: Profile News Message Board | |
| Charts:- Daily , Weekly | |
| Add TIGO to Watchlist: View: Get Complete TIGO Trend Analysis ➞ | |
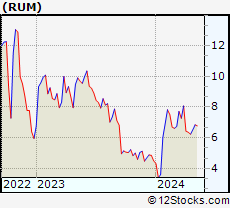 | RUM Rumble Inc. |
| Sector: Technology | |
| SubSector: Software - Application | |
| MarketCap: 2520 Millions | |
| Recent Price: 6.23 Smart Investing & Trading Score: 25 | |
| Day Percent Change: -2.50% Day Change: -0.16 | |
| Week Change: -2.04% Year-to-date Change: 38.8% | |
| RUM Links: Profile News Message Board | |
| Charts:- Daily , Weekly | |
| Add RUM to Watchlist: View: Get Complete RUM Trend Analysis ➞ | |
 | VEON VEON Ltd. |
| Sector: Technology | |
| SubSector: Telecom Services - Foreign | |
| MarketCap: 2497.89 Millions | |
| Recent Price: 23.91 Smart Investing & Trading Score: 73 | |
| Day Percent Change: 2.05% Day Change: 0.48 | |
| Week Change: 1.23% Year-to-date Change: 21.4% | |
| VEON Links: Profile News Message Board | |
| Charts:- Daily , Weekly | |
| Add VEON to Watchlist: View: Get Complete VEON Trend Analysis ➞ | |
 | TWKS Thoughtworks Holding, Inc. |
| Sector: Technology | |
| SubSector: Information Technology Services | |
| MarketCap: 2370 Millions | |
| Recent Price: 2.32 Smart Investing & Trading Score: 47 | |
| Day Percent Change: -0.85% Day Change: -0.02 | |
| Week Change: -2.93% Year-to-date Change: -52.3% | |
| TWKS Links: Profile News Message Board | |
| Charts:- Daily , Weekly | |
| Add TWKS to Watchlist: View: Get Complete TWKS Trend Analysis ➞ | |
 | SHEN Shenandoah Telecommunications Company |
| Sector: Technology | |
| SubSector: Telecom Services - Domestic | |
| MarketCap: 2329.67 Millions | |
| Recent Price: 14.69 Smart Investing & Trading Score: 35 | |
| Day Percent Change: 1.66% Day Change: 0.24 | |
| Week Change: -1.61% Year-to-date Change: -32.1% | |
| SHEN Links: Profile News Message Board | |
| Charts:- Daily , Weekly | |
| Add SHEN to Watchlist: View: Get Complete SHEN Trend Analysis ➞ | |
| For tabular summary view of above stock list: Summary View ➞ 0 - 25 , 25 - 50 , 50 - 75 , 75 - 100 , 100 - 125 , 125 - 150 , 150 - 175 , 175 - 200 , 200 - 225 , 225 - 250 , 250 - 275 , 275 - 300 , 300 - 325 , 325 - 350 , 350 - 375 , 375 - 400 , 400 - 425 , 425 - 450 , 450 - 475 , 475 - 500 , 500 - 525 , 525 - 550 , 550 - 575 , 575 - 600 , 600 - 625 , 625 - 650 | ||
| Click To Change The Sort Order: By Market Cap or Company Size Performance: Year-to-date, Week and Day | |
| Select Chart Type: | ||
|
Best Stocks Today 12Stocks.com |
© 2024 12Stocks.com Terms & Conditions Privacy Contact Us
All Information Provided Only For Education And Not To Be Used For Investing or Trading. See Terms & Conditions


One More Thing ... Get Best Stocks Delivered Daily!
Never Ever Miss A Move With Our Top Ten Stocks Lists
Find Best Stocks In Any Market - Bull or Bear Market
Take A Peek At Our Top Ten Stocks Lists: Daily, Weekly, Year-to-Date & Top Trends
Find Best Stocks In Any Market - Bull or Bear Market
Take A Peek At Our Top Ten Stocks Lists: Daily, Weekly, Year-to-Date & Top Trends
Technology Stocks With Best Up Trends [0-bearish to 100-bullish]: Karooooo [100], NextNav [100], EchoStar [100], Badger Meter[100], Full Truck[93], Turkcell Iletisim[93], Grab [93], Zuora [93], GDS [88], Criteo S.A[83], So-Young [83]
Best Technology Stocks Year-to-Date:
Pagaya [589.78%], MediaCo Holding[544.37%], CXApp [168.73%], Smith Micro[151.82%], Super Micro[151.06%], Uxin [141.08%], CuriosityStream [107.37%], GigaCloud [89.46%], MicroStrategy [85.89%], NextNav [83.37%], D-Wave Quantum[81.22%] Best Technology Stocks This Week:
Snap One[29.73%], Badger Meter[15.61%], Mynaric AG[13.08%], Expensify [11.56%], Iridium [11.07%], NextNav [10.12%], Encore Wire[8.97%], Quhuo [8.87%], Bentley Systems[7.96%], Applied Optoelectronics[7.93%], Zuora [7.56%] Best Technology Stocks Daily:
Markforged Holding[16.32%], CuriosityStream [10.89%], CXApp [9.78%], Iridium [5.14%], Cheetah Mobile[5.04%], Aerohive Networks[4.23%], Materialise NV[3.98%], Applied Optoelectronics[3.95%], QuinStreet [3.70%], ATN [3.58%], MediaCo Holding[3.58%]