
 Login Sign Up


| |||||
 |  | ||||

| 12Stocks.com Market Intelligence |
Best Tech Stocks
| In a hurry? Tech Stocks Lists: Performance & Trends, Stock Charts, FANG Stocks
Sort Tech stocks: Daily, Weekly, Year-to-Date, Market Cap & Trends. Filter Tech stocks list by size:All Tech Large Mid-Range Small and MicroCap |
| 12Stocks.com Tech Stocks Performances & Trends Daily | |||||||||
|
|  The overall Smart Investing & Trading Score is 13 (0-bearish to 100-bullish) which puts Technology sector in short term bearish trend. The Smart Investing & Trading Score from previous trading session is 26 and hence a deterioration of trend.
| ||||||||
Here are the Smart Investing & Trading Scores of the most requested Technology stocks at 12Stocks.com (click stock name for detailed review):
|


| 12Stocks.com: Investing in Technology sector with Stocks | |
|
The following table helps investors and traders sort through current performance and trends (as measured by Smart Investing & Trading Score) of various
stocks in the Tech sector. Quick View: Move mouse or cursor over stock symbol (ticker) to view short-term technical chart and over stock name to view long term chart. Click on  to add stock symbol to your watchlist and to add stock symbol to your watchlist and  to view watchlist. Click on any ticker or stock name for detailed market intelligence report for that stock. to view watchlist. Click on any ticker or stock name for detailed market intelligence report for that stock. |
12Stocks.com Performance of Stocks in Tech Sector
| Ticker | Stock Name | Watchlist | Category | Recent Price | Smart Investing & Trading Score | Change % | YTD Change% |
| MSFT | Microsoft |   | Software | 411.84 | 26 | -0.66% | 9.52% |
| AAPL | Apple | | Electronic | 168.00 | 17 | -0.81% | -12.74% |
| GOOGL | Alphabet | | Internet | 155.47 | 75 | 0.69% | 11.30% |
| META | Meta Platforms | | Internet Content & Information | 494.18 | 46 | -1.12% | 39.59% |
| GOOG | Alphabet | | Internet | 156.88 | 75 | 0.56% | 11.32% |
| INTU | Intuit | | Software | 613.21 | 10 | 0.28% | -1.89% |
| TSM | Taiwan Semiconductor | | Semiconductor | 139.03 | 58 | -0.55% | 33.68% |
| VZ | Verizon | | Telecom | 39.78 | 23 | 0.03% | 5.52% |
| T | AT&T | | Telecom | 16.12 | 17 | 0.19% | -3.93% |
| INTC | Intel | | Semiconductor | 35.68 | 18 | -1.60% | -29.00% |
| CSCO | Cisco Systems | | Communication | 47.79 | 0 | -0.27% | -5.40% |
| ORCL | Oracle | | Software | 118.67 | 26 | -1.62% | 12.56% |
| NFLX | Netflix | | CATV | 613.69 | 56 | -0.62% | 26.05% |
| ADBE | Adobe | | Software | 474.45 | 35 | -0.37% | -20.47% |
| NVDA | NVIDIA | | Semiconductor | 840.35 | 31 | -3.87% | 69.69% |
| CRM | salesforce.com | | Software | 276.32 | 0 | -0.39% | 5.01% |
| SAP | SAP SE | | Software | 179.94 | 44 | -0.34% | 16.40% |
| ACN | Accenture | | IT | 314.54 | 25 | 0.19% | -10.36% |
| ASML | ASML Holding | | Semiconductor | 907.61 | 26 | -7.09% | 19.91% |
| TXN | Texas | | Semiconductor | 165.70 | 44 | -1.13% | -2.79% |
| BSY | Bentley Systems | | Software | 50.11 | 55 | 2.47% | -3.95% |
| KC | Kingsoft Cloud | | Software | 2.61 | 17 | 0.77% | -31.04% |
| IBM | IBM | | IT | 183.10 | 31 | -0.35% | 11.95% |
| AMST | Amesite | | Software | 1.96 | 0 | -1.01% | -14.78% |
| MAXN | Maxeon Solar | | Solar | 2.11 | 27 | 7.67% | -70.68% |
| For chart view version of above stock list: Chart View ➞ 0 - 25 , 25 - 50 , 50 - 75 , 75 - 100 , 100 - 125 , 125 - 150 , 150 - 175 , 175 - 200 , 200 - 225 , 225 - 250 , 250 - 275 , 275 - 300 , 300 - 325 , 325 - 350 , 350 - 375 , 375 - 400 , 400 - 425 , 425 - 450 , 450 - 475 , 475 - 500 , 500 - 525 , 525 - 550 , 550 - 575 , 575 - 600 , 600 - 625 , 625 - 650 | ||
 | Click To Change The Sort Order: By Market Cap or Company Size Performance: Year-to-date, Week and Day |  |
|
Get the most comprehensive stock market coverage daily at 12Stocks.com ➞ Best Stocks Today ➞ Best Stocks Weekly ➞ Best Stocks Year-to-Date ➞ Best Stocks Trends ➞  Best Stocks Today 12Stocks.com Best Nasdaq Stocks ➞ Best S&P 500 Stocks ➞ Best Tech Stocks ➞ Best Biotech Stocks ➞ |
| Detailed Overview of Tech Stocks |
| Tech Technical Overview, Leaders & Laggards, Top Tech ETF Funds & Detailed Tech Stocks List, Charts, Trends & More |
| Tech Sector: Technical Analysis, Trends & YTD Performance | |
| Technology sector is composed of stocks
from semiconductors, software, web, social media
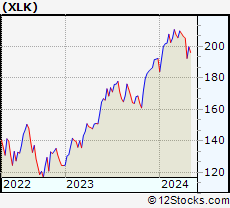
and services subsectors. Technology sector, as represented by XLK, an exchange-traded fund [ETF] that holds basket of tech stocks (e.g, Intel, Google) is up by 3.31% and is currently underperforming the overall market by -1.1% year-to-date. Below is a quick view of technical charts and trends: |
|
 XLK Weekly Chart |
|
| Long Term Trend: Good | |
| Medium Term Trend: Not Good | |
 XLK Daily Chart |
|
| Short Term Trend: Not Good | |
| Overall Trend Score: 13 | |
| YTD Performance: 3.31% | |
| **Trend Scores & Views Are Only For Educational Purposes And Not For Investing | |
| 12Stocks.com: Top Performing Technology Sector Stocks | ||||||||||||||||||||||||||||||||||||||||||||||||
 The top performing Technology sector stocks year to date are
Now, more recently, over last week, the top performing Technology sector stocks on the move are


|
||||||||||||||||||||||||||||||||||||||||||||||||
| 12Stocks.com: Investing in Tech Sector using Exchange Traded Funds | |
|
The following table shows list of key exchange traded funds (ETF) that
help investors track Tech Index. For detailed view, check out our ETF Funds section of our website. Quick View: Move mouse or cursor over ETF symbol (ticker) to view short-term technical chart and over ETF name to view long term chart. Click on ticker or stock name for detailed view. Click on to add stock symbol to your watchlist and to view watchlist. |
12Stocks.com List of ETFs that track Tech Index
| Ticker | ETF Name | Watchlist | Recent Price | Smart Investing & Trading Score | Change % | Week % | Year-to-date % |
| XLK | Technology | | 198.85 | 13 | -1.44 | -3.2 | 3.31% |
| QQQ | QQQ | | 425.84 | 26 | -1.31 | -2.84 | 3.99% |
| IYW | Technology | | 129.34 | 26 | -1.55 | -3.44 | 5.37% |
| VGT | Information Technology | | 497.69 | 26 | -1.48 | -3.3 | 2.83% |
| IXN | Global Tech | | 71.31 | 26 | -1.75 | -3.37 | 4.59% |
| IGV | Tech-Software | | 80.06 | 0 | -0.79 | -3.26 | -1.32% |
| XSD | Semiconductor | | 214.44 | 26 | -2.18 | -3.91 | -4.6% |
| TQQQ | QQQ | | 53.71 | 26 | -3.71 | -8.53 | 5.94% |
| SQQQ | Short QQQ | | 11.86 | 69 | 3.67 | 8.91 | -11.82% |
| SOXL | Semicondct Bull 3X | | 37.06 | 26 | -8.58 | -10.72 | 18.03% |
| SOXS | Semicondct Bear 3X | | 39.15 | 90 | 8.18 | 1012.22 | 572.68% |
| SOXX | PHLX Semiconductor | | 210.36 | 31 | -2.77 | -3.54 | 9.54% |
| QTEC | First -100-Tech | | 179.73 | 26 | -1.93 | -3.38 | 2.43% |
| SMH | Semiconductor | | 212.40 | 31 | -3.08 | -3.75 | 21.46% |
| 12Stocks.com: Charts, Trends, Fundamental Data and Performances of Tech Stocks | |
|
We now take in-depth look at all Tech stocks including charts, multi-period performances and overall trends (as measured by Smart Investing & Trading Score). One can sort Tech stocks (click link to choose) by Daily, Weekly and by Year-to-Date performances. Also, one can sort by size of the company or by market capitalization. |
| Select Your Default Chart Type: | |||||
| |||||
| Click on stock symbol or name for detailed view. Click on to add stock symbol to your watchlist and to view watchlist. Quick View: Move mouse or cursor over "Daily" to quickly view daily technical stock chart and over "Weekly" to view weekly technical stock chart. | |||||


 | MSFT Microsoft Corporation |
| Sector: Technology | |
| SubSector: Business Software & Services | |
| MarketCap: 1154150 Millions | |
| Recent Price: 411.84 Smart Investing & Trading Score: 26 | |
| Day Percent Change: -0.66% Day Change: -2.74 | |
| Week Change: -2.38% Year-to-date Change: 9.5% | |
| MSFT Links: Profile News Message Board | |
| Charts:- Daily , Weekly | |
| Add MSFT to Watchlist: View: Get Complete MSFT Trend Analysis ➞ | |
 | AAPL Apple Inc. |
| Sector: Technology | |
| SubSector: Electronic Equipment | |
| MarketCap: 1112940 Millions | |
| Recent Price: 168.00 Smart Investing & Trading Score: 17 | |
| Day Percent Change: -0.81% Day Change: -1.38 | |
| Week Change: -4.84% Year-to-date Change: -12.7% | |
| AAPL Links: Profile News Message Board | |
| Charts:- Daily , Weekly | |
| Add AAPL to Watchlist: View: Get Complete AAPL Trend Analysis ➞ | |
 | GOOGL Alphabet Inc. |
| Sector: Technology | |
| SubSector: Internet Information Providers | |
| MarketCap: 801264 Millions | |
| Recent Price: 155.47 Smart Investing & Trading Score: 75 | |
| Day Percent Change: 0.69% Day Change: 1.07 | |
| Week Change: -1.43% Year-to-date Change: 11.3% | |
| GOOGL Links: Profile News Message Board | |
| Charts:- Daily , Weekly | |
| Add GOOGL to Watchlist: View: Get Complete GOOGL Trend Analysis ➞ | |
 | META Meta Platforms, Inc. |
| Sector: Technology | |
| SubSector: Internet Content & Information | |
| MarketCap: 732990 Millions | |
| Recent Price: 494.18 Smart Investing & Trading Score: 46 | |
| Day Percent Change: -1.12% Day Change: -5.58 | |
| Week Change: -3.46% Year-to-date Change: 39.6% | |
| META Links: Profile News Message Board | |
| Charts:- Daily , Weekly | |
| Add META to Watchlist: View: Get Complete META Trend Analysis ➞ | |
 | GOOG Alphabet Inc. |
| Sector: Technology | |
| SubSector: Internet Information Providers | |
| MarketCap: 730159 Millions | |
| Recent Price: 156.88 Smart Investing & Trading Score: 75 | |
| Day Percent Change: 0.56% Day Change: 0.88 | |
| Week Change: -1.45% Year-to-date Change: 11.3% | |
| GOOG Links: Profile News Message Board | |
| Charts:- Daily , Weekly | |
| Add GOOG to Watchlist: View: Get Complete GOOG Trend Analysis ➞ | |
 | INTU Intuit Inc. |
| Sector: Technology | |
| SubSector: Application Software | |
| MarketCap: 577035 Millions | |
| Recent Price: 613.21 Smart Investing & Trading Score: 10 | |
| Day Percent Change: 0.28% Day Change: 1.72 | |
| Week Change: -1.27% Year-to-date Change: -1.9% | |
| INTU Links: Profile News Message Board | |
| Charts:- Daily , Weekly | |
| Add INTU to Watchlist: View: Get Complete INTU Trend Analysis ➞ | |
 | TSM Taiwan Semiconductor Manufacturing Company Limited |
| Sector: Technology | |
| SubSector: Semiconductor - Integrated Circuits | |
| MarketCap: 239384 Millions | |
| Recent Price: 139.03 Smart Investing & Trading Score: 58 | |
| Day Percent Change: -0.55% Day Change: -0.77 | |
| Week Change: -2.45% Year-to-date Change: 33.7% | |
| TSM Links: Profile News Message Board | |
| Charts:- Daily , Weekly | |
| Add TSM to Watchlist: View: Get Complete TSM Trend Analysis ➞ | |
 | VZ Verizon Communications Inc. |
| Sector: Technology | |
| SubSector: Telecom Services - Domestic | |
| MarketCap: 229427 Millions | |
| Recent Price: 39.78 Smart Investing & Trading Score: 23 | |
| Day Percent Change: 0.03% Day Change: 0.01 | |
| Week Change: 0.15% Year-to-date Change: 5.5% | |
| VZ Links: Profile News Message Board | |
| Charts:- Daily , Weekly | |
| Add VZ to Watchlist: View: Get Complete VZ Trend Analysis ➞ | |
 | T AT&T Inc. |
| Sector: Technology | |
| SubSector: Telecom Services - Domestic | |
| MarketCap: 224847 Millions | |
| Recent Price: 16.12 Smart Investing & Trading Score: 17 | |
| Day Percent Change: 0.19% Day Change: 0.03 | |
| Week Change: -1.16% Year-to-date Change: -3.9% | |
| T Links: Profile News Message Board | |
| Charts:- Daily , Weekly | |
| Add T to Watchlist: View: Get Complete T Trend Analysis ➞ | |
 | INTC Intel Corporation |
| Sector: Technology | |
| SubSector: Semiconductor - Broad Line | |
| MarketCap: 222357 Millions | |
| Recent Price: 35.68 Smart Investing & Trading Score: 18 | |
| Day Percent Change: -1.60% Day Change: -0.58 | |
| Week Change: -0.03% Year-to-date Change: -29.0% | |
| INTC Links: Profile News Message Board | |
| Charts:- Daily , Weekly | |
| Add INTC to Watchlist: View: Get Complete INTC Trend Analysis ➞ | |
 | CSCO Cisco Systems, Inc. |
| Sector: Technology | |
| SubSector: Communication Equipment | |
| MarketCap: 168483 Millions | |
| Recent Price: 47.79 Smart Investing & Trading Score: 0 | |
| Day Percent Change: -0.27% Day Change: -0.13 | |
| Week Change: -1.44% Year-to-date Change: -5.4% | |
| CSCO Links: Profile News Message Board | |
| Charts:- Daily , Weekly | |
| Add CSCO to Watchlist: View: Get Complete CSCO Trend Analysis ➞ | |
 | ORCL Oracle Corporation |
| Sector: Technology | |
| SubSector: Application Software | |
| MarketCap: 164530 Millions | |
| Recent Price: 118.67 Smart Investing & Trading Score: 26 | |
| Day Percent Change: -1.62% Day Change: -1.95 | |
| Week Change: -2.01% Year-to-date Change: 12.6% | |
| ORCL Links: Profile News Message Board | |
| Charts:- Daily , Weekly | |
| Add ORCL to Watchlist: View: Get Complete ORCL Trend Analysis ➞ | |
 | NFLX Netflix, Inc. |
| Sector: Technology | |
| SubSector: CATV Systems | |
| MarketCap: 162108 Millions | |
| Recent Price: 613.69 Smart Investing & Trading Score: 56 | |
| Day Percent Change: -0.62% Day Change: -3.83 | |
| Week Change: -1.47% Year-to-date Change: 26.1% | |
| NFLX Links: Profile News Message Board | |
| Charts:- Daily , Weekly | |
| Add NFLX to Watchlist: View: Get Complete NFLX Trend Analysis ➞ | |
 | ADBE Adobe Inc. |
| Sector: Technology | |
| SubSector: Application Software | |
| MarketCap: 157868 Millions | |
| Recent Price: 474.45 Smart Investing & Trading Score: 35 | |
| Day Percent Change: -0.37% Day Change: -1.77 | |
| Week Change: 0.08% Year-to-date Change: -20.5% | |
| ADBE Links: Profile News Message Board | |
| Charts:- Daily , Weekly | |
| Add ADBE to Watchlist: View: Get Complete ADBE Trend Analysis ➞ | |
 | NVDA NVIDIA Corporation |
| Sector: Technology | |
| SubSector: Semiconductor - Specialized | |
| MarketCap: 143476 Millions | |
| Recent Price: 840.35 Smart Investing & Trading Score: 31 | |
| Day Percent Change: -3.87% Day Change: -33.80 | |
| Week Change: -4.71% Year-to-date Change: 69.7% | |
| NVDA Links: Profile News Message Board | |
| Charts:- Daily , Weekly | |
| Add NVDA to Watchlist: View: Get Complete NVDA Trend Analysis ➞ | |
 | CRM salesforce.com, inc. |
| Sector: Technology | |
| SubSector: Application Software | |
| MarketCap: 137120 Millions | |
| Recent Price: 276.32 Smart Investing & Trading Score: 0 | |
| Day Percent Change: -0.39% Day Change: -1.09 | |
| Week Change: -6.12% Year-to-date Change: 5.0% | |
| CRM Links: Profile News Message Board | |
| Charts:- Daily , Weekly | |
| Add CRM to Watchlist: View: Get Complete CRM Trend Analysis ➞ | |
 | SAP SAP SE |
| Sector: Technology | |
| SubSector: Application Software | |
| MarketCap: 129635 Millions | |
| Recent Price: 179.94 Smart Investing & Trading Score: 44 | |
| Day Percent Change: -0.34% Day Change: -0.62 | |
| Week Change: -0.46% Year-to-date Change: 16.4% | |
| SAP Links: Profile News Message Board | |
| Charts:- Daily , Weekly | |
| Add SAP to Watchlist: View: Get Complete SAP Trend Analysis ➞ | |
 | ACN Accenture plc |
| Sector: Technology | |
| SubSector: Information Technology Services | |
| MarketCap: 106627 Millions | |
| Recent Price: 314.54 Smart Investing & Trading Score: 25 | |
| Day Percent Change: 0.19% Day Change: 0.60 | |
| Week Change: -0.27% Year-to-date Change: -10.4% | |
| ACN Links: Profile News Message Board | |
| Charts:- Daily , Weekly | |
| Add ACN to Watchlist: View: Get Complete ACN Trend Analysis ➞ | |
 | ASML ASML Holding N.V. |
| Sector: Technology | |
| SubSector: Semiconductor Equipment & Materials | |
| MarketCap: 102565 Millions | |
| Recent Price: 907.61 Smart Investing & Trading Score: 26 | |
| Day Percent Change: -7.09% Day Change: -69.31 | |
| Week Change: -5.64% Year-to-date Change: 19.9% | |
| ASML Links: Profile News Message Board | |
| Charts:- Daily , Weekly | |
| Add ASML to Watchlist: View: Get Complete ASML Trend Analysis ➞ | |
 | TXN Texas Instruments Incorporated |
| Sector: Technology | |
| SubSector: Semiconductor - Broad Line | |
| MarketCap: 99509.1 Millions | |
| Recent Price: 165.70 Smart Investing & Trading Score: 44 | |
| Day Percent Change: -1.13% Day Change: -1.89 | |
| Week Change: -0.38% Year-to-date Change: -2.8% | |
| TXN Links: Profile News Message Board | |
| Charts:- Daily , Weekly | |
| Add TXN to Watchlist: View: Get Complete TXN Trend Analysis ➞ | |
 | BSY Bentley Systems, Incorporated |
| Sector: Technology | |
| SubSector: Software Application | |
| MarketCap: 98687 Millions | |
| Recent Price: 50.11 Smart Investing & Trading Score: 55 | |
| Day Percent Change: 2.47% Day Change: 1.21 | |
| Week Change: 4.03% Year-to-date Change: -4.0% | |
| BSY Links: Profile News Message Board | |
| Charts:- Daily , Weekly | |
| Add BSY to Watchlist: View: Get Complete BSY Trend Analysis ➞ | |
 | KC Kingsoft Cloud Holdings Limited |
| Sector: Technology | |
| SubSector: Software Application | |
| MarketCap: 98487 Millions | |
| Recent Price: 2.61 Smart Investing & Trading Score: 17 | |
| Day Percent Change: 0.77% Day Change: 0.02 | |
| Week Change: -3.33% Year-to-date Change: -31.0% | |
| KC Links: Profile News Message Board | |
| Charts:- Daily , Weekly | |
| Add KC to Watchlist: View: Get Complete KC Trend Analysis ➞ | |
 | IBM International Business Machines Corporation |
| Sector: Technology | |
| SubSector: Information Technology Services | |
| MarketCap: 97241.6 Millions | |
| Recent Price: 183.10 Smart Investing & Trading Score: 31 | |
| Day Percent Change: -0.35% Day Change: -0.65 | |
| Week Change: 0.46% Year-to-date Change: 12.0% | |
| IBM Links: Profile News Message Board | |
| Charts:- Daily , Weekly | |
| Add IBM to Watchlist: View: Get Complete IBM Trend Analysis ➞ | |
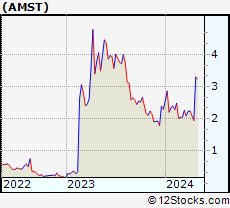 | AMST Amesite Inc. |
| Sector: Technology | |
| SubSector: Software Application | |
| MarketCap: 96787 Millions | |
| Recent Price: 1.96 Smart Investing & Trading Score: 0 | |
| Day Percent Change: -1.01% Day Change: -0.02 | |
| Week Change: -6.84% Year-to-date Change: -14.8% | |
| AMST Links: Profile News Message Board | |
| Charts:- Daily , Weekly | |
| Add AMST to Watchlist: View: Get Complete AMST Trend Analysis ➞ | |
 | MAXN Maxeon Solar Technologies, Ltd. |
| Sector: Technology | |
| SubSector: Solar | |
| MarketCap: 88787 Millions | |
| Recent Price: 2.11 Smart Investing & Trading Score: 27 | |
| Day Percent Change: 7.67% Day Change: 0.15 | |
| Week Change: -0.71% Year-to-date Change: -70.7% | |
| MAXN Links: Profile News Message Board | |
| Charts:- Daily , Weekly | |
| Add MAXN to Watchlist: View: Get Complete MAXN Trend Analysis ➞ | |
| For tabular summary view of above stock list: Summary View ➞ 0 - 25 , 25 - 50 , 50 - 75 , 75 - 100 , 100 - 125 , 125 - 150 , 150 - 175 , 175 - 200 , 200 - 225 , 225 - 250 , 250 - 275 , 275 - 300 , 300 - 325 , 325 - 350 , 350 - 375 , 375 - 400 , 400 - 425 , 425 - 450 , 450 - 475 , 475 - 500 , 500 - 525 , 525 - 550 , 550 - 575 , 575 - 600 , 600 - 625 , 625 - 650 | ||
| Click To Change The Sort Order: By Market Cap or Company Size Performance: Year-to-date, Week and Day | |
| Select Chart Type: | ||
|
Best Stocks Today 12Stocks.com |
© 2024 12Stocks.com Terms & Conditions Privacy Contact Us
All Information Provided Only For Education And Not To Be Used For Investing or Trading. See Terms & Conditions


One More Thing ... Get Best Stocks Delivered Daily!
Never Ever Miss A Move With Our Top Ten Stocks Lists
Find Best Stocks In Any Market - Bull or Bear Market
Take A Peek At Our Top Ten Stocks Lists: Daily, Weekly, Year-to-Date & Top Trends
Find Best Stocks In Any Market - Bull or Bear Market
Take A Peek At Our Top Ten Stocks Lists: Daily, Weekly, Year-to-Date & Top Trends
Technology Stocks With Best Up Trends [0-bearish to 100-bullish]: Zuora [100], GigaCloud [100], Inspire Medical[93], Allegro MicroSystems[93], Snap One[93], Encore Wire[93], Liberty Latin[90], NextNav [90], SYNNEX [88], Turkcell Iletisim[83], Model N[83]
Best Technology Stocks Year-to-Date:
MicroCloud Hologram[541.73%], MediaCo Holding[538.5%], Super Micro[237.75%], CXApp [223.55%], Smith Micro[136.08%], Uxin [133.95%], CuriosityStream [92.56%], GigaCloud [90.77%], D-Wave Quantum[90.34%], MicroStrategy [88.1%], SoundHound AI[85.28%] Best Technology Stocks This Week:
Snap One[29.85%], Mynaric AG[11.76%], Encore Wire[10.06%], Zuora [10%], Super Micro[6.85%], Applied Optoelectronics[6.68%], Luna Innovations[6.15%], NextNav [5.13%], Inspire Medical[5.08%], Sea [4.41%], Momo [4.15%] Best Technology Stocks Daily:
Zuora [11.69%], Inspire Medical[9.87%], MediaCo Holding[8.80%], Maxeon Solar[7.67%], CXApp [7.16%], FiscalNote [7.02%], Sunrun [4.99%], Snap [4.71%], Luna Innovations[4.55%], Cango [4.41%], Digital Turbine[4.20%]