


| |||||
 |  | ||||

Daily Stock Market Analysis
 Stock Market Trend The overall Smart Investing & Trading Score (measures current stock trend from 0-bearish to 100-bullish) is 63 which puts US stock market in short term neutral to bullish trend. The trend score from previous trading session is 44 and hence an improvement of trend. Current trends of some popular stocks? Here are the Smart Investing & Trading Score (measures current stock uptrend from 0-bearish to 100-bullish) of the most requested stocks at 12Stocks.com (click stock for review):
How are key market sectors doing? Shown below are the 12Stocks.com trend scores (out of 100) for key stock market sectors along with trend directions. Dig deeper by clicking market segment below:
|


| Top Hot Stocks? ➞ | Best Stocks: Year-to-Date (YTD) ➞ | This Week ➞ |
| Am I Diversified? ➞ | FANG ➞ |  |  |  |  |  |
Best GPA Calculator on the Web? Check out HighSchoolCalculator.com |
|
Get the most comprehensive stock market coverage daily at 12Stocks.com ➞ Best Stocks Today ➞ Best Stocks Weekly ➞ Best Stocks Year-to-Date ➞ Best Stocks Trends ➞  Best Stocks Today 12Stocks.com Best Nasdaq Stocks ➞ Best S&P 500 Stocks ➞ Best Tech Stocks ➞ Best Biotech Stocks ➞ |
||
| ||
| Best Performing Stocks Today Click Market Segment For Comprehensive Review |
|||||||||||
|
|||||||||||
 | China: 1.69% | ||||||||||
 | Nasdaq-100: 1.54% | ||||||||||
 | Emerging Mkts: 1.15% | ||||||||||
 | US Small Cap: 0.97% | ||||||||||
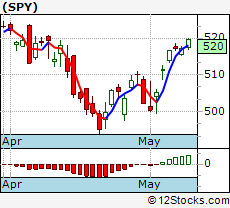
| | S&P 500: 0.95% | ||||||||||
 | US Total Market 0.93% | ||||||||||
 | Europe: 0.88% | ||||||||||
 | US Dollar: 0.45% | ||||||||||
 | Dow Jones: 0.36% | ||||||||||
 | Gold: 0.32% | ||||||||||
 | US Mid Cap: 0.29% | ||||||||||
 | Bonds: 0.23% | ||||||||||
 | US Oil: -0.06% | ||||||||||
 | Euro: -0.24% | ||||||||||
| Want Quick & Easy Overview of Best Performing Stocks? | |
| 12Stocks.com Top Ten Stocks Lists: | |
| Best Stocks Today ➞ | Best Stocks Weekly ➞ |
| Best Stocks Year-to-Date (YTD) ➞ | Best Stocks By Technical Trends ➞ |
|
| |
 The Big Picture: Best Performing Stocks The Big Picture: Best Performing Stocks |
||||||||||||||||||||||||||||||||||||||||||||||||||||||||||||||||||
|
Which are the best performing stocks this year? Which stocks are performing better recently?  Here, in this section, we quickly review the best performing stocks year to date. Then, we take a deep dive into today's stock market for best investing opportunities. First, let us take a look at the top performers year to date in the S&P 100 index (this contains most popular and commonly held US stocks). The top leaders so far this year are (click on stock name for detailed analysis)
Among the technology heavy Nasdaq 100 index, the leaders so far this year are
The large cap stock leaders this week are
|
||||||||||||||||||||||||||||||||||||||||||||||||||||||||||||||||||
|
Overview of Current Investing Landscape |
|||||||||||||||||||||||
|
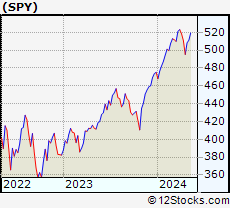
How is the overall stock market doing? Which segments of the market are performing or trending better currently? 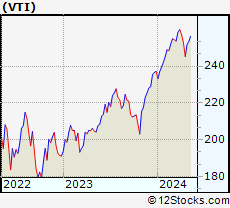 US Stock Market performance US Stock Market performanceYear-to-Date: 6.93% Let us take a look at how major US stock indexes (Dow, S&P 500, Nasdaq 100, S&P 100, Mid Cap, Small Cap), Global Markets (Europe, Emerging Markets - China, India, Latin America) and other asset classes like Bonds, Gold, Oil and ForEx are performing to get a perspective of relative performances and identify best performing asset classes to invest or trade in. Year to date, the list of various market asset classes in the order of performances -
Over the short term (this week so far), the list of various market segments in the order of performances -
|
|||||||||||||||||||||||
In a glance, the year-to-date (YTD) performances & comparisons of major asset classes:
|
Top Performing Sectors |
||||||||||||||||||||||||||||||||
 Most stocks, if not all, move in the same direction as their sector (energy, tech, etc). Sector analysis helps in identifying current trends and identify best investing opportunities. One can invest in individual stocks in a particular sector or invest in exchange traded funds that track various sectors and sub-sectors. The performance of major sectors year to date are :
Now, let us see how the major sectors are faring recently (this week so far) -
|
||||||||||||||||||||||||||||||||
In a glance, the year-to-date (YTD) performances of various sectors:
|
Global Investing with Stocks & ETFs |
||||||||||||||||||||||||||||||||||||
|
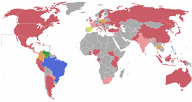
How are the global markets doing? Which countries or regional stock markets are performing or trending better currently? 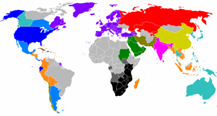 The global investing world can be segmented into Americas, Asia-Pacific and Europe. Another way to look at it from investing point of view is - Developed Markets and Emerging Markets. Emerging markets like China, Brazil & India provide some of the best investing growth opportunities today. Year to date performances of major global exchange traded funds that invest in international markets:-
Let us look at recent (this week so far) performance and trends of major global ETFs :-
|
||||||||||||||||||||||||||||||||||||
In a glance, the year-to-date performances of major global markets:
|
Commodities Daily Investing & Trading |
||||||||||||||||||||||||||||||||
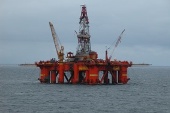
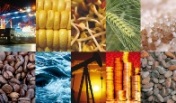 It is now possible for stock market investors to participate in commodities markets (Energy, Materials - metals including gold & silver, Agricultural & Livestock). One can implicitly participate by buying stocks of companies involved in commodity business. Or now, one can explicitly buy exchange traded funds (ETF) that track specific commodities like oil, gold and silver. Now, let us see how the major commodities are faring year to date. The commodity trackers performances year to date -
The commodity trackers performances this week -
| ||||||||||||||||||||||||||||||||
In a glance, a quick overview of year-to-date performances of major commodities:
Best Performing Stocks of 2024 Across Global Stock Markets
 Best Stocks Today 12Stocks.com |
© 2024 12Stocks.com Terms & Conditions Privacy Contact Us
All Information Provided Only For Education And Not To Be Used For Investing or Trading. See Terms & Conditions

