
 Login Sign Up


| |||||
 |  | ||||

| 12Stocks.com Market Intelligence |
Best MidCap Stocks
|
| In a hurry? Mid Cap Stocks Lists: Performance Trends Table, Stock Charts
Sort midcap stocks: Daily, Weekly, Year-to-Date, Market Cap & Trends. Filter midcap stocks list by sector: Show all, Tech, Finance, Energy, Staples, Retail, Industrial, Materials, Utilities and HealthCare Filter midcap stocks list by size:All MidCap Large Mid-Range Small |
| 12Stocks.com Mid Cap Stocks Performances & Trends Daily | |||||||||
|
|  The overall Smart Investing & Trading Score is 70 (0-bearish to 100-bullish) which puts Mid Cap index in short term neutral to bullish trend. The Smart Investing & Trading Score from previous trading session is 60 and an improvement of trend continues.
| ||||||||
Here are the Smart Investing & Trading Scores of the most requested mid cap stocks at 12Stocks.com (click stock name for detailed review):
|


| 12Stocks.com: Top Performing Mid Cap Index Stocks | ||||||||||||||||||||||||||||||||||||||||||||||||
 The top performing Mid Cap Index stocks year to date are
Now, more recently, over last week, the top performing Mid Cap Index stocks on the move are


|
||||||||||||||||||||||||||||||||||||||||||||||||
| 12Stocks.com: Investing in Midcap Index with Stocks | |
|
The following table helps investors and traders sort through current performance and trends (as measured by Smart Investing & Trading Score) of various
stocks in the Midcap Index. Quick View: Move mouse or cursor over stock symbol (ticker) to view short-term technical chart and over stock name to view long term chart. Click on  to add stock symbol to your watchlist and to add stock symbol to your watchlist and  to view watchlist. Click on any ticker or stock name for detailed market intelligence report for that stock. to view watchlist. Click on any ticker or stock name for detailed market intelligence report for that stock. |
12Stocks.com Performance of Stocks in Midcap Index
| Ticker | Stock Name | Watchlist | Category | Recent Price | Smart Investing & Trading Score | Change % | YTD Change% |
| FICO | Fair Isaac |   | Technology | 1784.68 | 100 | 17.98% | -10.58% |
| SRPT | Sarepta | | Health Care | 22.35 | 100 | 15.68% | -81.99% |
| DNA | Ginkgo Bioworks | | Health Care | 15.97 | 100 | 8.86% | 56.26% |
| ACHC | Acadia | | Health Care | 26.64 | 100 | 8.51% | -34.66% |
| HOOD | Robinhood Markets | | Financials | 145.70 | 100 | 4.71% | 269.42% |
| RUN | Sunrun | | Technology | 19.16 | 100 | 4.44% | 87.71% |
| CFLT | Confluent | | Technology | 20.52 | 100 | 4.06% | -27.36% |
| MKSI | MKS | | Technology | 136.54 | 100 | 4.01% | 29.39% |
| IONS | Ionis | | Health Care | 68.40 | 100 | 3.95% | 97.18% |
| TECH | Bio-Techne Corp | | Health Care | 62.09 | 100 | 3.62% | -12.89% |
| DD | DuPont de | | Materials | 80.99 | 100 | 3.54% | 8.56% |
| FSLR | First Solar | | Technology | 232.13 | 100 | 3.25% | 24.49% |
| IBKR | Interactive Brokers | | Financials | 70.95 | 100 | 3.15% | 55.94% |
| RARE | Ultragenyx Pharmaceutical | | Health Care | 30.91 | 100 | 3.07% | -24.88% |
| ENTG | Entegris | | Technology | 96.76 | 100 | 2.98% | -0.15% |
| AA | Alcoa Corp | | Materials | 34.83 | 100 | 2.90% | -7.39% |
| CRL | Charles River | | Health Care | 175.36 | 100 | 2.86% | -3.99% |
| STLD | Steel Dynamics | | Materials | 144.41 | 100 | 2.42% | 30.04% |
| MPW | Medical Properties | | Financials | 5.51 | 100 | 2.42% | 41.46% |
| TER | Teradyne | | Technology | 144.53 | 100 | 2.41% | 14.49% |
| QDEL | QuidelOrtho | | Health Care | 31.95 | 100 | 2.24% | -29.06% |
| CERT | Certara | | Health Care | 13.64 | 100 | 2.02% | 27.96% |
| ROST | Ross Stores | | Services & Goods | 156.17 | 100 | 1.94% | 2.96% |
| CEG | Constellation Energy | | Utilities | 357.46 | 100 | 1.87% | 47.82% |
| MRCY | Mercury | | Industrials | 82.59 | 100 | 1.74% | 95.16% |
| For chart view version of above stock list: Chart View ➞ 0 - 25 , 25 - 50 , 50 - 75 , 75 - 100 , 100 - 125 , 125 - 150 , 150 - 175 , 175 - 200 , 200 - 225 , 225 - 250 , 250 - 275 , 275 - 300 , 300 - 325 , 325 - 350 , 350 - 375 , 375 - 400 , 400 - 425 , 425 - 450 , 450 - 475 , 475 - 500 , 500 - 525 , 525 - 550 , 550 - 575 , 575 - 600 , 600 - 625 , 625 - 650 , 650 - 675 , 675 - 700 , 700 - 725 , 725 - 750 , 750 - 775 | ||
 | Click To Change The Sort Order: By Market Cap or Company Size Performance: Year-to-date, Week and Day |  |
|
Get the most comprehensive stock market coverage daily at 12Stocks.com ➞ Best Stocks Today ➞ Best Stocks Weekly ➞ Best Stocks Year-to-Date ➞ Best Stocks Trends ➞  Best Stocks Today 12Stocks.com Best Nasdaq Stocks ➞ Best S&P 500 Stocks ➞ Best Tech Stocks ➞ Best Biotech Stocks ➞ |
| Detailed Overview of Midcap Stocks |
| Midcap Technical Overview, Leaders & Laggards, Top Midcap ETF Funds & Detailed Midcap Stocks List, Charts, Trends & More |
| Midcap: Technical Analysis, Trends & YTD Performance | |
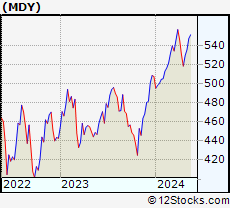
| MidCap segment as represented by
MDY, an exchange-traded fund [ETF], holds basket of about four hundred midcap stocks from across all major sectors of the US stock market. The midcap index (contains stocks like Green Mountain Coffee Roasters and Tractor Supply Company) is up by 5.96788% and is currently underperforming the overall market by -8.79002% year-to-date. Below is a quick view of technical charts and trends: | |
 MDY Weekly Chart |
|
| Long Term Trend: Very Good | |
| Medium Term Trend: Not Good | |
 MDY Daily Chart |
|
| Short Term Trend: Very Good | |
| Overall Trend Score: 70 | |
| YTD Performance: 5.96788% | |
| **Trend Scores & Views Are Only For Educational Purposes And Not For Investing | |
| 12Stocks.com: Investing in Midcap Index using Exchange Traded Funds | |
|
The following table shows list of key exchange traded funds (ETF) that
help investors track Midcap index. The following list also includes leveraged ETF funds that track twice or thrice the daily returns of Midcap indices. Short or inverse ETF funds move in the opposite direction to the index they track and are useful during market pullbacks or during bear markets. Quick View: Move mouse or cursor over ETF symbol (ticker) to view short-term technical chart and over ETF name to view long term chart. Click on ticker or stock name for detailed view. Click on to add stock symbol to your watchlist and to view watchlist. |
12Stocks.com List of ETFs that track Midcap Index
| Ticker | ETF Name | Watchlist | Recent Price | Smart Investing & Trading Score | Change % | Week % | Year-to-date % |
| IJH | iShares Core S&P Mid-Cap ETF | | 65.57 | 70 | 0.122156 | 0.814883 | 6.12728% |
| IWR | iShares Russell Mid-Cap ETF | | 96.94 | 80 | 0.435143 | 1.095 | 10.4451% |
| MDY | S&P MidCap 400 ETF | | 598.78 | 70 | 0.135458 | 0.799623 | 5.96788% |
| IWP | iShares Russell Mid-Cap Growth ETF | | 143.46 | 60 | 1.06375 | 0.709021 | 12.7484% |
| IWS | iShares Russell Mid-Cap Value ETF | | 140.24 | 90 | 0.293213 | 1.2417 | 9.61902% |
| XMLV | Invesco S&P MidCap Low Volatility ETF | | 63.15 | 40 | -0.468716 | 0.529449 | 5.75473% |
| IJK | iShares S&P Mid-Cap 400 Growth ETF | | 96.25 | 70 | 0.176936 | 0.669386 | 6.02707% |
| IJJ | iShares S&P Mid-Cap 400 Value ETF | | 130.47 | 70 | 0.138153 | 0.850274 | 5.90097% |
| MYY | ProShares Short Midcap400 -1x Shares | | 17.72 | 10 | -0.221847 | -0.638093 | -5.50223% |
| UMDD | ProShares UltraPro MidCap400 3x Shares | | 25.88 | 70 | 0.622084 | 2.09476 | -1.51345% |
| MZZ | ProShares UltraShort MidCap400 -2x Shares | | 8.16 | 10 | -0.237155 | -1.19976 | -15.2687% |
| MVV | ProShares Ultra MidCap400 2X Shares | | 69.74 | 70 | 0.273185 | 1.4105 | 3.63664% |
| SMDD | ProShares UltraPro Short MidCap400 -3x Shares | | 13.01 | 20 | -0.306513 | -1.99919 | -26.369% |
| 12Stocks.com: Charts, Trends, Fundamental Data and Performances of MidCap Stocks | |
|
We now take in-depth look at all MidCap stocks including charts, multi-period performances and overall trends (as measured by Smart Investing & Trading Score). One can sort MidCap stocks (click link to choose) by Daily, Weekly and by Year-to-Date performances. Also, one can sort by size of the company or by market capitalization. |
| Select Your Default Chart Type: | |||||
| |||||
| Click on stock symbol or name for detailed view. Click on to add stock symbol to your watchlist and to view watchlist. Quick View: Move mouse or cursor over "Daily" to quickly view daily technical stock chart and over "Weekly" to view weekly technical stock chart. | |||||

 | FICO Fair Isaac Corp |
| Sector: Technology | |
| SubSector: Software - Application | |
| MarketCap: 36773.4 Millions | |
| Recent Price: 1784.68 Smart Investing & Trading Score: 100 | |
| Day Percent Change: 17.979% Day Change: 314.59 | |
| Week Change: 15.6495% Year-to-date Change: -10.6% | |
| FICO Links: Profile News Message Board | |
| Charts:- Daily , Weekly | |
| Add FICO to Watchlist: View: Get Complete FICO Trend Analysis ➞ | |
 | SRPT Sarepta Therapeutics Inc |
| Sector: Health Care | |
| SubSector: Biotechnology | |
| MarketCap: 1828.22 Millions | |
| Recent Price: 22.35 Smart Investing & Trading Score: 100 | |
| Day Percent Change: 15.6832% Day Change: 3.12 | |
| Week Change: 22.3987% Year-to-date Change: -82.0% | |
| SRPT Links: Profile News Message Board | |
| Charts:- Daily , Weekly | |
| Add SRPT to Watchlist: View: Get Complete SRPT Trend Analysis ➞ | |
 | DNA Ginkgo Bioworks Holdings Inc |
| Sector: Health Care | |
| SubSector: Biotechnology | |
| MarketCap: 660.08 Millions | |
| Recent Price: 15.97 Smart Investing & Trading Score: 100 | |
| Day Percent Change: 8.86162% Day Change: 1.1 | |
| Week Change: 38.5082% Year-to-date Change: 56.3% | |
| DNA Links: Profile News Message Board | |
| Charts:- Daily , Weekly | |
| Add DNA to Watchlist: View: Get Complete DNA Trend Analysis ➞ | |
 | ACHC Acadia Healthcare Company Inc |
| Sector: Health Care | |
| SubSector: Medical Care Facilities | |
| MarketCap: 2190.46 Millions | |
| Recent Price: 26.64 Smart Investing & Trading Score: 100 | |
| Day Percent Change: 8.51324% Day Change: 1.82 | |
| Week Change: 8.33672% Year-to-date Change: -34.7% | |
| ACHC Links: Profile News Message Board | |
| Charts:- Daily , Weekly | |
| Add ACHC to Watchlist: View: Get Complete ACHC Trend Analysis ➞ | |
 | HOOD Robinhood Markets Inc |
| Sector: Financials | |
| SubSector: Capital Markets | |
| MarketCap: 89978.4 Millions | |
| Recent Price: 145.70 Smart Investing & Trading Score: 100 | |
| Day Percent Change: 4.71468% Day Change: 2.89 | |
| Week Change: 14.9054% Year-to-date Change: 269.4% | |
| HOOD Links: Profile News Message Board | |
| Charts:- Daily , Weekly | |
| Add HOOD to Watchlist: View: Get Complete HOOD Trend Analysis ➞ | |
 | RUN Sunrun Inc |
| Sector: Technology | |
| SubSector: Solar | |
| MarketCap: 4194.72 Millions | |
| Recent Price: 19.16 Smart Investing & Trading Score: 100 | |
| Day Percent Change: 4.44142% Day Change: 0.56 | |
| Week Change: 19.4081% Year-to-date Change: 87.7% | |
| RUN Links: Profile News Message Board | |
| Charts:- Daily , Weekly | |
| Add RUN to Watchlist: View: Get Complete RUN Trend Analysis ➞ | |
 | CFLT Confluent Inc |
| Sector: Technology | |
| SubSector: Software - Infrastructure | |
| MarketCap: 6667.35 Millions | |
| Recent Price: 20.52 Smart Investing & Trading Score: 100 | |
| Day Percent Change: 4.0568% Day Change: 0.85 | |
| Week Change: 3.95137% Year-to-date Change: -27.4% | |
| CFLT Links: Profile News Message Board | |
| Charts:- Daily , Weekly | |
| Add CFLT to Watchlist: View: Get Complete CFLT Trend Analysis ➞ | |
 | MKSI MKS Inc |
| Sector: Technology | |
| SubSector: Scientific & Technical Instruments | |
| MarketCap: 7017.44 Millions | |
| Recent Price: 136.54 Smart Investing & Trading Score: 100 | |
| Day Percent Change: 4.0067% Day Change: 5.4 | |
| Week Change: 10.1662% Year-to-date Change: 29.4% | |
| MKSI Links: Profile News Message Board | |
| Charts:- Daily , Weekly | |
| Add MKSI to Watchlist: View: Get Complete MKSI Trend Analysis ➞ | |
 | IONS Ionis Pharmaceuticals Inc |
| Sector: Health Care | |
| SubSector: Biotechnology | |
| MarketCap: 9759.53 Millions | |
| Recent Price: 68.40 Smart Investing & Trading Score: 100 | |
| Day Percent Change: 3.95137% Day Change: 1.93 | |
| Week Change: 6.94184% Year-to-date Change: 97.2% | |
| IONS Links: Profile News Message Board | |
| Charts:- Daily , Weekly | |
| Add IONS to Watchlist: View: Get Complete IONS Trend Analysis ➞ | |
 | TECH Bio-Techne Corp |
| Sector: Health Care | |
| SubSector: Biotechnology | |
| MarketCap: 8463.45 Millions | |
| Recent Price: 62.09 Smart Investing & Trading Score: 100 | |
| Day Percent Change: 3.6215% Day Change: 2.48 | |
| Week Change: 21.2222% Year-to-date Change: -12.9% | |
| TECH Links: Profile News Message Board | |
| Charts:- Daily , Weekly | |
| Add TECH to Watchlist: View: Get Complete TECH Trend Analysis ➞ | |
 | DD DuPont de Nemours Inc |
| Sector: Materials | |
| SubSector: Specialty Chemicals | |
| MarketCap: 32584.5 Millions | |
| Recent Price: 80.99 Smart Investing & Trading Score: 100 | |
| Day Percent Change: 3.54129% Day Change: 2.65 | |
| Week Change: 6.83287% Year-to-date Change: 8.6% | |
| DD Links: Profile News Message Board | |
| Charts:- Daily , Weekly | |
| Add DD to Watchlist: View: Get Complete DD Trend Analysis ➞ | |
 | FSLR First Solar Inc |
| Sector: Technology | |
| SubSector: Solar | |
| MarketCap: 22000.8 Millions | |
| Recent Price: 232.13 Smart Investing & Trading Score: 100 | |
| Day Percent Change: 3.25149% Day Change: 6.23 | |
| Week Change: 5.91322% Year-to-date Change: 24.5% | |
| FSLR Links: Profile News Message Board | |
| Charts:- Daily , Weekly | |
| Add FSLR to Watchlist: View: Get Complete FSLR Trend Analysis ➞ | |
 | IBKR Interactive Brokers Group Inc |
| Sector: Financials | |
| SubSector: Capital Markets | |
| MarketCap: 26786.1 Millions | |
| Recent Price: 70.95 Smart Investing & Trading Score: 100 | |
| Day Percent Change: 3.15499% Day Change: 2.48 | |
| Week Change: 10.0683% Year-to-date Change: 55.9% | |
| IBKR Links: Profile News Message Board | |
| Charts:- Daily , Weekly | |
| Add IBKR to Watchlist: View: Get Complete IBKR Trend Analysis ➞ | |
 | RARE Ultragenyx Pharmaceutical Inc |
| Sector: Health Care | |
| SubSector: Biotechnology | |
| MarketCap: 3066.55 Millions | |
| Recent Price: 30.91 Smart Investing & Trading Score: 100 | |
| Day Percent Change: 3.06769% Day Change: 0.75 | |
| Week Change: 7.47566% Year-to-date Change: -24.9% | |
| RARE Links: Profile News Message Board | |
| Charts:- Daily , Weekly | |
| Add RARE to Watchlist: View: Get Complete RARE Trend Analysis ➞ | |
 | ENTG Entegris Inc |
| Sector: Technology | |
| SubSector: Semiconductor Equipment & Materials | |
| MarketCap: 12428.2 Millions | |
| Recent Price: 96.76 Smart Investing & Trading Score: 100 | |
| Day Percent Change: 2.97999% Day Change: 2.62 | |
| Week Change: 3.4977% Year-to-date Change: -0.1% | |
| ENTG Links: Profile News Message Board | |
| Charts:- Daily , Weekly | |
| Add ENTG to Watchlist: View: Get Complete ENTG Trend Analysis ➞ | |
 | AA Alcoa Corp |
| Sector: Materials | |
| SubSector: Aluminum | |
| MarketCap: 8241.26 Millions | |
| Recent Price: 34.83 Smart Investing & Trading Score: 100 | |
| Day Percent Change: 2.89513% Day Change: 1.08 | |
| Week Change: 11.5274% Year-to-date Change: -7.4% | |
| AA Links: Profile News Message Board | |
| Charts:- Daily , Weekly | |
| Add AA to Watchlist: View: Get Complete AA Trend Analysis ➞ | |
 | CRL Charles River Laboratories International Inc |
| Sector: Health Care | |
| SubSector: Diagnostics & Research | |
| MarketCap: 8070.63 Millions | |
| Recent Price: 175.36 Smart Investing & Trading Score: 100 | |
| Day Percent Change: 2.86251% Day Change: 6.32 | |
| Week Change: 17.3369% Year-to-date Change: -4.0% | |
| CRL Links: Profile News Message Board | |
| Charts:- Daily , Weekly | |
| Add CRL to Watchlist: View: Get Complete CRL Trend Analysis ➞ | |
 | STLD Steel Dynamics Inc |
| Sector: Materials | |
| SubSector: Steel | |
| MarketCap: 19818.2 Millions | |
| Recent Price: 144.41 Smart Investing & Trading Score: 100 | |
| Day Percent Change: 2.41844% Day Change: 3.68 | |
| Week Change: 5.89572% Year-to-date Change: 30.0% | |
| STLD Links: Profile News Message Board | |
| Charts:- Daily , Weekly | |
| Add STLD to Watchlist: View: Get Complete STLD Trend Analysis ➞ | |
 | MPW Medical Properties Trust Inc |
| Sector: Financials | |
| SubSector: REIT - Healthcare Facilities | |
| MarketCap: 2771.07 Millions | |
| Recent Price: 5.51 Smart Investing & Trading Score: 100 | |
| Day Percent Change: 2.41636% Day Change: 0.09 | |
| Week Change: 13.1417% Year-to-date Change: 41.5% | |
| MPW Links: Profile News Message Board | |
| Charts:- Daily , Weekly | |
| Add MPW to Watchlist: View: Get Complete MPW Trend Analysis ➞ | |
 | TER Teradyne, Inc |
| Sector: Technology | |
| SubSector: Semiconductor Equipment & Materials | |
| MarketCap: 19120.6 Millions | |
| Recent Price: 144.53 Smart Investing & Trading Score: 100 | |
| Day Percent Change: 2.41284% Day Change: 3.11 | |
| Week Change: 8.49411% Year-to-date Change: 14.5% | |
| TER Links: Profile News Message Board | |
| Charts:- Daily , Weekly | |
| Add TER to Watchlist: View: Get Complete TER Trend Analysis ➞ | |
 | QDEL QuidelOrtho Corporation |
| Sector: Health Care | |
| SubSector: Medical Devices | |
| MarketCap: 1947.39 Millions | |
| Recent Price: 31.95 Smart Investing & Trading Score: 100 | |
| Day Percent Change: 2.24% Day Change: 0.86 | |
| Week Change: 19.7078% Year-to-date Change: -29.1% | |
| QDEL Links: Profile News Message Board | |
| Charts:- Daily , Weekly | |
| Add QDEL to Watchlist: View: Get Complete QDEL Trend Analysis ➞ | |
 | CERT Certara Inc |
| Sector: Health Care | |
| SubSector: Health Information Services | |
| MarketCap: 1689.76 Millions | |
| Recent Price: 13.64 Smart Investing & Trading Score: 100 | |
| Day Percent Change: 2.01945% Day Change: 0.04 | |
| Week Change: 19.0227% Year-to-date Change: 28.0% | |
| CERT Links: Profile News Message Board | |
| Charts:- Daily , Weekly | |
| Add CERT to Watchlist: View: Get Complete CERT Trend Analysis ➞ | |
 | ROST Ross Stores, Inc |
| Sector: Services & Goods | |
| SubSector: Apparel Retail | |
| MarketCap: 49371.3 Millions | |
| Recent Price: 156.17 Smart Investing & Trading Score: 100 | |
| Day Percent Change: 1.93864% Day Change: 3.42 | |
| Week Change: 4.51047% Year-to-date Change: 3.0% | |
| ROST Links: Profile News Message Board | |
| Charts:- Daily , Weekly | |
| Add ROST to Watchlist: View: Get Complete ROST Trend Analysis ➞ | |
 | CEG Constellation Energy Corporation |
| Sector: Utilities | |
| SubSector: Utilities - Renewable | |
| MarketCap: 94215.3 Millions | |
| Recent Price: 357.46 Smart Investing & Trading Score: 100 | |
| Day Percent Change: 1.86948% Day Change: 1.61 | |
| Week Change: 5.40501% Year-to-date Change: 47.8% | |
| CEG Links: Profile News Message Board | |
| Charts:- Daily , Weekly | |
| Add CEG to Watchlist: View: Get Complete CEG Trend Analysis ➞ | |
 | MRCY Mercury Systems Inc |
| Sector: Industrials | |
| SubSector: Aerospace & Defense | |
| MarketCap: 4129.99 Millions | |
| Recent Price: 82.59 Smart Investing & Trading Score: 100 | |
| Day Percent Change: 1.73688% Day Change: 0.68 | |
| Week Change: 11.2024% Year-to-date Change: 95.2% | |
| MRCY Links: Profile News Message Board | |
| Charts:- Daily , Weekly | |
| Add MRCY to Watchlist: View: Get Complete MRCY Trend Analysis ➞ | |
| For tabular summary view of above stock list: Summary View ➞ 0 - 25 , 25 - 50 , 50 - 75 , 75 - 100 , 100 - 125 , 125 - 150 , 150 - 175 , 175 - 200 , 200 - 225 , 225 - 250 , 250 - 275 , 275 - 300 , 300 - 325 , 325 - 350 , 350 - 375 , 375 - 400 , 400 - 425 , 425 - 450 , 450 - 475 , 475 - 500 , 500 - 525 , 525 - 550 , 550 - 575 , 575 - 600 , 600 - 625 , 625 - 650 , 650 - 675 , 675 - 700 , 700 - 725 , 725 - 750 , 750 - 775 | ||
| Click To Change The Sort Order: By Market Cap or Company Size Performance: Year-to-date, Week and Day | |
| Select Chart Type: | ||
|
Best Stocks Today 12Stocks.com |
© 2025 12Stocks.com Terms & Conditions Privacy Contact Us
All Information Provided Only For Education And Not To Be Used For Investing or Trading. See Terms & Conditions


One More Thing ... Get Best Stocks Delivered Daily!
Never Ever Miss A Move With Our Top Ten Stocks Lists
Find Best Stocks In Any Market - Bull or Bear Market
Take A Peek At Our Top Ten Stocks Lists: Daily, Weekly, Year-to-Date & Top Trends
Find Best Stocks In Any Market - Bull or Bear Market
Take A Peek At Our Top Ten Stocks Lists: Daily, Weekly, Year-to-Date & Top Trends
Midcap Stocks With Best Up Trends [0-bearish to 100-bullish]: Fair Isaac[100], Sarepta [100], Ginkgo Bioworks[100], Acadia [100], Robinhood Markets[100], Sunrun [100], Confluent [100], MKS [100], Ionis [100], Bio-Techne Corp[100], DuPont de[100]
Best Midcap Stocks Year-to-Date:
Lucid [695.38%], MP Materials[332.947%], Wolfspeed [307.01%], Robinhood Markets[269.422%], SSR Mining[227.298%], Viasat [224.029%], Western Digital[181.204%], QuantumScape Corp[158.123%], Palantir Technologies[148.77%], Roblox [126.886%], Celsius [116.544%] Best Midcap Stocks This Week:
Wolfspeed [1961.98%], Splunk [38.7643%], Ginkgo Bioworks[38.5082%], Stericycle [31.4276%], Sarepta [22.3987%], Bio-Techne Corp[21.2222%], Electronic Arts[20.1076%], QuidelOrtho [19.7078%], Western Digital[19.6645%], Sunrun [19.4081%], Certara [19.0227%] Best Midcap Stocks Daily:
Fair Isaac[17.979%], Sarepta [15.6832%], Ginkgo Bioworks[8.86162%], Teladoc Health[8.71795%], Acadia [8.51324%], Agilon Health[8%], Coinbase Global[7.48187%], Celanese Corp[6.98937%], Bentley [6.91632%], AMC Entertainment[6.77966%], Kinsale Capital[6.00493%]