
 Login Sign Up


| |||||
 |  | ||||

| 12Stocks.com Market Intelligence |
Best MidCap Stocks
|
| In a hurry? Mid Cap Stocks Lists: Performance Trends Table, Stock Charts
Sort midcap stocks: Daily, Weekly, Year-to-Date, Market Cap & Trends. Filter midcap stocks list by sector: Show all, Tech, Finance, Energy, Staples, Retail, Industrial, Materials, Utilities and HealthCare Filter midcap stocks list by size:All MidCap Large Mid-Range Small |
| 12Stocks.com Mid Cap Stocks Performances & Trends Daily | |||||||||
|
|  The overall Smart Investing & Trading Score is 7 (0-bearish to 100-bullish) which puts Mid Cap index in short term bearish trend. The Smart Investing & Trading Score from previous trading session is 38 and hence a deterioration of trend.
| ||||||||
Here are the Smart Investing & Trading Scores of the most requested mid cap stocks at 12Stocks.com (click stock name for detailed review):
|


| 12Stocks.com: Top Performing Mid Cap Index Stocks | ||||||||||||||||||||||||||||||||||||||||||||||||
 The top performing Mid Cap Index stocks year to date are
Now, more recently, over last week, the top performing Mid Cap Index stocks on the move are


|
||||||||||||||||||||||||||||||||||||||||||||||||
| 12Stocks.com: Investing in Midcap Index with Stocks | |
|
The following table helps investors and traders sort through current performance and trends (as measured by Smart Investing & Trading Score) of various
stocks in the Midcap Index. Quick View: Move mouse or cursor over stock symbol (ticker) to view short-term technical chart and over stock name to view long term chart. Click on  to add stock symbol to your watchlist and to add stock symbol to your watchlist and  to view watchlist. Click on any ticker or stock name for detailed market intelligence report for that stock. to view watchlist. Click on any ticker or stock name for detailed market intelligence report for that stock. |
12Stocks.com Performance of Stocks in Midcap Index
| Ticker | Stock Name | Watchlist | Category | Recent Price | Smart Investing & Trading Score | Change % | YTD Change% |
| XPO | XPO Logistics |   | Transports | 106.38 | 0 | -1.01% | 21.45% |
| PK | Park Hotels | | Services & Goods | 15.97 | 0 | -0.99% | 4.38% |
| SRCL | Stericycle | | Industrials | 44.30 | 0 | -0.96% | -10.61% |
| WSC | WillScot | | Transports | 36.61 | 0 | -0.95% | -17.73% |
| AYI | Acuity | | Technology | 246.02 | 0 | -0.92% | 20.11% |
| WEX | WEX | | Services & Goods | 209.41 | 0 | -0.88% | 7.64% |
| POOL | Pool | | Consumer Staples | 359.50 | 0 | -0.84% | -9.83% |
| DOX | Amdocs | | Technology | 83.36 | 0 | -0.75% | -5.15% |
| HSIC | Henry Schein | | Services & Goods | 68.78 | 0 | -0.72% | -9.15% |
| FAF | First American | | Financials | 53.21 | 0 | -0.67% | -17.43% |
| APO | Apollo Global | | Financials | 107.77 | 0 | -0.56% | 15.65% |
| IPGP | IPG Photonics | | Technology | 83.55 | 0 | -0.51% | -23.02% |
| CTSH | Cognizant | | Technology | 65.37 | 0 | -0.47% | -13.45% |
| ROK | Rockwell Automation | | Industrials | 269.75 | 0 | -0.45% | -13.12% |
| ALLE | Allegion | | Services & Goods | 121.06 | 0 | -0.41% | -4.44% |
| AME | AMETEK | | Industrials | 173.98 | 0 | -0.39% | 5.51% |
| BEN | Franklin Resources | | Financials | 22.77 | 0 | -0.31% | -23.56% |
| MSM | MSC Industrial | | Services & Goods | 90.96 | 0 | -0.31% | -10.17% |
| TAP | Molson Coors | | Consumer Staples | 57.08 | 0 | -0.31% | -6.75% |
| RBA | Ritchie Bros. | | Services & Goods | 71.37 | 0 | -0.29% | 6.70% |
| SPG | Simon Property | | Financials | 140.18 | 0 | -0.25% | -1.72% |
| JHG | Janus Henderson | | Financials | 31.16 | 0 | -0.19% | 3.35% |
| JKHY | Jack Henry | | Technology | 162.52 | 0 | -0.10% | -0.54% |
| DLB | Dolby | | Technology | 77.58 | 0 | -0.10% | -9.98% |
| LECO | Loln Electric | | Industrials | 219.33 | 0 | -0.09% | 0.86% |
| For chart view version of above stock list: Chart View ➞ 0 - 25 , 25 - 50 , 50 - 75 , 75 - 100 , 100 - 125 , 125 - 150 , 150 - 175 , 175 - 200 , 200 - 225 , 225 - 250 , 250 - 275 , 275 - 300 , 300 - 325 , 325 - 350 , 350 - 375 , 375 - 400 , 400 - 425 , 425 - 450 , 450 - 475 , 475 - 500 , 500 - 525 , 525 - 550 , 550 - 575 , 575 - 600 , 600 - 625 , 625 - 650 , 650 - 675 , 675 - 700 , 700 - 725 , 725 - 750 , 750 - 775 | ||
 | Click To Change The Sort Order: By Market Cap or Company Size Performance: Year-to-date, Week and Day |  |
|
Get the most comprehensive stock market coverage daily at 12Stocks.com ➞ Best Stocks Today ➞ Best Stocks Weekly ➞ Best Stocks Year-to-Date ➞ Best Stocks Trends ➞  Best Stocks Today 12Stocks.com Best Nasdaq Stocks ➞ Best S&P 500 Stocks ➞ Best Tech Stocks ➞ Best Biotech Stocks ➞ |
| Detailed Overview of Midcap Stocks |
| Midcap Technical Overview, Leaders & Laggards, Top Midcap ETF Funds & Detailed Midcap Stocks List, Charts, Trends & More |
| Midcap: Technical Analysis, Trends & YTD Performance | |
| MidCap segment as represented by
MDY, an exchange-traded fund [ETF], holds basket of about four hundred midcap stocks from across all major sectors of the US stock market. The midcap index (contains stocks like Green Mountain Coffee Roasters and Tractor Supply Company) is up by 3.12% and is currently underperforming the overall market by -1.42% year-to-date. Below is a quick view of technical charts and trends: | |
 MDY Weekly Chart |
|
| Long Term Trend: Not Good | |
| Medium Term Trend: Not Good | |
 MDY Daily Chart |
|
| Short Term Trend: Not Good | |
| Overall Trend Score: 7 | |
| YTD Performance: 3.12% | |
| **Trend Scores & Views Are Only For Educational Purposes And Not For Investing | |
| 12Stocks.com: Investing in Midcap Index using Exchange Traded Funds | |
|
The following table shows list of key exchange traded funds (ETF) that
help investors track Midcap index. The following list also includes leveraged ETF funds that track twice or thrice the daily returns of Midcap indices. Short or inverse ETF funds move in the opposite direction to the index they track and are useful during market pullbacks or during bear markets. Quick View: Move mouse or cursor over ETF symbol (ticker) to view short-term technical chart and over ETF name to view long term chart. Click on ticker or stock name for detailed view. Click on to add stock symbol to your watchlist and to view watchlist. |
12Stocks.com List of ETFs that track Midcap Index
| Ticker | ETF Name | Watchlist | Recent Price | Smart Investing & Trading Score | Change % | Week % | Year-to-date % |
| IJH | iShares Core S&P Mid-Cap | | 57.16 | 7 | 0.05 | -1.14 | 3.12% |
| MDY | SPDR S&P MidCap 400 ETF | | 523.21 | 7 | 0.09 | -1.17 | 3.12% |
| IWR | iShares Russell Mid-Cap | | 79.48 | 7 | -0.18 | -1.29 | 2.25% |
| IWP | iShares Russell Mid-Cap Growth | | 107.46 | 7 | 0.02 | -1.39 | 2.87% |
| IWS | iShares Russell Mid-Cap Value | | 118.77 | 7 | -0.08 | -1.02 | 2.13% |
| IJK | iShares S&P Mid-Cap 400 Growth | | 85.83 | 7 | -0.01 | -1.34 | 8.34% |
| IJJ | iShares S&P Mid-Cap 400 Value | | 111.28 | 22 | 0.20 | -0.85 | -2.42% |
| XMLV | PowerShares S&P MidCap Low Volatil ETF | | 54.69 | 47 | 0.46 | 0.07 | 2.84% |
| MVV | ProShares Ultra MidCap400 | | 60.02 | 17 | 0.22 | -2.3 | 3.68% |
| SMDD | ProShares UltraPro Short MidCap400 | | 12.18 | 88 | -0.25 | 2.95 | -9.54% |
| UMDD | ProShares UltraPro MidCap400 | | 23.07 | 0 | -0.82 | -3.71 | 3.36% |
| MZZ | ProShares UltraShort MidCap400 | | 11.96 | 53 | 1.18 | 2.4 | -4.86% |
| MYY | ProShares Short MidCap400 | | 20.79 | 48 | -0.57 | 0 | -3.1% |
| 12Stocks.com: Charts, Trends, Fundamental Data and Performances of MidCap Stocks | |
|
We now take in-depth look at all MidCap stocks including charts, multi-period performances and overall trends (as measured by Smart Investing & Trading Score). One can sort MidCap stocks (click link to choose) by Daily, Weekly and by Year-to-Date performances. Also, one can sort by size of the company or by market capitalization. |
| Select Your Default Chart Type: | |||||
| |||||
| Click on stock symbol or name for detailed view. Click on to add stock symbol to your watchlist and to view watchlist. Quick View: Move mouse or cursor over "Daily" to quickly view daily technical stock chart and over "Weekly" to view weekly technical stock chart. | |||||

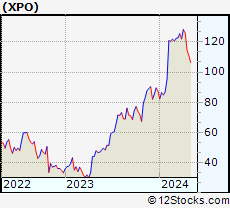 | XPO XPO Logistics, Inc. |
| Sector: Transports | |
| SubSector: Air Delivery & Freight Services | |
| MarketCap: 4049.08 Millions | |
| Recent Price: 106.38 Smart Investing & Trading Score: 0 | |
| Day Percent Change: -1.01% Day Change: -1.08 | |
| Week Change: -4.08% Year-to-date Change: 21.5% | |
| XPO Links: Profile News Message Board | |
| Charts:- Daily , Weekly | |
| Add XPO to Watchlist: View: Get Complete XPO Trend Analysis ➞ | |
 | PK Park Hotels & Resorts Inc. |
| Sector: Services & Goods | |
| SubSector: Lodging | |
| MarketCap: 2221.06 Millions | |
| Recent Price: 15.97 Smart Investing & Trading Score: 0 | |
| Day Percent Change: -0.99% Day Change: -0.16 | |
| Week Change: -3.62% Year-to-date Change: 4.4% | |
| PK Links: Profile News Message Board | |
| Charts:- Daily , Weekly | |
| Add PK to Watchlist: View: Get Complete PK Trend Analysis ➞ | |
 | SRCL Stericycle, Inc. |
| Sector: Industrials | |
| SubSector: Waste Management | |
| MarketCap: 4285.78 Millions | |
| Recent Price: 44.30 Smart Investing & Trading Score: 0 | |
| Day Percent Change: -0.96% Day Change: -0.43 | |
| Week Change: -4.34% Year-to-date Change: -10.6% | |
| SRCL Links: Profile News Message Board | |
| Charts:- Daily , Weekly | |
| Add SRCL to Watchlist: View: Get Complete SRCL Trend Analysis ➞ | |
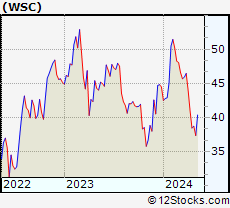 | WSC WillScot Corporation |
| Sector: Transports | |
| SubSector: Rental & Leasing Services | |
| MarketCap: 1050.44 Millions | |
| Recent Price: 36.61 Smart Investing & Trading Score: 0 | |
| Day Percent Change: -0.95% Day Change: -0.35 | |
| Week Change: -5.45% Year-to-date Change: -17.7% | |
| WSC Links: Profile News Message Board | |
| Charts:- Daily , Weekly | |
| Add WSC to Watchlist: View: Get Complete WSC Trend Analysis ➞ | |
 | AYI Acuity Brands, Inc. |
| Sector: Technology | |
| SubSector: Diversified Electronics | |
| MarketCap: 3356.66 Millions | |
| Recent Price: 246.02 Smart Investing & Trading Score: 0 | |
| Day Percent Change: -0.92% Day Change: -2.28 | |
| Week Change: -2.43% Year-to-date Change: 20.1% | |
| AYI Links: Profile News Message Board | |
| Charts:- Daily , Weekly | |
| Add AYI to Watchlist: View: Get Complete AYI Trend Analysis ➞ | |
 | WEX WEX Inc. |
| Sector: Services & Goods | |
| SubSector: Business Services | |
| MarketCap: 4312.22 Millions | |
| Recent Price: 209.41 Smart Investing & Trading Score: 0 | |
| Day Percent Change: -0.88% Day Change: -1.85 | |
| Week Change: -3.31% Year-to-date Change: 7.6% | |
| WEX Links: Profile News Message Board | |
| Charts:- Daily , Weekly | |
| Add WEX to Watchlist: View: Get Complete WEX Trend Analysis ➞ | |
 | POOL Pool Corporation |
| Sector: Consumer Staples | |
| SubSector: Sporting Goods | |
| MarketCap: 7479.64 Millions | |
| Recent Price: 359.50 Smart Investing & Trading Score: 0 | |
| Day Percent Change: -0.84% Day Change: -3.03 | |
| Week Change: -3.14% Year-to-date Change: -9.8% | |
| POOL Links: Profile News Message Board | |
| Charts:- Daily , Weekly | |
| Add POOL to Watchlist: View: Get Complete POOL Trend Analysis ➞ | |
 | DOX Amdocs Limited |
| Sector: Technology | |
| SubSector: Business Software & Services | |
| MarketCap: 6895.48 Millions | |
| Recent Price: 83.36 Smart Investing & Trading Score: 0 | |
| Day Percent Change: -0.75% Day Change: -0.63 | |
| Week Change: -1.91% Year-to-date Change: -5.2% | |
| DOX Links: Profile News Message Board | |
| Charts:- Daily , Weekly | |
| Add DOX to Watchlist: View: Get Complete DOX Trend Analysis ➞ | |
 | HSIC Henry Schein, Inc. |
| Sector: Services & Goods | |
| SubSector: Medical Equipment Wholesale | |
| MarketCap: 6760.9 Millions | |
| Recent Price: 68.78 Smart Investing & Trading Score: 0 | |
| Day Percent Change: -0.72% Day Change: -0.50 | |
| Week Change: -5.95% Year-to-date Change: -9.2% | |
| HSIC Links: Profile News Message Board | |
| Charts:- Daily , Weekly | |
| Add HSIC to Watchlist: View: Get Complete HSIC Trend Analysis ➞ | |
 | FAF First American Financial Corporation |
| Sector: Financials | |
| SubSector: Property & Casualty Insurance | |
| MarketCap: 4163.82 Millions | |
| Recent Price: 53.21 Smart Investing & Trading Score: 0 | |
| Day Percent Change: -0.67% Day Change: -0.36 | |
| Week Change: -1.86% Year-to-date Change: -17.4% | |
| FAF Links: Profile News Message Board | |
| Charts:- Daily , Weekly | |
| Add FAF to Watchlist: View: Get Complete FAF Trend Analysis ➞ | |
 | APO Apollo Global Management, Inc. |
| Sector: Financials | |
| SubSector: Diversified Investments | |
| MarketCap: 12706 Millions | |
| Recent Price: 107.77 Smart Investing & Trading Score: 0 | |
| Day Percent Change: -0.56% Day Change: -0.61 | |
| Week Change: -3.97% Year-to-date Change: 15.7% | |
| APO Links: Profile News Message Board | |
| Charts:- Daily , Weekly | |
| Add APO to Watchlist: View: Get Complete APO Trend Analysis ➞ | |
 | IPGP IPG Photonics Corporation |
| Sector: Technology | |
| SubSector: Semiconductor Equipment & Materials | |
| MarketCap: 6059.38 Millions | |
| Recent Price: 83.55 Smart Investing & Trading Score: 0 | |
| Day Percent Change: -0.51% Day Change: -0.43 | |
| Week Change: -5.49% Year-to-date Change: -23.0% | |
| IPGP Links: Profile News Message Board | |
| Charts:- Daily , Weekly | |
| Add IPGP to Watchlist: View: Get Complete IPGP Trend Analysis ➞ | |
 | CTSH Cognizant Technology Solutions Corporation |
| Sector: Technology | |
| SubSector: Information Technology Services | |
| MarketCap: 26249.7 Millions | |
| Recent Price: 65.37 Smart Investing & Trading Score: 0 | |
| Day Percent Change: -0.47% Day Change: -0.31 | |
| Week Change: -2.35% Year-to-date Change: -13.5% | |
| CTSH Links: Profile News Message Board | |
| Charts:- Daily , Weekly | |
| Add CTSH to Watchlist: View: Get Complete CTSH Trend Analysis ➞ | |
 | ROK Rockwell Automation, Inc. |
| Sector: Industrials | |
| SubSector: Diversified Machinery | |
| MarketCap: 15666.1 Millions | |
| Recent Price: 269.75 Smart Investing & Trading Score: 0 | |
| Day Percent Change: -0.45% Day Change: -1.21 | |
| Week Change: -3.7% Year-to-date Change: -13.1% | |
| ROK Links: Profile News Message Board | |
| Charts:- Daily , Weekly | |
| Add ROK to Watchlist: View: Get Complete ROK Trend Analysis ➞ | |
 | ALLE Allegion plc |
| Sector: Services & Goods | |
| SubSector: Security & Protection Services | |
| MarketCap: 8515.93 Millions | |
| Recent Price: 121.06 Smart Investing & Trading Score: 0 | |
| Day Percent Change: -0.41% Day Change: -0.50 | |
| Week Change: -2.25% Year-to-date Change: -4.4% | |
| ALLE Links: Profile News Message Board | |
| Charts:- Daily , Weekly | |
| Add ALLE to Watchlist: View: Get Complete ALLE Trend Analysis ➞ | |
 | AME AMETEK, Inc. |
| Sector: Industrials | |
| SubSector: Diversified Machinery | |
| MarketCap: 16611.8 Millions | |
| Recent Price: 173.98 Smart Investing & Trading Score: 0 | |
| Day Percent Change: -0.39% Day Change: -0.68 | |
| Week Change: -1.99% Year-to-date Change: 5.5% | |
| AME Links: Profile News Message Board | |
| Charts:- Daily , Weekly | |
| Add AME to Watchlist: View: Get Complete AME Trend Analysis ➞ | |
 | BEN Franklin Resources, Inc. |
| Sector: Financials | |
| SubSector: Asset Management | |
| MarketCap: 9419.73 Millions | |
| Recent Price: 22.77 Smart Investing & Trading Score: 0 | |
| Day Percent Change: -0.31% Day Change: -0.07 | |
| Week Change: -8.88% Year-to-date Change: -23.6% | |
| BEN Links: Profile News Message Board | |
| Charts:- Daily , Weekly | |
| Add BEN to Watchlist: View: Get Complete BEN Trend Analysis ➞ | |
 | MSM MSC Industrial Direct Co., Inc. |
| Sector: Services & Goods | |
| SubSector: Industrial Equipment Wholesale | |
| MarketCap: 2701.88 Millions | |
| Recent Price: 90.96 Smart Investing & Trading Score: 0 | |
| Day Percent Change: -0.31% Day Change: -0.28 | |
| Week Change: -2.42% Year-to-date Change: -10.2% | |
| MSM Links: Profile News Message Board | |
| Charts:- Daily , Weekly | |
| Add MSM to Watchlist: View: Get Complete MSM Trend Analysis ➞ | |
 | TAP Molson Coors Beverage Company |
| Sector: Consumer Staples | |
| SubSector: Beverages - Brewers | |
| MarketCap: 8619.97 Millions | |
| Recent Price: 57.08 Smart Investing & Trading Score: 0 | |
| Day Percent Change: -0.31% Day Change: -0.18 | |
| Week Change: -8.73% Year-to-date Change: -6.8% | |
| TAP Links: Profile News Message Board | |
| Charts:- Daily , Weekly | |
| Add TAP to Watchlist: View: Get Complete TAP Trend Analysis ➞ | |
 | RBA Ritchie Bros. Auctioneers Incorporated |
| Sector: Services & Goods | |
| SubSector: Business Services | |
| MarketCap: 3491.02 Millions | |
| Recent Price: 71.37 Smart Investing & Trading Score: 0 | |
| Day Percent Change: -0.29% Day Change: -0.21 | |
| Week Change: -2.47% Year-to-date Change: 6.7% | |
| RBA Links: Profile News Message Board | |
| Charts:- Daily , Weekly | |
| Add RBA to Watchlist: View: Get Complete RBA Trend Analysis ➞ | |
 | SPG Simon Property Group, Inc. |
| Sector: Financials | |
| SubSector: REIT - Retail | |
| MarketCap: 17959.6 Millions | |
| Recent Price: 140.18 Smart Investing & Trading Score: 0 | |
| Day Percent Change: -0.25% Day Change: -0.35 | |
| Week Change: -1.53% Year-to-date Change: -1.7% | |
| SPG Links: Profile News Message Board | |
| Charts:- Daily , Weekly | |
| Add SPG to Watchlist: View: Get Complete SPG Trend Analysis ➞ | |
 | JHG Janus Henderson Group plc |
| Sector: Financials | |
| SubSector: Asset Management | |
| MarketCap: 2992.33 Millions | |
| Recent Price: 31.16 Smart Investing & Trading Score: 0 | |
| Day Percent Change: -0.19% Day Change: -0.06 | |
| Week Change: -1.67% Year-to-date Change: 3.4% | |
| JHG Links: Profile News Message Board | |
| Charts:- Daily , Weekly | |
| Add JHG to Watchlist: View: Get Complete JHG Trend Analysis ➞ | |
 | JKHY Jack Henry & Associates, Inc. |
| Sector: Technology | |
| SubSector: Information Technology Services | |
| MarketCap: 10695.4 Millions | |
| Recent Price: 162.52 Smart Investing & Trading Score: 0 | |
| Day Percent Change: -0.10% Day Change: -0.17 | |
| Week Change: -1.43% Year-to-date Change: -0.5% | |
| JKHY Links: Profile News Message Board | |
| Charts:- Daily , Weekly | |
| Add JKHY to Watchlist: View: Get Complete JKHY Trend Analysis ➞ | |
 | DLB Dolby Laboratories, Inc. |
| Sector: Technology | |
| SubSector: Diversified Electronics | |
| MarketCap: 5618.16 Millions | |
| Recent Price: 77.58 Smart Investing & Trading Score: 0 | |
| Day Percent Change: -0.10% Day Change: -0.08 | |
| Week Change: -2.05% Year-to-date Change: -10.0% | |
| DLB Links: Profile News Message Board | |
| Charts:- Daily , Weekly | |
| Add DLB to Watchlist: View: Get Complete DLB Trend Analysis ➞ | |
 | LECO Lincoln Electric Holdings, Inc. |
| Sector: Industrials | |
| SubSector: Small Tools & Accessories | |
| MarketCap: 4085.06 Millions | |
| Recent Price: 219.33 Smart Investing & Trading Score: 0 | |
| Day Percent Change: -0.09% Day Change: -0.20 | |
| Week Change: -4.61% Year-to-date Change: 0.9% | |
| LECO Links: Profile News Message Board | |
| Charts:- Daily , Weekly | |
| Add LECO to Watchlist: View: Get Complete LECO Trend Analysis ➞ | |
| For tabular summary view of above stock list: Summary View ➞ 0 - 25 , 25 - 50 , 50 - 75 , 75 - 100 , 100 - 125 , 125 - 150 , 150 - 175 , 175 - 200 , 200 - 225 , 225 - 250 , 250 - 275 , 275 - 300 , 300 - 325 , 325 - 350 , 350 - 375 , 375 - 400 , 400 - 425 , 425 - 450 , 450 - 475 , 475 - 500 , 500 - 525 , 525 - 550 , 550 - 575 , 575 - 600 , 600 - 625 , 625 - 650 , 650 - 675 , 675 - 700 , 700 - 725 , 725 - 750 , 750 - 775 | ||
| Click To Change The Sort Order: By Market Cap or Company Size Performance: Year-to-date, Week and Day | |
| Select Chart Type: | ||
|
Best Stocks Today 12Stocks.com |
© 2024 12Stocks.com Terms & Conditions Privacy Contact Us
All Information Provided Only For Education And Not To Be Used For Investing or Trading. See Terms & Conditions


One More Thing ... Get Best Stocks Delivered Daily!
Never Ever Miss A Move With Our Top Ten Stocks Lists
Find Best Stocks In Any Market - Bull or Bear Market
Take A Peek At Our Top Ten Stocks Lists: Daily, Weekly, Year-to-Date & Top Trends
Find Best Stocks In Any Market - Bull or Bear Market
Take A Peek At Our Top Ten Stocks Lists: Daily, Weekly, Year-to-Date & Top Trends
Midcap Stocks With Best Up Trends [0-bearish to 100-bullish]: Pinterest [100], Garmin [100], Brookfield Renewable[100], Amcor [100], United [100], Axalta Coating[100], DuPont de[100], Clean Harbors[100], Equitable [100], Columbia Banking[100], Playtika Holding[100]
Best Midcap Stocks Year-to-Date:
Vistra Energy[99.53%], AppLovin [76.53%], ShockWave Medical[73.09%], EMCOR [64.9%], Constellation Energy[57.66%], CAVA [56.42%], Tenet [53.43%], Spotify [51.42%], Natera [50.3%], Wingstop [49.65%], Antero Resources[44%] Best Midcap Stocks This Week:
Tenet [20.62%], Pinterest [19.2%], Bio-Techne [14.67%], New York[14.48%], Garmin [13.92%], Sensata Technologies[11.46%], Brookfield Renewable[10.3%], Woodward [10.15%], Maravai LifeSciences[9.61%], Axalta Coating[9.58%], Amcor [9.25%] Best Midcap Stocks Daily:
New York[28.30%], Pinterest [21.02%], Bio-Techne [16.22%], Garmin [13.12%], Brookfield Renewable[10.63%], Amcor [9.62%], United [8.88%], Axalta Coating[8.81%], DuPont de[8.01%], Clean Harbors[6.81%], Verisk Analytics[6.81%]