
 Login Sign Up


| |||||
 |  | ||||

| 12Stocks.com Market Intelligence |
Best MidCap Stocks
|
| In a hurry? Mid Cap Stocks Lists: Performance Trends Table, Stock Charts
Sort midcap stocks: Daily, Weekly, Year-to-Date, Market Cap & Trends. Filter midcap stocks list by sector: Show all, Tech, Finance, Energy, Staples, Retail, Industrial, Materials, Utilities and HealthCare Filter midcap stocks list by size:All MidCap Large Mid-Range Small |
| 12Stocks.com Mid Cap Stocks Performances & Trends Daily | |||||||||
|
|  The overall Smart Investing & Trading Score is 63 (0-bearish to 100-bullish) which puts Mid Cap index in short term neutral to bullish trend. The Smart Investing & Trading Score from previous trading session is 44 and an improvement of trend continues.
| ||||||||
Here are the Smart Investing & Trading Scores of the most requested mid cap stocks at 12Stocks.com (click stock name for detailed review):
|


| 12Stocks.com: Top Performing Mid Cap Index Stocks | ||||||||||||||||||||||||||||||||||||||||||||||||
 The top performing Mid Cap Index stocks year to date are
Now, more recently, over last week, the top performing Mid Cap Index stocks on the move are


|
||||||||||||||||||||||||||||||||||||||||||||||||
| 12Stocks.com: Investing in Midcap Index with Stocks | |
|
The following table helps investors and traders sort through current performance and trends (as measured by Smart Investing & Trading Score) of various
stocks in the Midcap Index. Quick View: Move mouse or cursor over stock symbol (ticker) to view short-term technical chart and over stock name to view long term chart. Click on  to add stock symbol to your watchlist and to add stock symbol to your watchlist and  to view watchlist. Click on any ticker or stock name for detailed market intelligence report for that stock. to view watchlist. Click on any ticker or stock name for detailed market intelligence report for that stock. |
12Stocks.com Performance of Stocks in Midcap Index
| Ticker | Stock Name | Watchlist | Category | Recent Price | Smart Investing & Trading Score | Change % | YTD Change% |
| ENPH | Enphase Energy |   | Technology | 107.17 | 83 | -5.56% | -18.90% |
| UAL | United Airlines | | Transports | 52.67 | 83 | -2.52% | 27.65% |
| JWN | Nordstrom | | Services & Goods | 19.26 | 83 | -2.33% | 4.39% |
| M | Macy s | | Services & Goods | 18.73 | 83 | -1.52% | -6.91% |
| INGR | Ingredion | | Consumer Staples | 115.10 | 83 | 0.67% | 6.05% |
| PAG | Penske Automotive | | Services & Goods | 153.18 | 83 | 0.64% | -4.57% |
| LDOS | Leidos | | Technology | 128.90 | 83 | 0.17% | 19.09% |
| LPLA | LPL Financial | | Financials | 264.54 | 83 | -0.88% | 16.22% |
| FMC | FMC | | Materials | 58.40 | 83 | -0.43% | -7.38% |
| KMPR | Kemper | | Financials | 60.40 | 82 | 3.32% | 24.10% |
| AGR | Avangrid | | Utilities | 37.02 | 81 | 0.49% | 14.22% |
| FE | FirstEnergy | | Utilities | 38.30 | 81 | 0.47% | 4.47% |
| L | Loews | | Financials | 76.81 | 81 | 0.12% | 10.38% |
| ETR | Entergy | | Utilities | 106.46 | 81 | -0.67% | 5.21% |
| CSGP | CoStar | | Financials | 91.95 | 80 | 8.66% | 5.22% |
| DXCM | DexCom | | Health Care | 137.87 | 80 | 2.89% | 11.10% |
| APH | Amphenol | | Technology | 116.31 | 80 | 1.79% | 17.33% |
| WMB | Williams | | Energy | 39.25 | 80 | 1.21% | 12.69% |
| WELL | Welltower | | Financials | 93.70 | 80 | 0.83% | 3.91% |
| OZK | Bank OZK | | Financials | 46.37 | 80 | 0.63% | -6.94% |
| THG | Hanover Insurance | | Financials | 132.62 | 80 | -0.67% | 9.22% |
| FNF | Fidelity National | | Financials | 50.64 | 80 | -0.41% | -0.74% |
| ZION | Zions Ban | | Financials | 42.17 | 80 | 1.01% | -3.88% |
| MUSA | Murphy USA | | Services & Goods | 421.11 | 78 | 1.06% | 18.10% |
| MPW | Medical Properties | | Financials | 4.57 | 78 | -1.51% | -6.92% |
| For chart view version of above stock list: Chart View ➞ 0 - 25 , 25 - 50 , 50 - 75 , 75 - 100 , 100 - 125 , 125 - 150 , 150 - 175 , 175 - 200 , 200 - 225 , 225 - 250 , 250 - 275 , 275 - 300 , 300 - 325 , 325 - 350 , 350 - 375 , 375 - 400 , 400 - 425 , 425 - 450 , 450 - 475 , 475 - 500 , 500 - 525 , 525 - 550 , 550 - 575 , 575 - 600 , 600 - 625 , 625 - 650 , 650 - 675 , 675 - 700 , 700 - 725 , 725 - 750 , 750 - 775 | ||
 | Click To Change The Sort Order: By Market Cap or Company Size Performance: Year-to-date, Week and Day |  |
|
Get the most comprehensive stock market coverage daily at 12Stocks.com ➞ Best Stocks Today ➞ Best Stocks Weekly ➞ Best Stocks Year-to-Date ➞ Best Stocks Trends ➞  Best Stocks Today 12Stocks.com Best Nasdaq Stocks ➞ Best S&P 500 Stocks ➞ Best Tech Stocks ➞ Best Biotech Stocks ➞ |
| Detailed Overview of Midcap Stocks |
| Midcap Technical Overview, Leaders & Laggards, Top Midcap ETF Funds & Detailed Midcap Stocks List, Charts, Trends & More |
| Midcap: Technical Analysis, Trends & YTD Performance | |
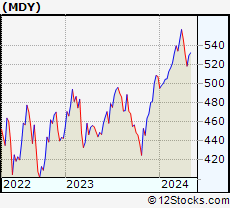
| MidCap segment as represented by
MDY, an exchange-traded fund [ETF], holds basket of about four hundred midcap stocks from across all major sectors of the US stock market. The midcap index (contains stocks like Green Mountain Coffee Roasters and Tractor Supply Company) is up by 4.42% and is currently underperforming the overall market by -1.24% year-to-date. Below is a quick view of technical charts and trends: | |
 MDY Weekly Chart |
|
| Long Term Trend: Very Good | |
| Medium Term Trend: Not Good | |
 MDY Daily Chart |
|
| Short Term Trend: Very Good | |
| Overall Trend Score: 63 | |
| YTD Performance: 4.42% | |
| **Trend Scores & Views Are Only For Educational Purposes And Not For Investing | |
| 12Stocks.com: Investing in Midcap Index using Exchange Traded Funds | |
|
The following table shows list of key exchange traded funds (ETF) that
help investors track Midcap index. The following list also includes leveraged ETF funds that track twice or thrice the daily returns of Midcap indices. Short or inverse ETF funds move in the opposite direction to the index they track and are useful during market pullbacks or during bear markets. Quick View: Move mouse or cursor over ETF symbol (ticker) to view short-term technical chart and over ETF name to view long term chart. Click on ticker or stock name for detailed view. Click on to add stock symbol to your watchlist and to view watchlist. |
12Stocks.com List of ETFs that track Midcap Index
| Ticker | ETF Name | Watchlist | Recent Price | Smart Investing & Trading Score | Change % | Week % | Year-to-date % |
| IJH | iShares Core S&P Mid-Cap | | 57.87 | 68 | 0.03 | 2.28 | 4.4% |
| IWR | iShares Russell Mid-Cap | | 80.41 | 63 | 0.05 | 2.22 | 3.45% |
| IWP | iShares Russell Mid-Cap Growth | | 108.49 | 58 | -0.13 | 2.64 | 3.86% |
| MDY | SPDR S&P MidCap 400 ETF | | 529.80 | 63 | 0.00 | 2.22 | 4.42% |
| IJK | iShares S&P Mid-Cap 400 Growth | | 86.99 | 63 | 0.07 | 2.52 | 9.81% |
| IWS | iShares Russell Mid-Cap Value | | 119.97 | 68 | 0.09 | 1.97 | 3.16% |
| IJJ | iShares S&P Mid-Cap 400 Value | | 112.59 | 51 | 0.11 | 1.85 | -1.27% |
| XMLV | PowerShares S&P MidCap Low Volatil ETF | | 55.04 | 75 | 0.24 | 1.62 | 3.5% |
| MVV | ProShares Ultra MidCap400 | | 61.60 | 41 | 0.10 | 4.41 | 6.41% |
| UMDD | ProShares UltraPro MidCap400 | | 24.09 | 63 | -0.08 | 6.77 | 7.93% |
| SMDD | ProShares UltraPro Short MidCap400 | | 11.84 | 32 | 1.58 | -5.79 | -12.1% |
| MYY | ProShares Short MidCap400 | | 20.74 | 32 | 0.00 | -2.12 | -3.33% |
| MZZ | ProShares UltraShort MidCap400 | | 11.69 | 34 | 0.26 | -3.95 | -7.01% |
| 12Stocks.com: Charts, Trends, Fundamental Data and Performances of MidCap Stocks | |
|
We now take in-depth look at all MidCap stocks including charts, multi-period performances and overall trends (as measured by Smart Investing & Trading Score). One can sort MidCap stocks (click link to choose) by Daily, Weekly and by Year-to-Date performances. Also, one can sort by size of the company or by market capitalization. |
| Select Your Default Chart Type: | |||||
| |||||
| Click on stock symbol or name for detailed view. Click on to add stock symbol to your watchlist and to view watchlist. Quick View: Move mouse or cursor over "Daily" to quickly view daily technical stock chart and over "Weekly" to view weekly technical stock chart. | |||||

 | ENPH Enphase Energy, Inc. |
| Sector: Technology | |
| SubSector: Semiconductor Equipment & Materials | |
| MarketCap: 4047.48 Millions | |
| Recent Price: 107.17 Smart Investing & Trading Score: 83 | |
| Day Percent Change: -5.56% Day Change: -6.31 | |
| Week Change: 0.65% Year-to-date Change: -18.9% | |
| ENPH Links: Profile News Message Board | |
| Charts:- Daily , Weekly | |
| Add ENPH to Watchlist: View: Get Complete ENPH Trend Analysis ➞ | |
 | UAL United Airlines Holdings, Inc. |
| Sector: Transports | |
| SubSector: Major Airlines | |
| MarketCap: 8083.25 Millions | |
| Recent Price: 52.67 Smart Investing & Trading Score: 83 | |
| Day Percent Change: -2.52% Day Change: -1.36 | |
| Week Change: 2.51% Year-to-date Change: 27.7% | |
| UAL Links: Profile News Message Board | |
| Charts:- Daily , Weekly | |
| Add UAL to Watchlist: View: Get Complete UAL Trend Analysis ➞ | |
 | JWN Nordstrom, Inc. |
| Sector: Services & Goods | |
| SubSector: Apparel Stores | |
| MarketCap: 3351.68 Millions | |
| Recent Price: 19.26 Smart Investing & Trading Score: 83 | |
| Day Percent Change: -2.33% Day Change: -0.46 | |
| Week Change: 1.8% Year-to-date Change: 4.4% | |
| JWN Links: Profile News Message Board | |
| Charts:- Daily , Weekly | |
| Add JWN to Watchlist: View: Get Complete JWN Trend Analysis ➞ | |
 | M Macy s, Inc. |
| Sector: Services & Goods | |
| SubSector: Department Stores | |
| MarketCap: 2391.72 Millions | |
| Recent Price: 18.73 Smart Investing & Trading Score: 83 | |
| Day Percent Change: -1.52% Day Change: -0.29 | |
| Week Change: 1.08% Year-to-date Change: -6.9% | |
| M Links: Profile News Message Board | |
| Charts:- Daily , Weekly | |
| Add M to Watchlist: View: Get Complete M Trend Analysis ➞ | |
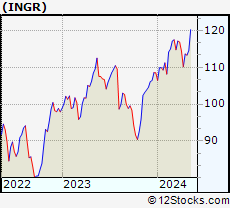 | INGR Ingredion Incorporated |
| Sector: Consumer Staples | |
| SubSector: Processed & Packaged Goods | |
| MarketCap: 5064.18 Millions | |
| Recent Price: 115.10 Smart Investing & Trading Score: 83 | |
| Day Percent Change: 0.67% Day Change: 0.77 | |
| Week Change: 1.3% Year-to-date Change: 6.1% | |
| INGR Links: Profile News Message Board | |
| Charts:- Daily , Weekly | |
| Add INGR to Watchlist: View: Get Complete INGR Trend Analysis ➞ | |
 | PAG Penske Automotive Group, Inc. |
| Sector: Services & Goods | |
| SubSector: Auto Dealerships | |
| MarketCap: 2088.81 Millions | |
| Recent Price: 153.18 Smart Investing & Trading Score: 83 | |
| Day Percent Change: 0.64% Day Change: 0.98 | |
| Week Change: 3.54% Year-to-date Change: -4.6% | |
| PAG Links: Profile News Message Board | |
| Charts:- Daily , Weekly | |
| Add PAG to Watchlist: View: Get Complete PAG Trend Analysis ➞ | |
 | LDOS Leidos Holdings, Inc. |
| Sector: Technology | |
| SubSector: Information Technology Services | |
| MarketCap: 11707.5 Millions | |
| Recent Price: 128.90 Smart Investing & Trading Score: 83 | |
| Day Percent Change: 0.17% Day Change: 0.22 | |
| Week Change: 3.19% Year-to-date Change: 19.1% | |
| LDOS Links: Profile News Message Board | |
| Charts:- Daily , Weekly | |
| Add LDOS to Watchlist: View: Get Complete LDOS Trend Analysis ➞ | |
 | LPLA LPL Financial Holdings Inc. |
| Sector: Financials | |
| SubSector: Investment Brokerage - National | |
| MarketCap: 4104.65 Millions | |
| Recent Price: 264.54 Smart Investing & Trading Score: 83 | |
| Day Percent Change: -0.88% Day Change: -2.36 | |
| Week Change: 0.74% Year-to-date Change: 16.2% | |
| LPLA Links: Profile News Message Board | |
| Charts:- Daily , Weekly | |
| Add LPLA to Watchlist: View: Get Complete LPLA Trend Analysis ➞ | |
 | FMC FMC Corporation |
| Sector: Materials | |
| SubSector: Chemicals - Major Diversified | |
| MarketCap: 9068.36 Millions | |
| Recent Price: 58.40 Smart Investing & Trading Score: 83 | |
| Day Percent Change: -0.43% Day Change: -0.25 | |
| Week Change: 1% Year-to-date Change: -7.4% | |
| FMC Links: Profile News Message Board | |
| Charts:- Daily , Weekly | |
| Add FMC to Watchlist: View: Get Complete FMC Trend Analysis ➞ | |
 | KMPR Kemper Corporation |
| Sector: Financials | |
| SubSector: Property & Casualty Insurance | |
| MarketCap: 4035.12 Millions | |
| Recent Price: 60.40 Smart Investing & Trading Score: 82 | |
| Day Percent Change: 3.32% Day Change: 1.94 | |
| Week Change: 4.12% Year-to-date Change: 24.1% | |
| KMPR Links: Profile News Message Board | |
| Charts:- Daily , Weekly | |
| Add KMPR to Watchlist: View: Get Complete KMPR Trend Analysis ➞ | |
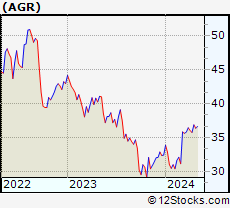 | AGR Avangrid, Inc. |
| Sector: Utilities | |
| SubSector: Gas Utilities | |
| MarketCap: 14337.3 Millions | |
| Recent Price: 37.02 Smart Investing & Trading Score: 81 | |
| Day Percent Change: 0.49% Day Change: 0.18 | |
| Week Change: 0.41% Year-to-date Change: 14.2% | |
| AGR Links: Profile News Message Board | |
| Charts:- Daily , Weekly | |
| Add AGR to Watchlist: View: Get Complete AGR Trend Analysis ➞ | |
 | FE FirstEnergy Corp. |
| Sector: Utilities | |
| SubSector: Electric Utilities | |
| MarketCap: 20754.1 Millions | |
| Recent Price: 38.30 Smart Investing & Trading Score: 81 | |
| Day Percent Change: 0.47% Day Change: 0.18 | |
| Week Change: 0.34% Year-to-date Change: 4.5% | |
| FE Links: Profile News Message Board | |
| Charts:- Daily , Weekly | |
| Add FE to Watchlist: View: Get Complete FE Trend Analysis ➞ | |
 | L Loews Corporation |
| Sector: Financials | |
| SubSector: Property & Casualty Insurance | |
| MarketCap: 10768.2 Millions | |
| Recent Price: 76.81 Smart Investing & Trading Score: 81 | |
| Day Percent Change: 0.12% Day Change: 0.09 | |
| Week Change: 1.55% Year-to-date Change: 10.4% | |
| L Links: Profile News Message Board | |
| Charts:- Daily , Weekly | |
| Add L to Watchlist: View: Get Complete L Trend Analysis ➞ | |
 | ETR Entergy Corporation |
| Sector: Utilities | |
| SubSector: Electric Utilities | |
| MarketCap: 17545 Millions | |
| Recent Price: 106.46 Smart Investing & Trading Score: 81 | |
| Day Percent Change: -0.67% Day Change: -0.72 | |
| Week Change: -0.29% Year-to-date Change: 5.2% | |
| ETR Links: Profile News Message Board | |
| Charts:- Daily , Weekly | |
| Add ETR to Watchlist: View: Get Complete ETR Trend Analysis ➞ | |
 | CSGP CoStar Group, Inc. |
| Sector: Financials | |
| SubSector: Property Management | |
| MarketCap: 21454.4 Millions | |
| Recent Price: 91.95 Smart Investing & Trading Score: 80 | |
| Day Percent Change: 8.66% Day Change: 7.33 | |
| Week Change: 9.13% Year-to-date Change: 5.2% | |
| CSGP Links: Profile News Message Board | |
| Charts:- Daily , Weekly | |
| Add CSGP to Watchlist: View: Get Complete CSGP Trend Analysis ➞ | |
 | DXCM DexCom, Inc. |
| Sector: Health Care | |
| SubSector: Medical Laboratories & Research | |
| MarketCap: 19559 Millions | |
| Recent Price: 137.87 Smart Investing & Trading Score: 80 | |
| Day Percent Change: 2.89% Day Change: 3.87 | |
| Week Change: 5.48% Year-to-date Change: 11.1% | |
| DXCM Links: Profile News Message Board | |
| Charts:- Daily , Weekly | |
| Add DXCM to Watchlist: View: Get Complete DXCM Trend Analysis ➞ | |
 | APH Amphenol Corporation |
| Sector: Technology | |
| SubSector: Diversified Electronics | |
| MarketCap: 23422 Millions | |
| Recent Price: 116.31 Smart Investing & Trading Score: 80 | |
| Day Percent Change: 1.79% Day Change: 2.05 | |
| Week Change: 5.57% Year-to-date Change: 17.3% | |
| APH Links: Profile News Message Board | |
| Charts:- Daily , Weekly | |
| Add APH to Watchlist: View: Get Complete APH Trend Analysis ➞ | |
 | WMB The Williams Companies, Inc. |
| Sector: Energy | |
| SubSector: Oil & Gas Pipelines | |
| MarketCap: 16851.5 Millions | |
| Recent Price: 39.25 Smart Investing & Trading Score: 80 | |
| Day Percent Change: 1.21% Day Change: 0.47 | |
| Week Change: 1.92% Year-to-date Change: 12.7% | |
| WMB Links: Profile News Message Board | |
| Charts:- Daily , Weekly | |
| Add WMB to Watchlist: View: Get Complete WMB Trend Analysis ➞ | |
 | WELL Welltower Inc. |
| Sector: Financials | |
| SubSector: REIT - Healthcare Facilities | |
| MarketCap: 21398.8 Millions | |
| Recent Price: 93.70 Smart Investing & Trading Score: 80 | |
| Day Percent Change: 0.83% Day Change: 0.77 | |
| Week Change: 2.61% Year-to-date Change: 3.9% | |
| WELL Links: Profile News Message Board | |
| Charts:- Daily , Weekly | |
| Add WELL to Watchlist: View: Get Complete WELL Trend Analysis ➞ | |
 | OZK Bank OZK |
| Sector: Financials | |
| SubSector: Regional - Southeast Banks | |
| MarketCap: 2518.35 Millions | |
| Recent Price: 46.37 Smart Investing & Trading Score: 80 | |
| Day Percent Change: 0.63% Day Change: 0.29 | |
| Week Change: 3.2% Year-to-date Change: -6.9% | |
| OZK Links: Profile News Message Board | |
| Charts:- Daily , Weekly | |
| Add OZK to Watchlist: View: Get Complete OZK Trend Analysis ➞ | |
 | THG The Hanover Insurance Group, Inc. |
| Sector: Financials | |
| SubSector: Property & Casualty Insurance | |
| MarketCap: 3677.92 Millions | |
| Recent Price: 132.62 Smart Investing & Trading Score: 80 | |
| Day Percent Change: -0.67% Day Change: -0.90 | |
| Week Change: 1.17% Year-to-date Change: 9.2% | |
| THG Links: Profile News Message Board | |
| Charts:- Daily , Weekly | |
| Add THG to Watchlist: View: Get Complete THG Trend Analysis ➞ | |
 | FNF Fidelity National Financial, Inc. |
| Sector: Financials | |
| SubSector: Surety & Title Insurance | |
| MarketCap: 6532.18 Millions | |
| Recent Price: 50.64 Smart Investing & Trading Score: 80 | |
| Day Percent Change: -0.41% Day Change: -0.21 | |
| Week Change: 3.83% Year-to-date Change: -0.7% | |
| FNF Links: Profile News Message Board | |
| Charts:- Daily , Weekly | |
| Add FNF to Watchlist: View: Get Complete FNF Trend Analysis ➞ | |
 | ZION Zions Bancorporation, National Association |
| Sector: Financials | |
| SubSector: Regional - Pacific Banks | |
| MarketCap: 4577.89 Millions | |
| Recent Price: 42.17 Smart Investing & Trading Score: 80 | |
| Day Percent Change: 1.01% Day Change: 0.42 | |
| Week Change: 5.64% Year-to-date Change: -3.9% | |
| ZION Links: Profile News Message Board | |
| Charts:- Daily , Weekly | |
| Add ZION to Watchlist: View: Get Complete ZION Trend Analysis ➞ | |
 | MUSA Murphy USA Inc. |
| Sector: Services & Goods | |
| SubSector: Specialty Retail, Other | |
| MarketCap: 3133.14 Millions | |
| Recent Price: 421.11 Smart Investing & Trading Score: 78 | |
| Day Percent Change: 1.06% Day Change: 4.40 | |
| Week Change: 0.93% Year-to-date Change: 18.1% | |
| MUSA Links: Profile News Message Board | |
| Charts:- Daily , Weekly | |
| Add MUSA to Watchlist: View: Get Complete MUSA Trend Analysis ➞ | |
 | MPW Medical Properties Trust, Inc. |
| Sector: Financials | |
| SubSector: REIT - Healthcare Facilities | |
| MarketCap: 8586.74 Millions | |
| Recent Price: 4.57 Smart Investing & Trading Score: 78 | |
| Day Percent Change: -1.51% Day Change: -0.07 | |
| Week Change: 3.39% Year-to-date Change: -6.9% | |
| MPW Links: Profile News Message Board | |
| Charts:- Daily , Weekly | |
| Add MPW to Watchlist: View: Get Complete MPW Trend Analysis ➞ | |
| For tabular summary view of above stock list: Summary View ➞ 0 - 25 , 25 - 50 , 50 - 75 , 75 - 100 , 100 - 125 , 125 - 150 , 150 - 175 , 175 - 200 , 200 - 225 , 225 - 250 , 250 - 275 , 275 - 300 , 300 - 325 , 325 - 350 , 350 - 375 , 375 - 400 , 400 - 425 , 425 - 450 , 450 - 475 , 475 - 500 , 500 - 525 , 525 - 550 , 550 - 575 , 575 - 600 , 600 - 625 , 625 - 650 , 650 - 675 , 675 - 700 , 700 - 725 , 725 - 750 , 750 - 775 | ||
| Click To Change The Sort Order: By Market Cap or Company Size Performance: Year-to-date, Week and Day | |
| Select Chart Type: | ||
|
Best Stocks Today 12Stocks.com |
© 2024 12Stocks.com Terms & Conditions Privacy Contact Us
All Information Provided Only For Education And Not To Be Used For Investing or Trading. See Terms & Conditions


One More Thing ... Get Best Stocks Delivered Daily!
Never Ever Miss A Move With Our Top Ten Stocks Lists
Find Best Stocks In Any Market - Bull or Bear Market
Take A Peek At Our Top Ten Stocks Lists: Daily, Weekly, Year-to-Date & Top Trends
Find Best Stocks In Any Market - Bull or Bear Market
Take A Peek At Our Top Ten Stocks Lists: Daily, Weekly, Year-to-Date & Top Trends
Midcap Stocks With Best Up Trends [0-bearish to 100-bullish]: Hasbro [100], Wabtec [100], Allegro Micro[100], Microchip [100], Synchrony Financial[100], EQT [100], Prosperity Bancshares[100], Range Resources[100], Virtu Financial[100], Crane Co[100], National Fuel[100]
Best Midcap Stocks Year-to-Date:
Vistra Energy[82.92%], AppLovin [74.52%], ShockWave Medical[72.58%], Constellation Energy[59.4%], EMCOR [57.31%], Spotify [49.66%], Natera [46.07%], Pure Storage[42.04%], Williams-Sonoma [41.5%], Wingstop [41.38%], NRG Energy[40.44%] Best Midcap Stocks This Week:
HashiCorp [23.7%], Globe Life[17.77%], Hasbro [17.66%], Tandem Diabetes[15.41%], Wabtec [13.32%], MongoDB [12.82%], Ryder System[12.4%], Microchip [11.02%], Watsco [11%], Crane Co[9.77%], Coinbase Global[9.74%] Best Midcap Stocks Daily:
Hasbro [11.85%], Wabtec [10.04%], CoStar [8.66%], Allegro Micro[8.24%], GameStop [7.58%], Watsco [6.54%], ON Semiconductor[6.24%], Hertz Global[6.23%], Sarepta [6.09%], Lattice Semiconductor[5.31%], Microchip [5.21%]