
 Login Sign Up


| |||||
 |  | ||||

| 12Stocks.com Market Intelligence |
Best MidCap Stocks
|
| In a hurry? Mid Cap Stocks Lists: Performance Trends Table, Stock Charts
Sort midcap stocks: Daily, Weekly, Year-to-Date, Market Cap & Trends. Filter midcap stocks list by sector: Show all, Tech, Finance, Energy, Staples, Retail, Industrial, Materials, Utilities and HealthCare Filter midcap stocks list by size:All MidCap Large Mid-Range Small |
| 12Stocks.com Mid Cap Stocks Performances & Trends Daily | |||||||||
|
|  The overall Smart Investing & Trading Score is 7 (0-bearish to 100-bullish) which puts Mid Cap index in short term bearish trend. The Smart Investing & Trading Score from previous trading session is 38 and hence a deterioration of trend.
| ||||||||
Here are the Smart Investing & Trading Scores of the most requested mid cap stocks at 12Stocks.com (click stock name for detailed review):
|


| 12Stocks.com: Top Performing Mid Cap Index Stocks | ||||||||||||||||||||||||||||||||||||||||||||||||
 The top performing Mid Cap Index stocks year to date are
Now, more recently, over last week, the top performing Mid Cap Index stocks on the move are


|
||||||||||||||||||||||||||||||||||||||||||||||||
| 12Stocks.com: Investing in Midcap Index with Stocks | |
|
The following table helps investors and traders sort through current performance and trends (as measured by Smart Investing & Trading Score) of various
stocks in the Midcap Index. Quick View: Move mouse or cursor over stock symbol (ticker) to view short-term technical chart and over stock name to view long term chart. Click on  to add stock symbol to your watchlist and to add stock symbol to your watchlist and  to view watchlist. Click on any ticker or stock name for detailed market intelligence report for that stock. to view watchlist. Click on any ticker or stock name for detailed market intelligence report for that stock. |
12Stocks.com Performance of Stocks in Midcap Index
| Ticker | Stock Name | Watchlist | Category | Recent Price | Smart Investing & Trading Score | Change % | YTD Change% |
| SNA | Snap-on |   | Industrials | 267.74 | 10 | -0.08% | -7.31% |
| HOG | Harley-Davidson | | Consumer Staples | 34.38 | 10 | -0.03% | -6.68% |
| DHI | D.R. Horton | | Industrials | 142.48 | 10 | -0.01% | -6.25% |
| STWD | Starwood Property | | Financials | 19.12 | 8 | 0.79% | -9.04% |
| IQV | IQVIA | | Health Care | 232.94 | 8 | 0.50% | 0.67% |
| ZBH | Zimmer Biomet | | Health Care | 119.56 | 8 | -0.60% | -1.76% |
| MUSA | Murphy USA | | Services & Goods | 411.80 | 8 | -0.49% | 15.49% |
| PNFP | Pinnacle Financial | | Financials | 78.25 | 7 | 2.02% | -10.28% |
| SOFI | SoFi Technologies | | Financials | 6.83 | 7 | 0.81% | -30.71% |
| FFIV | F5 Networks | | Technology | 166.62 | 7 | 0.79% | -6.91% |
| NVR | NVR | | Industrials | 7457.00 | 7 | 0.24% | 6.52% |
| HLT | Hilton Worldwide | | Services & Goods | 197.74 | 7 | 0.23% | 8.59% |
| ENTG | Entegris | | Technology | 123.31 | 7 | -7.23% | 2.91% |
| CRUS | Cirrus Logic | | Technology | 84.00 | 7 | -5.16% | 0.97% |
| MKSI | MKS Instruments | | Technology | 115.14 | 7 | -3.23% | 11.93% |
| MRVL | Marvell | | Technology | 63.82 | 7 | -3.17% | 5.82% |
| URI | United Rentals | | Transports | 653.76 | 7 | -2.13% | 14.01% |
| KEYS | Keysight Technologies | | Technology | 144.95 | 7 | -2.02% | -8.89% |
| NU | Nu | | Financials | 10.65 | 7 | -1.89% | 27.76% |
| TPR | Tapestry | | Consumer Staples | 39.49 | 7 | -1.08% | 7.28% |
| GNTX | Gentex | | Consumer Staples | 33.96 | 7 | -0.99% | 3.98% |
| AWI | Armstrong World | | Industrials | 114.12 | 7 | -0.66% | 16.07% |
| DLR | Digital Realty | | Financials | 137.99 | 7 | -0.57% | 2.53% |
| PSTG | Pure Storage | | Technology | 50.13 | 7 | -0.54% | 40.58% |
| HAYW | Hayward | | Industrials | 13.52 | 7 | -0.44% | -0.66% |
| For chart view version of above stock list: Chart View ➞ 0 - 25 , 25 - 50 , 50 - 75 , 75 - 100 , 100 - 125 , 125 - 150 , 150 - 175 , 175 - 200 , 200 - 225 , 225 - 250 , 250 - 275 , 275 - 300 , 300 - 325 , 325 - 350 , 350 - 375 , 375 - 400 , 400 - 425 , 425 - 450 , 450 - 475 , 475 - 500 , 500 - 525 , 525 - 550 , 550 - 575 , 575 - 600 , 600 - 625 , 625 - 650 , 650 - 675 , 675 - 700 , 700 - 725 , 725 - 750 , 750 - 775 | ||
 | Click To Change The Sort Order: By Market Cap or Company Size Performance: Year-to-date, Week and Day |  |
|
Get the most comprehensive stock market coverage daily at 12Stocks.com ➞ Best Stocks Today ➞ Best Stocks Weekly ➞ Best Stocks Year-to-Date ➞ Best Stocks Trends ➞  Best Stocks Today 12Stocks.com Best Nasdaq Stocks ➞ Best S&P 500 Stocks ➞ Best Tech Stocks ➞ Best Biotech Stocks ➞ |
| Detailed Overview of Midcap Stocks |
| Midcap Technical Overview, Leaders & Laggards, Top Midcap ETF Funds & Detailed Midcap Stocks List, Charts, Trends & More |
| Midcap: Technical Analysis, Trends & YTD Performance | |
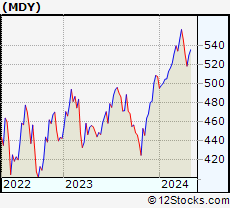
| MidCap segment as represented by
MDY, an exchange-traded fund [ETF], holds basket of about four hundred midcap stocks from across all major sectors of the US stock market. The midcap index (contains stocks like Green Mountain Coffee Roasters and Tractor Supply Company) is up by 3.12% and is currently underperforming the overall market by -1.42% year-to-date. Below is a quick view of technical charts and trends: | |
 MDY Weekly Chart |
|
| Long Term Trend: Not Good | |
| Medium Term Trend: Not Good | |
 MDY Daily Chart |
|
| Short Term Trend: Not Good | |
| Overall Trend Score: 7 | |
| YTD Performance: 3.12% | |
| **Trend Scores & Views Are Only For Educational Purposes And Not For Investing | |
| 12Stocks.com: Investing in Midcap Index using Exchange Traded Funds | |
|
The following table shows list of key exchange traded funds (ETF) that
help investors track Midcap index. The following list also includes leveraged ETF funds that track twice or thrice the daily returns of Midcap indices. Short or inverse ETF funds move in the opposite direction to the index they track and are useful during market pullbacks or during bear markets. Quick View: Move mouse or cursor over ETF symbol (ticker) to view short-term technical chart and over ETF name to view long term chart. Click on ticker or stock name for detailed view. Click on to add stock symbol to your watchlist and to view watchlist. |
12Stocks.com List of ETFs that track Midcap Index
| Ticker | ETF Name | Watchlist | Recent Price | Smart Investing & Trading Score | Change % | Week % | Year-to-date % |
| IJH | iShares Core S&P Mid-Cap | | 57.16 | 7 | 0.05 | -1.14 | 3.12% |
| MDY | SPDR S&P MidCap 400 ETF | | 523.21 | 7 | 0.09 | -1.17 | 3.12% |
| IWR | iShares Russell Mid-Cap | | 79.48 | 7 | -0.18 | -1.29 | 2.25% |
| IWP | iShares Russell Mid-Cap Growth | | 107.46 | 7 | 0.02 | -1.39 | 2.87% |
| IWS | iShares Russell Mid-Cap Value | | 118.77 | 7 | -0.08 | -1.02 | 2.13% |
| IJK | iShares S&P Mid-Cap 400 Growth | | 85.83 | 7 | -0.01 | -1.34 | 8.34% |
| IJJ | iShares S&P Mid-Cap 400 Value | | 111.28 | 22 | 0.20 | -0.85 | -2.42% |
| XMLV | PowerShares S&P MidCap Low Volatil ETF | | 54.69 | 47 | 0.46 | 0.07 | 2.84% |
| MVV | ProShares Ultra MidCap400 | | 60.02 | 17 | 0.22 | -2.3 | 3.68% |
| SMDD | ProShares UltraPro Short MidCap400 | | 12.18 | 88 | -0.25 | 2.95 | -9.54% |
| UMDD | ProShares UltraPro MidCap400 | | 23.07 | 0 | -0.82 | -3.71 | 3.36% |
| MZZ | ProShares UltraShort MidCap400 | | 11.96 | 53 | 1.18 | 2.4 | -4.86% |
| MYY | ProShares Short MidCap400 | | 20.79 | 48 | -0.57 | 0 | -3.1% |
| 12Stocks.com: Charts, Trends, Fundamental Data and Performances of MidCap Stocks | |
|
We now take in-depth look at all MidCap stocks including charts, multi-period performances and overall trends (as measured by Smart Investing & Trading Score). One can sort MidCap stocks (click link to choose) by Daily, Weekly and by Year-to-Date performances. Also, one can sort by size of the company or by market capitalization. |
| Select Your Default Chart Type: | |||||
| |||||
| Click on stock symbol or name for detailed view. Click on to add stock symbol to your watchlist and to view watchlist. Quick View: Move mouse or cursor over "Daily" to quickly view daily technical stock chart and over "Weekly" to view weekly technical stock chart. | |||||

 | SNA Snap-on Incorporated |
| Sector: Industrials | |
| SubSector: Small Tools & Accessories | |
| MarketCap: 5947.26 Millions | |
| Recent Price: 267.74 Smart Investing & Trading Score: 10 | |
| Day Percent Change: -0.08% Day Change: -0.22 | |
| Week Change: -1.09% Year-to-date Change: -7.3% | |
| SNA Links: Profile News Message Board | |
| Charts:- Daily , Weekly | |
| Add SNA to Watchlist: View: Get Complete SNA Trend Analysis ➞ | |
 | HOG Harley-Davidson, Inc. |
| Sector: Consumer Staples | |
| SubSector: Recreational Vehicles | |
| MarketCap: 2808.49 Millions | |
| Recent Price: 34.38 Smart Investing & Trading Score: 10 | |
| Day Percent Change: -0.03% Day Change: -0.01 | |
| Week Change: -1.06% Year-to-date Change: -6.7% | |
| HOG Links: Profile News Message Board | |
| Charts:- Daily , Weekly | |
| Add HOG to Watchlist: View: Get Complete HOG Trend Analysis ➞ | |
 | DHI D.R. Horton, Inc. |
| Sector: Industrials | |
| SubSector: Residential Construction | |
| MarketCap: 13372.6 Millions | |
| Recent Price: 142.48 Smart Investing & Trading Score: 10 | |
| Day Percent Change: -0.01% Day Change: -0.01 | |
| Week Change: -1.96% Year-to-date Change: -6.3% | |
| DHI Links: Profile News Message Board | |
| Charts:- Daily , Weekly | |
| Add DHI to Watchlist: View: Get Complete DHI Trend Analysis ➞ | |
 | STWD Starwood Property Trust, Inc. |
| Sector: Financials | |
| SubSector: Mortgage Investment | |
| MarketCap: 3447.09 Millions | |
| Recent Price: 19.12 Smart Investing & Trading Score: 8 | |
| Day Percent Change: 0.79% Day Change: 0.15 | |
| Week Change: -1.95% Year-to-date Change: -9.0% | |
| STWD Links: Profile News Message Board | |
| Charts:- Daily , Weekly | |
| Add STWD to Watchlist: View: Get Complete STWD Trend Analysis ➞ | |
 | IQV IQVIA Holdings Inc. |
| Sector: Health Care | |
| SubSector: Medical Laboratories & Research | |
| MarketCap: 19616.5 Millions | |
| Recent Price: 232.94 Smart Investing & Trading Score: 8 | |
| Day Percent Change: 0.50% Day Change: 1.17 | |
| Week Change: -0.83% Year-to-date Change: 0.7% | |
| IQV Links: Profile News Message Board | |
| Charts:- Daily , Weekly | |
| Add IQV to Watchlist: View: Get Complete IQV Trend Analysis ➞ | |
 | ZBH Zimmer Biomet Holdings, Inc. |
| Sector: Health Care | |
| SubSector: Medical Appliances & Equipment | |
| MarketCap: 19339.4 Millions | |
| Recent Price: 119.56 Smart Investing & Trading Score: 8 | |
| Day Percent Change: -0.60% Day Change: -0.72 | |
| Week Change: 0.18% Year-to-date Change: -1.8% | |
| ZBH Links: Profile News Message Board | |
| Charts:- Daily , Weekly | |
| Add ZBH to Watchlist: View: Get Complete ZBH Trend Analysis ➞ | |
 | MUSA Murphy USA Inc. |
| Sector: Services & Goods | |
| SubSector: Specialty Retail, Other | |
| MarketCap: 3133.14 Millions | |
| Recent Price: 411.80 Smart Investing & Trading Score: 8 | |
| Day Percent Change: -0.49% Day Change: -2.02 | |
| Week Change: -2.26% Year-to-date Change: 15.5% | |
| MUSA Links: Profile News Message Board | |
| Charts:- Daily , Weekly | |
| Add MUSA to Watchlist: View: Get Complete MUSA Trend Analysis ➞ | |
 | PNFP Pinnacle Financial Partners, Inc. |
| Sector: Financials | |
| SubSector: Regional - Southeast Banks | |
| MarketCap: 2771.75 Millions | |
| Recent Price: 78.25 Smart Investing & Trading Score: 7 | |
| Day Percent Change: 2.02% Day Change: 1.55 | |
| Week Change: -2.54% Year-to-date Change: -10.3% | |
| PNFP Links: Profile News Message Board | |
| Charts:- Daily , Weekly | |
| Add PNFP to Watchlist: View: Get Complete PNFP Trend Analysis ➞ | |
 | SOFI SoFi Technologies, Inc. |
| Sector: Financials | |
| SubSector: Credit Services | |
| MarketCap: 7990 Millions | |
| Recent Price: 6.83 Smart Investing & Trading Score: 7 | |
| Day Percent Change: 0.81% Day Change: 0.06 | |
| Week Change: -13.5% Year-to-date Change: -30.7% | |
| SOFI Links: Profile News Message Board | |
| Charts:- Daily , Weekly | |
| Add SOFI to Watchlist: View: Get Complete SOFI Trend Analysis ➞ | |
 | FFIV F5 Networks, Inc. |
| Sector: Technology | |
| SubSector: Business Software & Services | |
| MarketCap: 6675.38 Millions | |
| Recent Price: 166.62 Smart Investing & Trading Score: 7 | |
| Day Percent Change: 0.79% Day Change: 1.31 | |
| Week Change: -8.42% Year-to-date Change: -6.9% | |
| FFIV Links: Profile News Message Board | |
| Charts:- Daily , Weekly | |
| Add FFIV to Watchlist: View: Get Complete FFIV Trend Analysis ➞ | |
 | NVR NVR, Inc. |
| Sector: Industrials | |
| SubSector: Residential Construction | |
| MarketCap: 9912.56 Millions | |
| Recent Price: 7457.00 Smart Investing & Trading Score: 7 | |
| Day Percent Change: 0.24% Day Change: 18.15 | |
| Week Change: -2.49% Year-to-date Change: 6.5% | |
| NVR Links: Profile News Message Board | |
| Charts:- Daily , Weekly | |
| Add NVR to Watchlist: View: Get Complete NVR Trend Analysis ➞ | |
 | HLT Hilton Worldwide Holdings Inc. |
| Sector: Services & Goods | |
| SubSector: Lodging | |
| MarketCap: 18064.6 Millions | |
| Recent Price: 197.74 Smart Investing & Trading Score: 7 | |
| Day Percent Change: 0.23% Day Change: 0.46 | |
| Week Change: -2.17% Year-to-date Change: 8.6% | |
| HLT Links: Profile News Message Board | |
| Charts:- Daily , Weekly | |
| Add HLT to Watchlist: View: Get Complete HLT Trend Analysis ➞ | |
 | ENTG Entegris, Inc. |
| Sector: Technology | |
| SubSector: Semiconductor Equipment & Materials | |
| MarketCap: 5890.38 Millions | |
| Recent Price: 123.31 Smart Investing & Trading Score: 7 | |
| Day Percent Change: -7.23% Day Change: -9.61 | |
| Week Change: -7.01% Year-to-date Change: 2.9% | |
| ENTG Links: Profile News Message Board | |
| Charts:- Daily , Weekly | |
| Add ENTG to Watchlist: View: Get Complete ENTG Trend Analysis ➞ | |
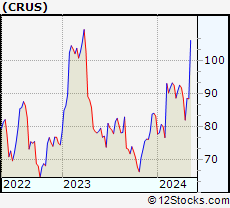 | CRUS Cirrus Logic, Inc. |
| Sector: Technology | |
| SubSector: Semiconductor - Specialized | |
| MarketCap: 3852.6 Millions | |
| Recent Price: 84.00 Smart Investing & Trading Score: 7 | |
| Day Percent Change: -5.16% Day Change: -4.57 | |
| Week Change: -5.12% Year-to-date Change: 1.0% | |
| CRUS Links: Profile News Message Board | |
| Charts:- Daily , Weekly | |
| Add CRUS to Watchlist: View: Get Complete CRUS Trend Analysis ➞ | |
 | MKSI MKS Instruments, Inc. |
| Sector: Technology | |
| SubSector: Scientific & Technical Instruments | |
| MarketCap: 4502.93 Millions | |
| Recent Price: 115.14 Smart Investing & Trading Score: 7 | |
| Day Percent Change: -3.23% Day Change: -3.84 | |
| Week Change: -4.65% Year-to-date Change: 11.9% | |
| MKSI Links: Profile News Message Board | |
| Charts:- Daily , Weekly | |
| Add MKSI to Watchlist: View: Get Complete MKSI Trend Analysis ➞ | |
 | MRVL Marvell Technology Group Ltd. |
| Sector: Technology | |
| SubSector: Semiconductor - Integrated Circuits | |
| MarketCap: 14090.4 Millions | |
| Recent Price: 63.82 Smart Investing & Trading Score: 7 | |
| Day Percent Change: -3.17% Day Change: -2.09 | |
| Week Change: -8.33% Year-to-date Change: 5.8% | |
| MRVL Links: Profile News Message Board | |
| Charts:- Daily , Weekly | |
| Add MRVL to Watchlist: View: Get Complete MRVL Trend Analysis ➞ | |
 | URI United Rentals, Inc. |
| Sector: Transports | |
| SubSector: Rental & Leasing Services | |
| MarketCap: 6246.64 Millions | |
| Recent Price: 653.76 Smart Investing & Trading Score: 7 | |
| Day Percent Change: -2.13% Day Change: -14.23 | |
| Week Change: -5.36% Year-to-date Change: 14.0% | |
| URI Links: Profile News Message Board | |
| Charts:- Daily , Weekly | |
| Add URI to Watchlist: View: Get Complete URI Trend Analysis ➞ | |
 | KEYS Keysight Technologies, Inc. |
| Sector: Technology | |
| SubSector: Scientific & Technical Instruments | |
| MarketCap: 17355.1 Millions | |
| Recent Price: 144.95 Smart Investing & Trading Score: 7 | |
| Day Percent Change: -2.02% Day Change: -2.99 | |
| Week Change: -2.42% Year-to-date Change: -8.9% | |
| KEYS Links: Profile News Message Board | |
| Charts:- Daily , Weekly | |
| Add KEYS to Watchlist: View: Get Complete KEYS Trend Analysis ➞ | |
 | NU Nu Holdings Ltd. |
| Sector: Financials | |
| SubSector: Banks - Diversified | |
| MarketCap: 37240 Millions | |
| Recent Price: 10.65 Smart Investing & Trading Score: 7 | |
| Day Percent Change: -1.89% Day Change: -0.21 | |
| Week Change: -3.57% Year-to-date Change: 27.8% | |
| NU Links: Profile News Message Board | |
| Charts:- Daily , Weekly | |
| Add NU to Watchlist: View: Get Complete NU Trend Analysis ➞ | |
 | TPR Tapestry, Inc. |
| Sector: Consumer Staples | |
| SubSector: Textile - Apparel Footwear & Accessories | |
| MarketCap: 3890.1 Millions | |
| Recent Price: 39.49 Smart Investing & Trading Score: 7 | |
| Day Percent Change: -1.08% Day Change: -0.43 | |
| Week Change: -1.4% Year-to-date Change: 7.3% | |
| TPR Links: Profile News Message Board | |
| Charts:- Daily , Weekly | |
| Add TPR to Watchlist: View: Get Complete TPR Trend Analysis ➞ | |
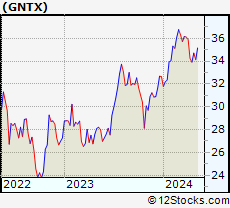 | GNTX Gentex Corporation |
| Sector: Consumer Staples | |
| SubSector: Auto Parts | |
| MarketCap: 5638.99 Millions | |
| Recent Price: 33.96 Smart Investing & Trading Score: 7 | |
| Day Percent Change: -0.99% Day Change: -0.34 | |
| Week Change: -2.16% Year-to-date Change: 4.0% | |
| GNTX Links: Profile News Message Board | |
| Charts:- Daily , Weekly | |
| Add GNTX to Watchlist: View: Get Complete GNTX Trend Analysis ➞ | |
 | AWI Armstrong World Industries, Inc. |
| Sector: Industrials | |
| SubSector: General Building Materials | |
| MarketCap: 3609.53 Millions | |
| Recent Price: 114.12 Smart Investing & Trading Score: 7 | |
| Day Percent Change: -0.66% Day Change: -0.76 | |
| Week Change: -2.44% Year-to-date Change: 16.1% | |
| AWI Links: Profile News Message Board | |
| Charts:- Daily , Weekly | |
| Add AWI to Watchlist: View: Get Complete AWI Trend Analysis ➞ | |
 | DLR Digital Realty Trust, Inc. |
| Sector: Financials | |
| SubSector: REIT - Office | |
| MarketCap: 27038.6 Millions | |
| Recent Price: 137.99 Smart Investing & Trading Score: 7 | |
| Day Percent Change: -0.57% Day Change: -0.79 | |
| Week Change: -3.39% Year-to-date Change: 2.5% | |
| DLR Links: Profile News Message Board | |
| Charts:- Daily , Weekly | |
| Add DLR to Watchlist: View: Get Complete DLR Trend Analysis ➞ | |
 | PSTG Pure Storage, Inc. |
| Sector: Technology | |
| SubSector: Data Storage Devices | |
| MarketCap: 2993.99 Millions | |
| Recent Price: 50.13 Smart Investing & Trading Score: 7 | |
| Day Percent Change: -0.54% Day Change: -0.27 | |
| Week Change: -5.33% Year-to-date Change: 40.6% | |
| PSTG Links: Profile News Message Board | |
| Charts:- Daily , Weekly | |
| Add PSTG to Watchlist: View: Get Complete PSTG Trend Analysis ➞ | |
 | HAYW Hayward Holdings, Inc. |
| Sector: Industrials | |
| SubSector: Electrical Equipment & Parts | |
| MarketCap: 2670 Millions | |
| Recent Price: 13.52 Smart Investing & Trading Score: 7 | |
| Day Percent Change: -0.44% Day Change: -0.06 | |
| Week Change: -1.82% Year-to-date Change: -0.7% | |
| HAYW Links: Profile News Message Board | |
| Charts:- Daily , Weekly | |
| Add HAYW to Watchlist: View: Get Complete HAYW Trend Analysis ➞ | |
| For tabular summary view of above stock list: Summary View ➞ 0 - 25 , 25 - 50 , 50 - 75 , 75 - 100 , 100 - 125 , 125 - 150 , 150 - 175 , 175 - 200 , 200 - 225 , 225 - 250 , 250 - 275 , 275 - 300 , 300 - 325 , 325 - 350 , 350 - 375 , 375 - 400 , 400 - 425 , 425 - 450 , 450 - 475 , 475 - 500 , 500 - 525 , 525 - 550 , 550 - 575 , 575 - 600 , 600 - 625 , 625 - 650 , 650 - 675 , 675 - 700 , 700 - 725 , 725 - 750 , 750 - 775 | ||
| Click To Change The Sort Order: By Market Cap or Company Size Performance: Year-to-date, Week and Day | |
| Select Chart Type: | ||
|
Best Stocks Today 12Stocks.com |
© 2024 12Stocks.com Terms & Conditions Privacy Contact Us
All Information Provided Only For Education And Not To Be Used For Investing or Trading. See Terms & Conditions


One More Thing ... Get Best Stocks Delivered Daily!
Never Ever Miss A Move With Our Top Ten Stocks Lists
Find Best Stocks In Any Market - Bull or Bear Market
Take A Peek At Our Top Ten Stocks Lists: Daily, Weekly, Year-to-Date & Top Trends
Find Best Stocks In Any Market - Bull or Bear Market
Take A Peek At Our Top Ten Stocks Lists: Daily, Weekly, Year-to-Date & Top Trends
Midcap Stocks With Best Up Trends [0-bearish to 100-bullish]: Pinterest [100], Garmin [100], Brookfield Renewable[100], Amcor [100], United [100], Axalta Coating[100], DuPont de[100], Clean Harbors[100], Equitable [100], Columbia Banking[100], Playtika Holding[100]
Best Midcap Stocks Year-to-Date:
Vistra Energy[99.53%], AppLovin [76.53%], ShockWave Medical[73.09%], EMCOR [64.9%], Constellation Energy[57.66%], CAVA [56.42%], Tenet [53.43%], Spotify [51.42%], Natera [50.3%], Wingstop [49.65%], Antero Resources[44%] Best Midcap Stocks This Week:
Tenet [20.62%], Pinterest [19.2%], Bio-Techne [14.67%], New York[14.48%], Garmin [13.92%], Sensata Technologies[11.46%], Brookfield Renewable[10.3%], Woodward [10.15%], Maravai LifeSciences[9.61%], Axalta Coating[9.58%], Amcor [9.25%] Best Midcap Stocks Daily:
New York[28.30%], Pinterest [21.02%], Bio-Techne [16.22%], Garmin [13.12%], Brookfield Renewable[10.63%], Amcor [9.62%], United [8.88%], Axalta Coating[8.81%], DuPont de[8.01%], Clean Harbors[6.81%], Verisk Analytics[6.81%]