
 Login Sign Up


| |||||
 |  | ||||

| 12Stocks.com Market Intelligence |
Best MidCap Stocks
|
| In a hurry? Mid Cap Stocks Lists: Performance Trends Table, Stock Charts
Sort midcap stocks: Daily, Weekly, Year-to-Date, Market Cap & Trends. Filter midcap stocks list by sector: Show all, Tech, Finance, Energy, Staples, Retail, Industrial, Materials, Utilities and HealthCare Filter midcap stocks list by size:All MidCap Large Mid-Range Small |
| 12Stocks.com Mid Cap Stocks Performances & Trends Daily | |||||||||
|
|  The overall Smart Investing & Trading Score is 7 (0-bearish to 100-bullish) which puts Mid Cap index in short term bearish trend. The Smart Investing & Trading Score from previous trading session is 38 and hence a deterioration of trend.
| ||||||||
Here are the Smart Investing & Trading Scores of the most requested mid cap stocks at 12Stocks.com (click stock name for detailed review):
|


| 12Stocks.com: Top Performing Mid Cap Index Stocks | ||||||||||||||||||||||||||||||||||||||||||||||||
 The top performing Mid Cap Index stocks year to date are
Now, more recently, over last week, the top performing Mid Cap Index stocks on the move are


|
||||||||||||||||||||||||||||||||||||||||||||||||
| 12Stocks.com: Investing in Midcap Index with Stocks | |
|
The following table helps investors and traders sort through current performance and trends (as measured by Smart Investing & Trading Score) of various
stocks in the Midcap Index. Quick View: Move mouse or cursor over stock symbol (ticker) to view short-term technical chart and over stock name to view long term chart. Click on  to add stock symbol to your watchlist and to add stock symbol to your watchlist and  to view watchlist. Click on any ticker or stock name for detailed market intelligence report for that stock. to view watchlist. Click on any ticker or stock name for detailed market intelligence report for that stock. |
12Stocks.com Performance of Stocks in Midcap Index
| Ticker | Stock Name | Watchlist | Category | Recent Price | Smart Investing & Trading Score | Change % | YTD Change% |
| CRWD | CrowdStrike |   | Technology | 295.44 | 17 | 0.99% | 15.71% |
| CFR | Cullen/Frost Bankers | | Financials | 105.29 | 17 | 0.91% | -2.95% |
| GTLB | GitLab | | Technology | 52.85 | 17 | 0.78% | -16.60% |
| NTNX | Nutanix | | Technology | 61.11 | 17 | 0.68% | 28.14% |
| TREX | Trex | | Industrials | 89.14 | 17 | 0.67% | 7.67% |
| XRAY | DENTSPLY SIRONA | | Health Care | 30.18 | 17 | 0.57% | -15.20% |
| FAST | Fastenal | | Services & Goods | 68.18 | 17 | 0.35% | 5.26% |
| DLTR | Dollar Tree | | Services & Goods | 118.56 | 17 | 0.26% | -16.54% |
| H | Hyatt Hotels | | Services & Goods | 149.01 | 17 | 0.15% | 14.26% |
| AZEK | AZEK | | Industrials | 45.70 | 17 | 0.13% | 19.48% |
| TXG | 10x Genomics | | Technology | 26.92 | 17 | -8.06% | -51.89% |
| MOS | Mosaic | | Materials | 29.93 | 17 | -4.65% | -16.23% |
| OLED | Universal Display | | Technology | 152.66 | 17 | -3.37% | -20.18% |
| GFS | GLOBALFOUNDRIES | | Technology | 47.30 | 17 | -3.23% | -21.82% |
| MPWR | Monolithic Power | | Technology | 652.59 | 17 | -2.50% | 3.46% |
| LSCC | Lattice Semiconductor | | Technology | 67.19 | 17 | -2.06% | -2.61% |
| APTV | Aptiv | | Consumer Staples | 69.75 | 17 | -1.76% | -22.26% |
| AFRM | Affirm | | Technology | 31.57 | 17 | -0.97% | -35.53% |
| FND | Floor & Decor | | Services & Goods | 109.29 | 17 | -0.94% | -2.03% |
| DAR | Darling Ingredients | | Industrials | 41.98 | 17 | -0.92% | -15.77% |
| RH | RH | | Services & Goods | 245.00 | 17 | -0.83% | -15.95% |
| CBRE | CBRE | | Financials | 86.27 | 17 | -0.71% | -7.33% |
| GXO | GXO Logistics | | Industrials | 49.42 | 17 | -0.48% | -19.28% |
| PYCR | Paycor HCM | | Technology | 17.27 | 17 | -0.46% | -20.27% |
| HST | Host Hotels | | Financials | 18.84 | 17 | -0.16% | -3.24% |
| For chart view version of above stock list: Chart View ➞ 0 - 25 , 25 - 50 , 50 - 75 , 75 - 100 , 100 - 125 , 125 - 150 , 150 - 175 , 175 - 200 , 200 - 225 , 225 - 250 , 250 - 275 , 275 - 300 , 300 - 325 , 325 - 350 , 350 - 375 , 375 - 400 , 400 - 425 , 425 - 450 , 450 - 475 , 475 - 500 , 500 - 525 , 525 - 550 , 550 - 575 , 575 - 600 , 600 - 625 , 625 - 650 , 650 - 675 , 675 - 700 , 700 - 725 , 725 - 750 , 750 - 775 | ||
 | Click To Change The Sort Order: By Market Cap or Company Size Performance: Year-to-date, Week and Day |  |
|
Get the most comprehensive stock market coverage daily at 12Stocks.com ➞ Best Stocks Today ➞ Best Stocks Weekly ➞ Best Stocks Year-to-Date ➞ Best Stocks Trends ➞  Best Stocks Today 12Stocks.com Best Nasdaq Stocks ➞ Best S&P 500 Stocks ➞ Best Tech Stocks ➞ Best Biotech Stocks ➞ |
| Detailed Overview of Midcap Stocks |
| Midcap Technical Overview, Leaders & Laggards, Top Midcap ETF Funds & Detailed Midcap Stocks List, Charts, Trends & More |
| Midcap: Technical Analysis, Trends & YTD Performance | |
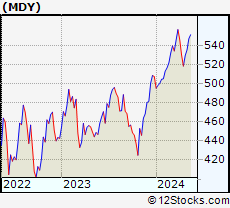
| MidCap segment as represented by
MDY, an exchange-traded fund [ETF], holds basket of about four hundred midcap stocks from across all major sectors of the US stock market. The midcap index (contains stocks like Green Mountain Coffee Roasters and Tractor Supply Company) is up by 3.12% and is currently underperforming the overall market by -1.42% year-to-date. Below is a quick view of technical charts and trends: | |
 MDY Weekly Chart |
|
| Long Term Trend: Not Good | |
| Medium Term Trend: Not Good | |
 MDY Daily Chart |
|
| Short Term Trend: Not Good | |
| Overall Trend Score: 7 | |
| YTD Performance: 3.12% | |
| **Trend Scores & Views Are Only For Educational Purposes And Not For Investing | |
| 12Stocks.com: Investing in Midcap Index using Exchange Traded Funds | |
|
The following table shows list of key exchange traded funds (ETF) that
help investors track Midcap index. The following list also includes leveraged ETF funds that track twice or thrice the daily returns of Midcap indices. Short or inverse ETF funds move in the opposite direction to the index they track and are useful during market pullbacks or during bear markets. Quick View: Move mouse or cursor over ETF symbol (ticker) to view short-term technical chart and over ETF name to view long term chart. Click on ticker or stock name for detailed view. Click on to add stock symbol to your watchlist and to view watchlist. |
12Stocks.com List of ETFs that track Midcap Index
| Ticker | ETF Name | Watchlist | Recent Price | Smart Investing & Trading Score | Change % | Week % | Year-to-date % |
| IJH | iShares Core S&P Mid-Cap | | 57.16 | 7 | 0.05 | -1.14 | 3.12% |
| MDY | SPDR S&P MidCap 400 ETF | | 523.21 | 7 | 0.09 | -1.17 | 3.12% |
| IWR | iShares Russell Mid-Cap | | 79.48 | 7 | -0.18 | -1.29 | 2.25% |
| IWP | iShares Russell Mid-Cap Growth | | 107.46 | 7 | 0.02 | -1.39 | 2.87% |
| IWS | iShares Russell Mid-Cap Value | | 118.77 | 20 | -0.08 | -1.02 | 2.13% |
| IJK | iShares S&P Mid-Cap 400 Growth | | 85.83 | 20 | -0.01 | -1.34 | 8.34% |
| IJJ | iShares S&P Mid-Cap 400 Value | | 111.28 | 22 | 0.20 | -0.85 | -2.42% |
| XMLV | PowerShares S&P MidCap Low Volatil ETF | | 54.70 | 65 | 0.48 | 0.09 | 2.86% |
| MVV | ProShares Ultra MidCap400 | | 59.96 | 7 | 0.12 | -2.39 | 3.58% |
| SMDD | ProShares UltraPro Short MidCap400 | | 12.18 | 88 | -0.21 | 2.99 | -9.5% |
| UMDD | ProShares UltraPro MidCap400 | | 23.14 | 0 | -0.50 | -3.41 | 3.69% |
| MZZ | ProShares UltraShort MidCap400 | | 11.96 | 53 | 1.18 | 2.4 | -4.86% |
| MYY | ProShares Short MidCap400 | | 21.00 | 75 | 0.45 | 1.03 | -2.1% |
| 12Stocks.com: Charts, Trends, Fundamental Data and Performances of MidCap Stocks | |
|
We now take in-depth look at all MidCap stocks including charts, multi-period performances and overall trends (as measured by Smart Investing & Trading Score). One can sort MidCap stocks (click link to choose) by Daily, Weekly and by Year-to-Date performances. Also, one can sort by size of the company or by market capitalization. |
| Select Your Default Chart Type: | |||||
| |||||
| Click on stock symbol or name for detailed view. Click on to add stock symbol to your watchlist and to view watchlist. Quick View: Move mouse or cursor over "Daily" to quickly view daily technical stock chart and over "Weekly" to view weekly technical stock chart. | |||||

 | CRWD CrowdStrike Holdings, Inc. |
| Sector: Technology | |
| SubSector: Security Software & Services | |
| MarketCap: 11803.6 Millions | |
| Recent Price: 295.44 Smart Investing & Trading Score: 17 | |
| Day Percent Change: 0.99% Day Change: 2.90 | |
| Week Change: -2.84% Year-to-date Change: 15.7% | |
| CRWD Links: Profile News Message Board | |
| Charts:- Daily , Weekly | |
| Add CRWD to Watchlist: View: Get Complete CRWD Trend Analysis ➞ | |
 | CFR Cullen/Frost Bankers, Inc. |
| Sector: Financials | |
| SubSector: Regional - Southwest Banks | |
| MarketCap: 3536.75 Millions | |
| Recent Price: 105.29 Smart Investing & Trading Score: 17 | |
| Day Percent Change: 0.91% Day Change: 0.95 | |
| Week Change: -1.67% Year-to-date Change: -3.0% | |
| CFR Links: Profile News Message Board | |
| Charts:- Daily , Weekly | |
| Add CFR to Watchlist: View: Get Complete CFR Trend Analysis ➞ | |
 | GTLB GitLab Inc. |
| Sector: Technology | |
| SubSector: Software - Application | |
| MarketCap: 7840 Millions | |
| Recent Price: 52.85 Smart Investing & Trading Score: 17 | |
| Day Percent Change: 0.78% Day Change: 0.41 | |
| Week Change: -4.71% Year-to-date Change: -16.6% | |
| GTLB Links: Profile News Message Board | |
| Charts:- Daily , Weekly | |
| Add GTLB to Watchlist: View: Get Complete GTLB Trend Analysis ➞ | |
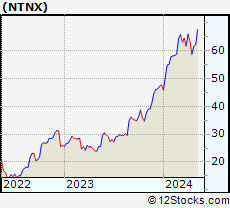 | NTNX Nutanix, Inc. |
| Sector: Technology | |
| SubSector: Technical & System Software | |
| MarketCap: 3376.6 Millions | |
| Recent Price: 61.11 Smart Investing & Trading Score: 17 | |
| Day Percent Change: 0.68% Day Change: 0.41 | |
| Week Change: -0.89% Year-to-date Change: 28.1% | |
| NTNX Links: Profile News Message Board | |
| Charts:- Daily , Weekly | |
| Add NTNX to Watchlist: View: Get Complete NTNX Trend Analysis ➞ | |
 | TREX Trex Company, Inc. |
| Sector: Industrials | |
| SubSector: General Building Materials | |
| MarketCap: 4369.23 Millions | |
| Recent Price: 89.14 Smart Investing & Trading Score: 17 | |
| Day Percent Change: 0.67% Day Change: 0.59 | |
| Week Change: -1.54% Year-to-date Change: 7.7% | |
| TREX Links: Profile News Message Board | |
| Charts:- Daily , Weekly | |
| Add TREX to Watchlist: View: Get Complete TREX Trend Analysis ➞ | |
 | XRAY DENTSPLY SIRONA Inc. |
| Sector: Health Care | |
| SubSector: Medical Instruments & Supplies | |
| MarketCap: 7746.1 Millions | |
| Recent Price: 30.18 Smart Investing & Trading Score: 17 | |
| Day Percent Change: 0.57% Day Change: 0.17 | |
| Week Change: -1.28% Year-to-date Change: -15.2% | |
| XRAY Links: Profile News Message Board | |
| Charts:- Daily , Weekly | |
| Add XRAY to Watchlist: View: Get Complete XRAY Trend Analysis ➞ | |
 | FAST Fastenal Company |
| Sector: Services & Goods | |
| SubSector: Industrial Equipment Wholesale | |
| MarketCap: 17609.9 Millions | |
| Recent Price: 68.18 Smart Investing & Trading Score: 17 | |
| Day Percent Change: 0.35% Day Change: 0.24 | |
| Week Change: 0.01% Year-to-date Change: 5.3% | |
| FAST Links: Profile News Message Board | |
| Charts:- Daily , Weekly | |
| Add FAST to Watchlist: View: Get Complete FAST Trend Analysis ➞ | |
 | DLTR Dollar Tree, Inc. |
| Sector: Services & Goods | |
| SubSector: Discount, Variety Stores | |
| MarketCap: 21383.2 Millions | |
| Recent Price: 118.56 Smart Investing & Trading Score: 17 | |
| Day Percent Change: 0.26% Day Change: 0.31 | |
| Week Change: -2.61% Year-to-date Change: -16.5% | |
| DLTR Links: Profile News Message Board | |
| Charts:- Daily , Weekly | |
| Add DLTR to Watchlist: View: Get Complete DLTR Trend Analysis ➞ | |
 | H Hyatt Hotels Corporation |
| Sector: Services & Goods | |
| SubSector: Lodging | |
| MarketCap: 5525.56 Millions | |
| Recent Price: 149.01 Smart Investing & Trading Score: 17 | |
| Day Percent Change: 0.15% Day Change: 0.22 | |
| Week Change: -1.53% Year-to-date Change: 14.3% | |
| H Links: Profile News Message Board | |
| Charts:- Daily , Weekly | |
| Add H to Watchlist: View: Get Complete H Trend Analysis ➞ | |
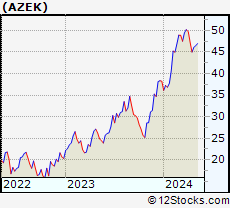 | AZEK The AZEK Company Inc. |
| Sector: Industrials | |
| SubSector: Building Products & Equipment | |
| MarketCap: 55127 Millions | |
| Recent Price: 45.70 Smart Investing & Trading Score: 17 | |
| Day Percent Change: 0.13% Day Change: 0.06 | |
| Week Change: -0.93% Year-to-date Change: 19.5% | |
| AZEK Links: Profile News Message Board | |
| Charts:- Daily , Weekly | |
| Add AZEK to Watchlist: View: Get Complete AZEK Trend Analysis ➞ | |
 | TXG 10x Genomics, Inc. |
| Sector: Technology | |
| SubSector: Healthcare Information Services | |
| MarketCap: 5490.45 Millions | |
| Recent Price: 26.92 Smart Investing & Trading Score: 17 | |
| Day Percent Change: -8.06% Day Change: -2.36 | |
| Week Change: -2.43% Year-to-date Change: -51.9% | |
| TXG Links: Profile News Message Board | |
| Charts:- Daily , Weekly | |
| Add TXG to Watchlist: View: Get Complete TXG Trend Analysis ➞ | |
 | MOS The Mosaic Company |
| Sector: Materials | |
| SubSector: Agricultural Chemicals | |
| MarketCap: 4299.59 Millions | |
| Recent Price: 29.93 Smart Investing & Trading Score: 17 | |
| Day Percent Change: -4.65% Day Change: -1.46 | |
| Week Change: -1.06% Year-to-date Change: -16.2% | |
| MOS Links: Profile News Message Board | |
| Charts:- Daily , Weekly | |
| Add MOS to Watchlist: View: Get Complete MOS Trend Analysis ➞ | |
 | OLED Universal Display Corporation |
| Sector: Technology | |
| SubSector: Semiconductor Equipment & Materials | |
| MarketCap: 5660.08 Millions | |
| Recent Price: 152.66 Smart Investing & Trading Score: 17 | |
| Day Percent Change: -3.37% Day Change: -5.32 | |
| Week Change: -3.57% Year-to-date Change: -20.2% | |
| OLED Links: Profile News Message Board | |
| Charts:- Daily , Weekly | |
| Add OLED to Watchlist: View: Get Complete OLED Trend Analysis ➞ | |
 | GFS GLOBALFOUNDRIES Inc. |
| Sector: Technology | |
| SubSector: Semiconductors | |
| MarketCap: 35570 Millions | |
| Recent Price: 47.30 Smart Investing & Trading Score: 17 | |
| Day Percent Change: -3.23% Day Change: -1.58 | |
| Week Change: -2.27% Year-to-date Change: -21.8% | |
| GFS Links: Profile News Message Board | |
| Charts:- Daily , Weekly | |
| Add GFS to Watchlist: View: Get Complete GFS Trend Analysis ➞ | |
 | MPWR Monolithic Power Systems, Inc. |
| Sector: Technology | |
| SubSector: Semiconductor - Specialized | |
| MarketCap: 6436.4 Millions | |
| Recent Price: 652.59 Smart Investing & Trading Score: 17 | |
| Day Percent Change: -2.50% Day Change: -16.74 | |
| Week Change: -3.64% Year-to-date Change: 3.5% | |
| MPWR Links: Profile News Message Board | |
| Charts:- Daily , Weekly | |
| Add MPWR to Watchlist: View: Get Complete MPWR Trend Analysis ➞ | |
 | LSCC Lattice Semiconductor Corporation |
| Sector: Technology | |
| SubSector: Semiconductor - Specialized | |
| MarketCap: 2104 Millions | |
| Recent Price: 67.19 Smart Investing & Trading Score: 17 | |
| Day Percent Change: -2.06% Day Change: -1.41 | |
| Week Change: -9.06% Year-to-date Change: -2.6% | |
| LSCC Links: Profile News Message Board | |
| Charts:- Daily , Weekly | |
| Add LSCC to Watchlist: View: Get Complete LSCC Trend Analysis ➞ | |
 | APTV Aptiv PLC |
| Sector: Consumer Staples | |
| SubSector: Auto Parts | |
| MarketCap: 13047.9 Millions | |
| Recent Price: 69.75 Smart Investing & Trading Score: 17 | |
| Day Percent Change: -1.76% Day Change: -1.25 | |
| Week Change: -2.05% Year-to-date Change: -22.3% | |
| APTV Links: Profile News Message Board | |
| Charts:- Daily , Weekly | |
| Add APTV to Watchlist: View: Get Complete APTV Trend Analysis ➞ | |
 | AFRM Affirm Holdings, Inc. |
| Sector: Technology | |
| SubSector: Software - Infrastructure | |
| MarketCap: 4560 Millions | |
| Recent Price: 31.57 Smart Investing & Trading Score: 17 | |
| Day Percent Change: -0.97% Day Change: -0.31 | |
| Week Change: -5.32% Year-to-date Change: -35.5% | |
| AFRM Links: Profile News Message Board | |
| Charts:- Daily , Weekly | |
| Add AFRM to Watchlist: View: Get Complete AFRM Trend Analysis ➞ | |
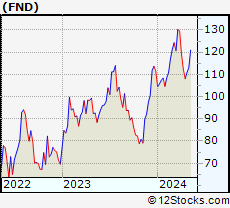 | FND Floor & Decor Holdings, Inc. |
| Sector: Services & Goods | |
| SubSector: Home Improvement Stores | |
| MarketCap: 3327.52 Millions | |
| Recent Price: 109.29 Smart Investing & Trading Score: 17 | |
| Day Percent Change: -0.94% Day Change: -1.04 | |
| Week Change: -1.48% Year-to-date Change: -2.0% | |
| FND Links: Profile News Message Board | |
| Charts:- Daily , Weekly | |
| Add FND to Watchlist: View: Get Complete FND Trend Analysis ➞ | |
 | DAR Darling Ingredients Inc. |
| Sector: Industrials | |
| SubSector: Waste Management | |
| MarketCap: 3075.28 Millions | |
| Recent Price: 41.98 Smart Investing & Trading Score: 17 | |
| Day Percent Change: -0.92% Day Change: -0.39 | |
| Week Change: -6.02% Year-to-date Change: -15.8% | |
| DAR Links: Profile News Message Board | |
| Charts:- Daily , Weekly | |
| Add DAR to Watchlist: View: Get Complete DAR Trend Analysis ➞ | |
 | RH RH |
| Sector: Services & Goods | |
| SubSector: Home Furnishing Stores | |
| MarketCap: 1828.25 Millions | |
| Recent Price: 245.00 Smart Investing & Trading Score: 17 | |
| Day Percent Change: -0.83% Day Change: -2.05 | |
| Week Change: -1.57% Year-to-date Change: -16.0% | |
| RH Links: Profile News Message Board | |
| Charts:- Daily , Weekly | |
| Add RH to Watchlist: View: Get Complete RH Trend Analysis ➞ | |
 | CBRE CBRE Group, Inc. |
| Sector: Financials | |
| SubSector: Property Management | |
| MarketCap: 12799.2 Millions | |
| Recent Price: 86.27 Smart Investing & Trading Score: 17 | |
| Day Percent Change: -0.71% Day Change: -0.62 | |
| Week Change: -1.21% Year-to-date Change: -7.3% | |
| CBRE Links: Profile News Message Board | |
| Charts:- Daily , Weekly | |
| Add CBRE to Watchlist: View: Get Complete CBRE Trend Analysis ➞ | |
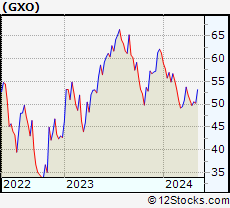 | GXO GXO Logistics, Inc. |
| Sector: Industrials | |
| SubSector: Integrated Freight & Logistics | |
| MarketCap: 7340 Millions | |
| Recent Price: 49.42 Smart Investing & Trading Score: 17 | |
| Day Percent Change: -0.48% Day Change: -0.24 | |
| Week Change: -2.16% Year-to-date Change: -19.3% | |
| GXO Links: Profile News Message Board | |
| Charts:- Daily , Weekly | |
| Add GXO to Watchlist: View: Get Complete GXO Trend Analysis ➞ | |
 | PYCR Paycor HCM, Inc. |
| Sector: Technology | |
| SubSector: Software - Application | |
| MarketCap: 4220 Millions | |
| Recent Price: 17.27 Smart Investing & Trading Score: 17 | |
| Day Percent Change: -0.46% Day Change: -0.08 | |
| Week Change: -3.41% Year-to-date Change: -20.3% | |
| PYCR Links: Profile News Message Board | |
| Charts:- Daily , Weekly | |
| Add PYCR to Watchlist: View: Get Complete PYCR Trend Analysis ➞ | |
 | HST Host Hotels & Resorts, Inc. |
| Sector: Financials | |
| SubSector: REIT - Hotel/Motel | |
| MarketCap: 8253.74 Millions | |
| Recent Price: 18.84 Smart Investing & Trading Score: 17 | |
| Day Percent Change: -0.16% Day Change: -0.03 | |
| Week Change: -0.11% Year-to-date Change: -3.2% | |
| HST Links: Profile News Message Board | |
| Charts:- Daily , Weekly | |
| Add HST to Watchlist: View: Get Complete HST Trend Analysis ➞ | |
| For tabular summary view of above stock list: Summary View ➞ 0 - 25 , 25 - 50 , 50 - 75 , 75 - 100 , 100 - 125 , 125 - 150 , 150 - 175 , 175 - 200 , 200 - 225 , 225 - 250 , 250 - 275 , 275 - 300 , 300 - 325 , 325 - 350 , 350 - 375 , 375 - 400 , 400 - 425 , 425 - 450 , 450 - 475 , 475 - 500 , 500 - 525 , 525 - 550 , 550 - 575 , 575 - 600 , 600 - 625 , 625 - 650 , 650 - 675 , 675 - 700 , 700 - 725 , 725 - 750 , 750 - 775 | ||
| Click To Change The Sort Order: By Market Cap or Company Size Performance: Year-to-date, Week and Day | |
| Select Chart Type: | ||
|
Best Stocks Today 12Stocks.com |
© 2024 12Stocks.com Terms & Conditions Privacy Contact Us
All Information Provided Only For Education And Not To Be Used For Investing or Trading. See Terms & Conditions


One More Thing ... Get Best Stocks Delivered Daily!
Never Ever Miss A Move With Our Top Ten Stocks Lists
Find Best Stocks In Any Market - Bull or Bear Market
Take A Peek At Our Top Ten Stocks Lists: Daily, Weekly, Year-to-Date & Top Trends
Find Best Stocks In Any Market - Bull or Bear Market
Take A Peek At Our Top Ten Stocks Lists: Daily, Weekly, Year-to-Date & Top Trends
Midcap Stocks With Best Up Trends [0-bearish to 100-bullish]: Pinterest [100], Garmin [100], Brookfield Renewable[100], Amcor [100], United [100], Axalta Coating[100], DuPont de[100], Clean Harbors[100], Equitable [100], Columbia Banking[100], Playtika Holding[100]
Best Midcap Stocks Year-to-Date:
Vistra Energy[99.53%], AppLovin [76.53%], ShockWave Medical[73.09%], EMCOR [64.9%], Constellation Energy[57.66%], CAVA [56.42%], Tenet [53.43%], Spotify [51.42%], Natera [50.3%], Wingstop [49.65%], Antero Resources[44%] Best Midcap Stocks This Week:
Tenet [20.62%], Pinterest [19.2%], Bio-Techne [14.67%], New York[14.48%], Garmin [13.92%], Sensata Technologies[11.46%], Brookfield Renewable[10.3%], Woodward [10.15%], Axalta Coating[9.58%], Maravai LifeSciences[9.35%], Amcor [9.25%] Best Midcap Stocks Daily:
New York[28.30%], Pinterest [21.02%], Bio-Techne [16.22%], Garmin [13.12%], Brookfield Renewable[10.63%], Amcor [9.62%], United [8.88%], Axalta Coating[8.81%], DuPont de[8.01%], Clean Harbors[6.81%], Verisk Analytics[6.81%]