
 Login Sign Up


| |||||
 |  | ||||

| 12Stocks.com Market Intelligence |
Best MidCap Stocks
|
| In a hurry? Mid Cap Stocks Lists: Performance Trends Table, Stock Charts
Sort midcap stocks: Daily, Weekly, Year-to-Date, Market Cap & Trends. Filter midcap stocks list by sector: Show all, Tech, Finance, Energy, Staples, Retail, Industrial, Materials, Utilities and HealthCare Filter midcap stocks list by size:All MidCap Large Mid-Range Small |
| 12Stocks.com Mid Cap Stocks Performances & Trends Daily | |||||||||
|
|  The overall Smart Investing & Trading Score is 7 (0-bearish to 100-bullish) which puts Mid Cap index in short term bearish trend. The Smart Investing & Trading Score from previous trading session is 38 and hence a deterioration of trend.
| ||||||||
Here are the Smart Investing & Trading Scores of the most requested mid cap stocks at 12Stocks.com (click stock name for detailed review):
|


| 12Stocks.com: Top Performing Mid Cap Index Stocks | ||||||||||||||||||||||||||||||||||||||||||||||||
 The top performing Mid Cap Index stocks year to date are
Now, more recently, over last week, the top performing Mid Cap Index stocks on the move are


|
||||||||||||||||||||||||||||||||||||||||||||||||
| 12Stocks.com: Investing in Midcap Index with Stocks | |
|
The following table helps investors and traders sort through current performance and trends (as measured by Smart Investing & Trading Score) of various
stocks in the Midcap Index. Quick View: Move mouse or cursor over stock symbol (ticker) to view short-term technical chart and over stock name to view long term chart. Click on  to add stock symbol to your watchlist and to add stock symbol to your watchlist and  to view watchlist. Click on any ticker or stock name for detailed market intelligence report for that stock. to view watchlist. Click on any ticker or stock name for detailed market intelligence report for that stock. |
12Stocks.com Performance of Stocks in Midcap Index
| Ticker | Stock Name | Watchlist | Category | Recent Price | Smart Investing & Trading Score | Change % | YTD Change% |
| PEN | Penumbra |   | Health Care | 205.29 | 35 | 4.49% | -18.39% |
| COLD | Americold Realty | | Financials | 22.35 | 35 | 1.73% | -26.16% |
| BIO | Bio-Rad | | Health Care | 274.06 | 35 | 1.60% | -15.12% |
| GMED | Globus Medical | | Health Care | 50.43 | 35 | 1.29% | -5.37% |
| LOPE | Grand Canyon | | Services & Goods | 130.96 | 35 | 0.72% | -0.82% |
| FDS | FactSet Research | | Technology | 419.57 | 35 | 0.64% | -12.05% |
| ODFL | Old Dominion | | Transports | 182.49 | 35 | 0.43% | -54.98% |
| RHI | Robert Half | | Services & Goods | 69.25 | 35 | 0.16% | -21.24% |
| LPLA | LPL Financial | | Financials | 265.49 | 35 | -1.35% | 16.64% |
| FYBR | Frontier | | Services & Goods | 23.06 | 35 | -0.45% | -8.62% |
| SCI | Service | | Services & Goods | 71.40 | 35 | -0.43% | 4.31% |
| BAX | Baxter | | Health Care | 40.34 | 35 | -0.07% | 4.35% |
| G | Genpact | | Technology | 30.72 | 35 | -0.07% | -11.50% |
| CELH | Celsius | | Consumer Staples | 72.34 | 34 | 1.50% | 32.69% |
| AMH | American Homes | | Financials | 35.93 | 34 | 0.36% | -0.08% |
| TTWO | Take-Two Interactive | | Technology | 142.74 | 34 | -0.05% | -11.31% |
| WMB | Williams | | Energy | 37.89 | 34 | -1.23% | 8.79% |
| DXCM | DexCom | | Health Care | 125.88 | 34 | -1.19% | 1.44% |
| CPRT | Copart | | Services & Goods | 54.44 | 33 | 0.24% | 11.10% |
| HOOD | Robinhood Markets | | Technology | 16.52 | 33 | 0.24% | 30.28% |
| CHK | Chesapeake Energy | | Energy | 86.68 | 33 | -3.56% | 12.66% |
| GPS | Gap | | Services & Goods | 19.83 | 33 | -3.36% | -5.16% |
| FTI | TechnipFMC | | Energy | 25.36 | 33 | -1.01% | 25.92% |
| CROX | Crocs | | Consumer Staples | 123.55 | 33 | -0.66% | 32.27% |
| PH | Parker-Hannifin | | Industrials | 542.96 | 33 | -0.36% | 17.86% |
| For chart view version of above stock list: Chart View ➞ 0 - 25 , 25 - 50 , 50 - 75 , 75 - 100 , 100 - 125 , 125 - 150 , 150 - 175 , 175 - 200 , 200 - 225 , 225 - 250 , 250 - 275 , 275 - 300 , 300 - 325 , 325 - 350 , 350 - 375 , 375 - 400 , 400 - 425 , 425 - 450 , 450 - 475 , 475 - 500 , 500 - 525 , 525 - 550 , 550 - 575 , 575 - 600 , 600 - 625 , 625 - 650 , 650 - 675 , 675 - 700 , 700 - 725 , 725 - 750 , 750 - 775 | ||
 | Click To Change The Sort Order: By Market Cap or Company Size Performance: Year-to-date, Week and Day |  |
|
Get the most comprehensive stock market coverage daily at 12Stocks.com ➞ Best Stocks Today ➞ Best Stocks Weekly ➞ Best Stocks Year-to-Date ➞ Best Stocks Trends ➞  Best Stocks Today 12Stocks.com Best Nasdaq Stocks ➞ Best S&P 500 Stocks ➞ Best Tech Stocks ➞ Best Biotech Stocks ➞ |
| Detailed Overview of Midcap Stocks |
| Midcap Technical Overview, Leaders & Laggards, Top Midcap ETF Funds & Detailed Midcap Stocks List, Charts, Trends & More |
| Midcap: Technical Analysis, Trends & YTD Performance | |
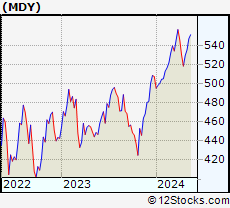
| MidCap segment as represented by
MDY, an exchange-traded fund [ETF], holds basket of about four hundred midcap stocks from across all major sectors of the US stock market. The midcap index (contains stocks like Green Mountain Coffee Roasters and Tractor Supply Company) is up by 3.12% and is currently underperforming the overall market by -1.42% year-to-date. Below is a quick view of technical charts and trends: | |
 MDY Weekly Chart |
|
| Long Term Trend: Not Good | |
| Medium Term Trend: Not Good | |
 MDY Daily Chart |
|
| Short Term Trend: Not Good | |
| Overall Trend Score: 7 | |
| YTD Performance: 3.12% | |
| **Trend Scores & Views Are Only For Educational Purposes And Not For Investing | |
| 12Stocks.com: Investing in Midcap Index using Exchange Traded Funds | |
|
The following table shows list of key exchange traded funds (ETF) that
help investors track Midcap index. The following list also includes leveraged ETF funds that track twice or thrice the daily returns of Midcap indices. Short or inverse ETF funds move in the opposite direction to the index they track and are useful during market pullbacks or during bear markets. Quick View: Move mouse or cursor over ETF symbol (ticker) to view short-term technical chart and over ETF name to view long term chart. Click on ticker or stock name for detailed view. Click on to add stock symbol to your watchlist and to view watchlist. |
12Stocks.com List of ETFs that track Midcap Index
| Ticker | ETF Name | Watchlist | Recent Price | Smart Investing & Trading Score | Change % | Week % | Year-to-date % |
| IJH | iShares Core S&P Mid-Cap | | 57.16 | 7 | 0.05 | -1.14 | 3.12% |
| MDY | SPDR S&P MidCap 400 ETF | | 523.21 | 7 | 0.09 | -1.17 | 3.12% |
| IWR | iShares Russell Mid-Cap | | 79.48 | 7 | -0.18 | -1.29 | 2.25% |
| IWP | iShares Russell Mid-Cap Growth | | 107.46 | 7 | 0.02 | -1.39 | 2.87% |
| IWS | iShares Russell Mid-Cap Value | | 118.77 | 7 | -0.08 | -1.02 | 2.13% |
| IJK | iShares S&P Mid-Cap 400 Growth | | 85.83 | 7 | -0.01 | -1.34 | 8.34% |
| IJJ | iShares S&P Mid-Cap 400 Value | | 111.28 | 22 | 0.20 | -0.85 | -2.42% |
| XMLV | PowerShares S&P MidCap Low Volatil ETF | | 54.70 | 47 | 0.48 | 0.09 | 2.86% |
| MVV | ProShares Ultra MidCap400 | | 59.96 | 17 | 0.12 | -2.39 | 3.58% |
| SMDD | ProShares UltraPro Short MidCap400 | | 12.18 | 88 | -0.21 | 2.99 | -9.5% |
| UMDD | ProShares UltraPro MidCap400 | | 23.14 | 0 | -0.50 | -3.41 | 3.69% |
| MZZ | ProShares UltraShort MidCap400 | | 11.96 | 53 | 1.18 | 2.4 | -4.86% |
| MYY | ProShares Short MidCap400 | | 21.00 | 48 | 0.45 | 1.03 | -2.1% |
| 12Stocks.com: Charts, Trends, Fundamental Data and Performances of MidCap Stocks | |
|
We now take in-depth look at all MidCap stocks including charts, multi-period performances and overall trends (as measured by Smart Investing & Trading Score). One can sort MidCap stocks (click link to choose) by Daily, Weekly and by Year-to-Date performances. Also, one can sort by size of the company or by market capitalization. |
| Select Your Default Chart Type: | |||||
| |||||
| Click on stock symbol or name for detailed view. Click on to add stock symbol to your watchlist and to view watchlist. Quick View: Move mouse or cursor over "Daily" to quickly view daily technical stock chart and over "Weekly" to view weekly technical stock chart. | |||||

 | PEN Penumbra, Inc. |
| Sector: Health Care | |
| SubSector: Medical Instruments & Supplies | |
| MarketCap: 4854.1 Millions | |
| Recent Price: 205.29 Smart Investing & Trading Score: 35 | |
| Day Percent Change: 4.49% Day Change: 8.82 | |
| Week Change: 0.43% Year-to-date Change: -18.4% | |
| PEN Links: Profile News Message Board | |
| Charts:- Daily , Weekly | |
| Add PEN to Watchlist: View: Get Complete PEN Trend Analysis ➞ | |
 | COLD Americold Realty Trust |
| Sector: Financials | |
| SubSector: REIT - Industrial | |
| MarketCap: 6569.69 Millions | |
| Recent Price: 22.35 Smart Investing & Trading Score: 35 | |
| Day Percent Change: 1.73% Day Change: 0.38 | |
| Week Change: 0.49% Year-to-date Change: -26.2% | |
| COLD Links: Profile News Message Board | |
| Charts:- Daily , Weekly | |
| Add COLD to Watchlist: View: Get Complete COLD Trend Analysis ➞ | |
 | BIO Bio-Rad Laboratories, Inc. |
| Sector: Health Care | |
| SubSector: Medical Laboratories & Research | |
| MarketCap: 10660 Millions | |
| Recent Price: 274.06 Smart Investing & Trading Score: 35 | |
| Day Percent Change: 1.60% Day Change: 4.31 | |
| Week Change: -0.68% Year-to-date Change: -15.1% | |
| BIO Links: Profile News Message Board | |
| Charts:- Daily , Weekly | |
| Add BIO to Watchlist: View: Get Complete BIO Trend Analysis ➞ | |
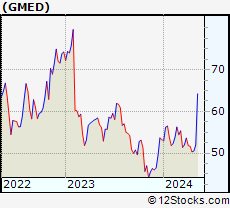 | GMED Globus Medical, Inc. |
| Sector: Health Care | |
| SubSector: Medical Appliances & Equipment | |
| MarketCap: 3965.5 Millions | |
| Recent Price: 50.43 Smart Investing & Trading Score: 35 | |
| Day Percent Change: 1.29% Day Change: 0.64 | |
| Week Change: -0.24% Year-to-date Change: -5.4% | |
| GMED Links: Profile News Message Board | |
| Charts:- Daily , Weekly | |
| Add GMED to Watchlist: View: Get Complete GMED Trend Analysis ➞ | |
 | LOPE Grand Canyon Education, Inc. |
| Sector: Services & Goods | |
| SubSector: Education & Training Services | |
| MarketCap: 3073.56 Millions | |
| Recent Price: 130.96 Smart Investing & Trading Score: 35 | |
| Day Percent Change: 0.72% Day Change: 0.94 | |
| Week Change: -0.77% Year-to-date Change: -0.8% | |
| LOPE Links: Profile News Message Board | |
| Charts:- Daily , Weekly | |
| Add LOPE to Watchlist: View: Get Complete LOPE Trend Analysis ➞ | |
 | FDS FactSet Research Systems Inc. |
| Sector: Technology | |
| SubSector: Information & Delivery Services | |
| MarketCap: 9024.37 Millions | |
| Recent Price: 419.57 Smart Investing & Trading Score: 35 | |
| Day Percent Change: 0.64% Day Change: 2.68 | |
| Week Change: -0.45% Year-to-date Change: -12.1% | |
| FDS Links: Profile News Message Board | |
| Charts:- Daily , Weekly | |
| Add FDS to Watchlist: View: Get Complete FDS Trend Analysis ➞ | |
 | ODFL Old Dominion Freight Line, Inc. |
| Sector: Transports | |
| SubSector: Trucking | |
| MarketCap: 14457.5 Millions | |
| Recent Price: 182.49 Smart Investing & Trading Score: 35 | |
| Day Percent Change: 0.43% Day Change: 0.78 | |
| Week Change: 0.04% Year-to-date Change: -55.0% | |
| ODFL Links: Profile News Message Board | |
| Charts:- Daily , Weekly | |
| Add ODFL to Watchlist: View: Get Complete ODFL Trend Analysis ➞ | |
 | RHI Robert Half International Inc. |
| Sector: Services & Goods | |
| SubSector: Staffing & Outsourcing Services | |
| MarketCap: 4302 Millions | |
| Recent Price: 69.25 Smart Investing & Trading Score: 35 | |
| Day Percent Change: 0.16% Day Change: 0.11 | |
| Week Change: -0.14% Year-to-date Change: -21.2% | |
| RHI Links: Profile News Message Board | |
| Charts:- Daily , Weekly | |
| Add RHI to Watchlist: View: Get Complete RHI Trend Analysis ➞ | |
 | LPLA LPL Financial Holdings Inc. |
| Sector: Financials | |
| SubSector: Investment Brokerage - National | |
| MarketCap: 4104.65 Millions | |
| Recent Price: 265.49 Smart Investing & Trading Score: 35 | |
| Day Percent Change: -1.35% Day Change: -3.64 | |
| Week Change: -0.31% Year-to-date Change: 16.6% | |
| LPLA Links: Profile News Message Board | |
| Charts:- Daily , Weekly | |
| Add LPLA to Watchlist: View: Get Complete LPLA Trend Analysis ➞ | |
 | FYBR Frontier Communications Parent, Inc. |
| Sector: Services & Goods | |
| SubSector: Telecom Services | |
| MarketCap: 4460 Millions | |
| Recent Price: 23.06 Smart Investing & Trading Score: 35 | |
| Day Percent Change: -0.45% Day Change: -0.11 | |
| Week Change: 0.44% Year-to-date Change: -8.6% | |
| FYBR Links: Profile News Message Board | |
| Charts:- Daily , Weekly | |
| Add FYBR to Watchlist: View: Get Complete FYBR Trend Analysis ➞ | |
 | SCI Service Corporation International |
| Sector: Services & Goods | |
| SubSector: Personal Services | |
| MarketCap: 7216.05 Millions | |
| Recent Price: 71.40 Smart Investing & Trading Score: 35 | |
| Day Percent Change: -0.43% Day Change: -0.31 | |
| Week Change: -0.47% Year-to-date Change: 4.3% | |
| SCI Links: Profile News Message Board | |
| Charts:- Daily , Weekly | |
| Add SCI to Watchlist: View: Get Complete SCI Trend Analysis ➞ | |
 | BAX Baxter International Inc. |
| Sector: Health Care | |
| SubSector: Medical Instruments & Supplies | |
| MarketCap: 39955.8 Millions | |
| Recent Price: 40.34 Smart Investing & Trading Score: 35 | |
| Day Percent Change: -0.07% Day Change: -0.03 | |
| Week Change: 0.52% Year-to-date Change: 4.4% | |
| BAX Links: Profile News Message Board | |
| Charts:- Daily , Weekly | |
| Add BAX to Watchlist: View: Get Complete BAX Trend Analysis ➞ | |
 | G Genpact Limited |
| Sector: Technology | |
| SubSector: Information Technology Services | |
| MarketCap: 5485.78 Millions | |
| Recent Price: 30.72 Smart Investing & Trading Score: 35 | |
| Day Percent Change: -0.07% Day Change: -0.02 | |
| Week Change: -0.58% Year-to-date Change: -11.5% | |
| G Links: Profile News Message Board | |
| Charts:- Daily , Weekly | |
| Add G to Watchlist: View: Get Complete G Trend Analysis ➞ | |
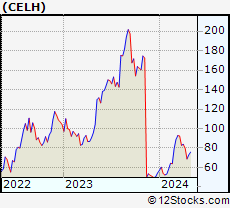 | CELH Celsius Holdings, Inc. |
| Sector: Consumer Staples | |
| SubSector: Beverages - Soft Drinks | |
| MarketCap: 280.32 Millions | |
| Recent Price: 72.34 Smart Investing & Trading Score: 34 | |
| Day Percent Change: 1.50% Day Change: 1.07 | |
| Week Change: -1.12% Year-to-date Change: 32.7% | |
| CELH Links: Profile News Message Board | |
| Charts:- Daily , Weekly | |
| Add CELH to Watchlist: View: Get Complete CELH Trend Analysis ➞ | |
 | AMH American Homes 4 Rent |
| Sector: Financials | |
| SubSector: REIT - Residential | |
| MarketCap: 6135.31 Millions | |
| Recent Price: 35.93 Smart Investing & Trading Score: 34 | |
| Day Percent Change: 0.36% Day Change: 0.13 | |
| Week Change: -1.32% Year-to-date Change: -0.1% | |
| AMH Links: Profile News Message Board | |
| Charts:- Daily , Weekly | |
| Add AMH to Watchlist: View: Get Complete AMH Trend Analysis ➞ | |
 | TTWO Take-Two Interactive Software, Inc. |
| Sector: Technology | |
| SubSector: Multimedia & Graphics Software | |
| MarketCap: 12479.6 Millions | |
| Recent Price: 142.74 Smart Investing & Trading Score: 34 | |
| Day Percent Change: -0.05% Day Change: -0.07 | |
| Week Change: -1.2% Year-to-date Change: -11.3% | |
| TTWO Links: Profile News Message Board | |
| Charts:- Daily , Weekly | |
| Add TTWO to Watchlist: View: Get Complete TTWO Trend Analysis ➞ | |
 | WMB The Williams Companies, Inc. |
| Sector: Energy | |
| SubSector: Oil & Gas Pipelines | |
| MarketCap: 16851.5 Millions | |
| Recent Price: 37.89 Smart Investing & Trading Score: 34 | |
| Day Percent Change: -1.23% Day Change: -0.47 | |
| Week Change: -3.49% Year-to-date Change: 8.8% | |
| WMB Links: Profile News Message Board | |
| Charts:- Daily , Weekly | |
| Add WMB to Watchlist: View: Get Complete WMB Trend Analysis ➞ | |
 | DXCM DexCom, Inc. |
| Sector: Health Care | |
| SubSector: Medical Laboratories & Research | |
| MarketCap: 19559 Millions | |
| Recent Price: 125.88 Smart Investing & Trading Score: 34 | |
| Day Percent Change: -1.19% Day Change: -1.51 | |
| Week Change: 1.24% Year-to-date Change: 1.4% | |
| DXCM Links: Profile News Message Board | |
| Charts:- Daily , Weekly | |
| Add DXCM to Watchlist: View: Get Complete DXCM Trend Analysis ➞ | |
 | CPRT Copart, Inc. |
| Sector: Services & Goods | |
| SubSector: Auto Dealerships | |
| MarketCap: 15462.1 Millions | |
| Recent Price: 54.44 Smart Investing & Trading Score: 33 | |
| Day Percent Change: 0.24% Day Change: 0.13 | |
| Week Change: -2.31% Year-to-date Change: 11.1% | |
| CPRT Links: Profile News Message Board | |
| Charts:- Daily , Weekly | |
| Add CPRT to Watchlist: View: Get Complete CPRT Trend Analysis ➞ | |
 | HOOD Robinhood Markets, Inc. |
| Sector: Technology | |
| SubSector: Software - Infrastructure | |
| MarketCap: 9200 Millions | |
| Recent Price: 16.52 Smart Investing & Trading Score: 33 | |
| Day Percent Change: 0.24% Day Change: 0.04 | |
| Week Change: -7.66% Year-to-date Change: 30.3% | |
| HOOD Links: Profile News Message Board | |
| Charts:- Daily , Weekly | |
| Add HOOD to Watchlist: View: Get Complete HOOD Trend Analysis ➞ | |
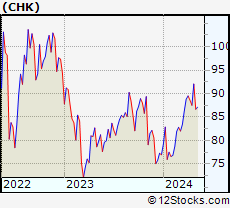 | CHK Chesapeake Energy Corporation |
| Sector: Energy | |
| SubSector: Oil & Gas E&P | |
| MarketCap: 10840 Millions | |
| Recent Price: 86.68 Smart Investing & Trading Score: 33 | |
| Day Percent Change: -3.56% Day Change: -3.20 | |
| Week Change: -5.84% Year-to-date Change: 12.7% | |
| CHK Links: Profile News Message Board | |
| Charts:- Daily , Weekly | |
| Add CHK to Watchlist: View: Get Complete CHK Trend Analysis ➞ | |
 | GPS The Gap, Inc. |
| Sector: Services & Goods | |
| SubSector: Apparel Stores | |
| MarketCap: 2936.08 Millions | |
| Recent Price: 19.83 Smart Investing & Trading Score: 33 | |
| Day Percent Change: -3.36% Day Change: -0.69 | |
| Week Change: -7.12% Year-to-date Change: -5.2% | |
| GPS Links: Profile News Message Board | |
| Charts:- Daily , Weekly | |
| Add GPS to Watchlist: View: Get Complete GPS Trend Analysis ➞ | |
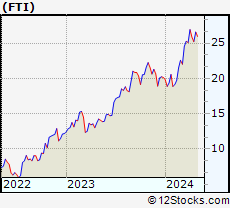 | FTI TechnipFMC plc |
| Sector: Energy | |
| SubSector: Oil & Gas Equipment & Services | |
| MarketCap: 3406.71 Millions | |
| Recent Price: 25.36 Smart Investing & Trading Score: 33 | |
| Day Percent Change: -1.01% Day Change: -0.26 | |
| Week Change: -4.63% Year-to-date Change: 25.9% | |
| FTI Links: Profile News Message Board | |
| Charts:- Daily , Weekly | |
| Add FTI to Watchlist: View: Get Complete FTI Trend Analysis ➞ | |
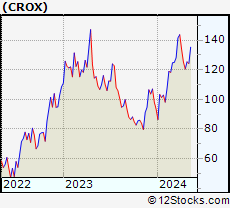 | CROX Crocs, Inc. |
| Sector: Consumer Staples | |
| SubSector: Textile - Apparel Footwear & Accessories | |
| MarketCap: 823.47 Millions | |
| Recent Price: 123.55 Smart Investing & Trading Score: 33 | |
| Day Percent Change: -0.66% Day Change: -0.82 | |
| Week Change: -1.48% Year-to-date Change: 32.3% | |
| CROX Links: Profile News Message Board | |
| Charts:- Daily , Weekly | |
| Add CROX to Watchlist: View: Get Complete CROX Trend Analysis ➞ | |
 | PH Parker-Hannifin Corporation |
| Sector: Industrials | |
| SubSector: Industrial Equipment & Components | |
| MarketCap: 14888.9 Millions | |
| Recent Price: 542.96 Smart Investing & Trading Score: 33 | |
| Day Percent Change: -0.36% Day Change: -1.95 | |
| Week Change: -1.93% Year-to-date Change: 17.9% | |
| PH Links: Profile News Message Board | |
| Charts:- Daily , Weekly | |
| Add PH to Watchlist: View: Get Complete PH Trend Analysis ➞ | |
| For tabular summary view of above stock list: Summary View ➞ 0 - 25 , 25 - 50 , 50 - 75 , 75 - 100 , 100 - 125 , 125 - 150 , 150 - 175 , 175 - 200 , 200 - 225 , 225 - 250 , 250 - 275 , 275 - 300 , 300 - 325 , 325 - 350 , 350 - 375 , 375 - 400 , 400 - 425 , 425 - 450 , 450 - 475 , 475 - 500 , 500 - 525 , 525 - 550 , 550 - 575 , 575 - 600 , 600 - 625 , 625 - 650 , 650 - 675 , 675 - 700 , 700 - 725 , 725 - 750 , 750 - 775 | ||
| Click To Change The Sort Order: By Market Cap or Company Size Performance: Year-to-date, Week and Day | |
| Select Chart Type: | ||
|
Best Stocks Today 12Stocks.com |
© 2024 12Stocks.com Terms & Conditions Privacy Contact Us
All Information Provided Only For Education And Not To Be Used For Investing or Trading. See Terms & Conditions


One More Thing ... Get Best Stocks Delivered Daily!
Never Ever Miss A Move With Our Top Ten Stocks Lists
Find Best Stocks In Any Market - Bull or Bear Market
Take A Peek At Our Top Ten Stocks Lists: Daily, Weekly, Year-to-Date & Top Trends
Find Best Stocks In Any Market - Bull or Bear Market
Take A Peek At Our Top Ten Stocks Lists: Daily, Weekly, Year-to-Date & Top Trends
Midcap Stocks With Best Up Trends [0-bearish to 100-bullish]: Pinterest [100], Garmin [100], Brookfield Renewable[100], Amcor [100], United [100], Axalta Coating[100], DuPont de[100], Clean Harbors[100], Equitable [100], Columbia Banking[100], Playtika Holding[100]
Best Midcap Stocks Year-to-Date:
Vistra Energy[99.53%], AppLovin [76.53%], ShockWave Medical[73.09%], EMCOR [64.9%], Constellation Energy[57.66%], CAVA [56.42%], Tenet [53.43%], Spotify [51.42%], Natera [50.3%], Wingstop [49.65%], Antero Resources[44%] Best Midcap Stocks This Week:
Tenet [20.62%], Pinterest [19.2%], Bio-Techne [14.67%], New York[14.48%], Garmin [13.92%], Sensata Technologies[11.46%], Brookfield Renewable[10.3%], Woodward [10.15%], Axalta Coating[9.58%], Maravai LifeSciences[9.35%], Amcor [9.25%] Best Midcap Stocks Daily:
New York[28.30%], Pinterest [21.02%], Bio-Techne [16.22%], Garmin [13.12%], Brookfield Renewable[10.63%], Amcor [9.62%], United [8.88%], Axalta Coating[8.81%], DuPont de[8.01%], Clean Harbors[6.81%], Verisk Analytics[6.81%]