
 Login Sign Up


| |||||
 |  | ||||

| 12Stocks.com Market Intelligence |
Best MidCap Stocks
|
| In a hurry? Mid Cap Stocks Lists: Performance Trends Table, Stock Charts
Sort midcap stocks: Daily, Weekly, Year-to-Date, Market Cap & Trends. Filter midcap stocks list by sector: Show all, Tech, Finance, Energy, Staples, Retail, Industrial, Materials, Utilities and HealthCare Filter midcap stocks list by size:All MidCap Large Mid-Range Small |
| 12Stocks.com Mid Cap Stocks Performances & Trends Daily | |||||||||
|
|  The overall Smart Investing & Trading Score is 56 (0-bearish to 100-bullish) which puts Mid Cap index in short term neutral trend. The Smart Investing & Trading Score from previous trading session is 49 and hence an improvement of trend.
| ||||||||
Here are the Smart Investing & Trading Scores of the most requested mid cap stocks at 12Stocks.com (click stock name for detailed review):
|


| 12Stocks.com: Top Performing Mid Cap Index Stocks | ||||||||||||||||||||||||||||||||||||||||||||||||
 The top performing Mid Cap Index stocks year to date are
Now, more recently, over last week, the top performing Mid Cap Index stocks on the move are


|
||||||||||||||||||||||||||||||||||||||||||||||||
| 12Stocks.com: Investing in Midcap Index with Stocks | |
|
The following table helps investors and traders sort through current performance and trends (as measured by Smart Investing & Trading Score) of various
stocks in the Midcap Index. Quick View: Move mouse or cursor over stock symbol (ticker) to view short-term technical chart and over stock name to view long term chart. Click on  to add stock symbol to your watchlist and to add stock symbol to your watchlist and  to view watchlist. Click on any ticker or stock name for detailed market intelligence report for that stock. to view watchlist. Click on any ticker or stock name for detailed market intelligence report for that stock. |
12Stocks.com Performance of Stocks in Midcap Index
| Ticker | Stock Name | Watchlist | Category | Recent Price | Smart Investing & Trading Score | Change % | Weekly Change% |
| HCP | HashiCorp |   | Technology | 32.61 | 93 | -0.64% | 36.05% |
| RMD | ResMed | | Health Care | 218.06 | 100 | 18.89% | 21.92% |
| TER | Teradyne | | Technology | 114.27 | 100 | 4.92% | 19.07% |
| MDB | MongoDB | | Technology | 383.77 | 39 | 4.81% | 17.25% |
| KEX | Kirby | | Transports | 112.00 | 100 | -0.14% | 16.90% |
| HAS | Hasbro | | Consumer Staples | 64.48 | 100 | -0.75% | 16.66% |
| AMBP | Ardagh Metal | | Services & Goods | 4.05 | 100 | 1.00% | 16.05% |
| SKX | Skechers U.S.A | | Consumer Staples | 65.41 | 64 | 11.20% | 15.95% |
| CAVA | CAVA | | Services & Goods | 69.16 | 100 | 10.50% | 15.90% |
| TNDM | Tandem Diabetes | | Health Care | 35.22 | 93 | -0.96% | 15.74% |
| AR | Antero Resources | | Energy | 33.80 | 100 | 1.23% | 15.40% |
| MPWR | Monolithic Power | | Technology | 677.79 | 75 | 2.64% | 14.59% |
| MCHP | Microchip | | Technology | 93.56 | 100 | 1.46% | 14.54% |
| IRDM | Iridium | | Technology | 31.38 | 74 | 5.68% | 14.51% |
| TYL | Tyler Technologies | | Technology | 460.74 | 64 | 0.58% | 14.23% |
| GME | GameStop | | Services & Goods | 11.90 | 74 | 6.16% | 14.20% |
| WAB | Wabtec | | Transports | 164.36 | 100 | 0.72% | 14.00% |
| GL | Globe Life | | Financials | 75.75 | 27 | 0.28% | 13.50% |
| ALGM | Allegro Micro | | Technology | 30.05 | 100 | 3.84% | 13.48% |
| NWL | Newell | | Consumer Staples | 7.80 | 74 | 12.39% | 13.37% |
| R | Ryder System | | Transports | 121.95 | 86 | -0.39% | 12.18% |
| ON | ON Semiconductor | | Technology | 68.08 | 49 | 2.57% | 12.15% |
| COIN | Coinbase Global | | Financials | 236.45 | 68 | 5.74% | 12.06% |
| MRVL | Marvell | | Technology | 69.61 | 73 | 3.16% | 12.04% |
| FCNCA | First Citizens | | Financials | 1754.70 | 100 | -2.54% | 11.95% |
| For chart view version of above stock list: Chart View ➞ 0 - 25 , 25 - 50 , 50 - 75 , 75 - 100 , 100 - 125 , 125 - 150 , 150 - 175 , 175 - 200 , 200 - 225 , 225 - 250 , 250 - 275 , 275 - 300 , 300 - 325 , 325 - 350 , 350 - 375 , 375 - 400 , 400 - 425 , 425 - 450 , 450 - 475 , 475 - 500 , 500 - 525 , 525 - 550 , 550 - 575 , 575 - 600 , 600 - 625 , 625 - 650 , 650 - 675 , 675 - 700 , 700 - 725 , 725 - 750 , 750 - 775 | ||
 | Click To Change The Sort Order: By Market Cap or Company Size Performance: Year-to-date, Week and Day |  |
|
Get the most comprehensive stock market coverage daily at 12Stocks.com ➞ Best Stocks Today ➞ Best Stocks Weekly ➞ Best Stocks Year-to-Date ➞ Best Stocks Trends ➞  Best Stocks Today 12Stocks.com Best Nasdaq Stocks ➞ Best S&P 500 Stocks ➞ Best Tech Stocks ➞ Best Biotech Stocks ➞ |
| Detailed Overview of Midcap Stocks |
| Midcap Technical Overview, Leaders & Laggards, Top Midcap ETF Funds & Detailed Midcap Stocks List, Charts, Trends & More |
| Midcap: Technical Analysis, Trends & YTD Performance | |
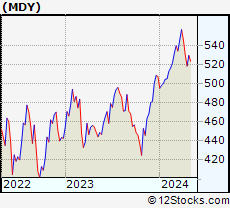
| MidCap segment as represented by
MDY, an exchange-traded fund [ETF], holds basket of about four hundred midcap stocks from across all major sectors of the US stock market. The midcap index (contains stocks like Green Mountain Coffee Roasters and Tractor Supply Company) is up by 4.34% and is currently underperforming the overall market by -1.8% year-to-date. Below is a quick view of technical charts and trends: | |
 MDY Weekly Chart |
|
| Long Term Trend: Very Good | |
| Medium Term Trend: Not Good | |
 MDY Daily Chart |
|
| Short Term Trend: Very Good | |
| Overall Trend Score: 56 | |
| YTD Performance: 4.34% | |
| **Trend Scores & Views Are Only For Educational Purposes And Not For Investing | |
| 12Stocks.com: Investing in Midcap Index using Exchange Traded Funds | |
|
The following table shows list of key exchange traded funds (ETF) that
help investors track Midcap index. The following list also includes leveraged ETF funds that track twice or thrice the daily returns of Midcap indices. Short or inverse ETF funds move in the opposite direction to the index they track and are useful during market pullbacks or during bear markets. Quick View: Move mouse or cursor over ETF symbol (ticker) to view short-term technical chart and over ETF name to view long term chart. Click on ticker or stock name for detailed view. Click on to add stock symbol to your watchlist and to view watchlist. |
12Stocks.com List of ETFs that track Midcap Index
| Ticker | ETF Name | Watchlist | Recent Price | Smart Investing & Trading Score | Change % | Week % | Year-to-date % |
| IJH | iShares Core S&P Mid-Cap | | 57.82 | 68 | 0.24 | 2.19 | 4.31% |
| IWR | iShares Russell Mid-Cap | | 80.52 | 63 | 0.31 | 2.36 | 3.59% |
| MDY | SPDR S&P MidCap 400 ETF | | 529.38 | 56 | 0.29 | 2.14 | 4.34% |
| IWP | iShares Russell Mid-Cap Growth | | 108.98 | 58 | 0.48 | 3.1 | 4.33% |
| IWS | iShares Russell Mid-Cap Value | | 119.99 | 68 | 0.17 | 1.99 | 3.18% |
| IJK | iShares S&P Mid-Cap 400 Growth | | 87.00 | 63 | 0.30 | 2.53 | 9.82% |
| IJJ | iShares S&P Mid-Cap 400 Value | | 112.23 | 58 | 0.25 | 1.52 | -1.59% |
| XMLV | PowerShares S&P MidCap Low Volatil ETF | | 54.73 | 75 | -0.02 | 1.05 | 2.91% |
| SMDD | ProShares UltraPro Short MidCap400 | | 11.77 | 40 | -1.01 | -6.31 | -12.58% |
| UMDD | ProShares UltraPro MidCap400 | | 23.96 | 63 | 1.01 | 6.19 | 7.35% |
| MYY | ProShares Short MidCap400 | | 20.79 | 40 | -0.86 | -1.88 | -3.1% |
| MZZ | ProShares UltraShort MidCap400 | | 11.68 | 27 | -0.60 | -4.03 | -7.09% |
| MVV | ProShares Ultra MidCap400 | | 61.72 | 48 | 1.13 | 4.61 | 6.62% |
| 12Stocks.com: Charts, Trends, Fundamental Data and Performances of MidCap Stocks | |
|
We now take in-depth look at all MidCap stocks including charts, multi-period performances and overall trends (as measured by Smart Investing & Trading Score). One can sort MidCap stocks (click link to choose) by Daily, Weekly and by Year-to-Date performances. Also, one can sort by size of the company or by market capitalization. |
| Select Your Default Chart Type: | |||||
| |||||
| Click on stock symbol or name for detailed view. Click on to add stock symbol to your watchlist and to view watchlist. Quick View: Move mouse or cursor over "Daily" to quickly view daily technical stock chart and over "Weekly" to view weekly technical stock chart. | |||||

 | HCP HashiCorp, Inc. |
| Sector: Technology | |
| SubSector: Software - Infrastructure | |
| MarketCap: 5070 Millions | |
| Recent Price: 32.61 Smart Investing & Trading Score: 93 | |
| Day Percent Change: -0.64% Day Change: -0.21 | |
| Week Change: 36.05% Year-to-date Change: 35.2% | |
| HCP Links: Profile News Message Board | |
| Charts:- Daily , Weekly | |
| Add HCP to Watchlist: View: Get Complete HCP Trend Analysis ➞ | |
 | RMD ResMed Inc. |
| Sector: Health Care | |
| SubSector: Medical Instruments & Supplies | |
| MarketCap: 18660.2 Millions | |
| Recent Price: 218.06 Smart Investing & Trading Score: 100 | |
| Day Percent Change: 18.89% Day Change: 34.64 | |
| Week Change: 21.92% Year-to-date Change: 26.8% | |
| RMD Links: Profile News Message Board | |
| Charts:- Daily , Weekly | |
| Add RMD to Watchlist: View: Get Complete RMD Trend Analysis ➞ | |
 | TER Teradyne, Inc. |
| Sector: Technology | |
| SubSector: Semiconductor Equipment & Materials | |
| MarketCap: 8135.68 Millions | |
| Recent Price: 114.27 Smart Investing & Trading Score: 100 | |
| Day Percent Change: 4.92% Day Change: 5.36 | |
| Week Change: 19.07% Year-to-date Change: 5.3% | |
| TER Links: Profile News Message Board | |
| Charts:- Daily , Weekly | |
| Add TER to Watchlist: View: Get Complete TER Trend Analysis ➞ | |
 | MDB MongoDB, Inc. |
| Sector: Technology | |
| SubSector: Application Software | |
| MarketCap: 7591.22 Millions | |
| Recent Price: 383.77 Smart Investing & Trading Score: 39 | |
| Day Percent Change: 4.81% Day Change: 17.60 | |
| Week Change: 17.25% Year-to-date Change: -6.1% | |
| MDB Links: Profile News Message Board | |
| Charts:- Daily , Weekly | |
| Add MDB to Watchlist: View: Get Complete MDB Trend Analysis ➞ | |
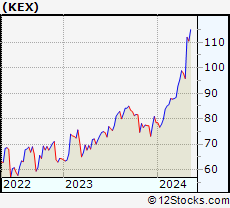 | KEX Kirby Corporation |
| Sector: Transports | |
| SubSector: Shipping | |
| MarketCap: 2533.34 Millions | |
| Recent Price: 112.00 Smart Investing & Trading Score: 100 | |
| Day Percent Change: -0.14% Day Change: -0.16 | |
| Week Change: 16.9% Year-to-date Change: 42.7% | |
| KEX Links: Profile News Message Board | |
| Charts:- Daily , Weekly | |
| Add KEX to Watchlist: View: Get Complete KEX Trend Analysis ➞ | |
 | HAS Hasbro, Inc. |
| Sector: Consumer Staples | |
| SubSector: Toys & Games | |
| MarketCap: 7389.5 Millions | |
| Recent Price: 64.48 Smart Investing & Trading Score: 100 | |
| Day Percent Change: -0.75% Day Change: -0.49 | |
| Week Change: 16.66% Year-to-date Change: 26.3% | |
| HAS Links: Profile News Message Board | |
| Charts:- Daily , Weekly | |
| Add HAS to Watchlist: View: Get Complete HAS Trend Analysis ➞ | |
 | AMBP Ardagh Metal Packaging S.A. |
| Sector: Services & Goods | |
| SubSector: Packaging & Containers | |
| MarketCap: 2170 Millions | |
| Recent Price: 4.05 Smart Investing & Trading Score: 100 | |
| Day Percent Change: 1.00% Day Change: 0.04 | |
| Week Change: 16.05% Year-to-date Change: 5.9% | |
| AMBP Links: Profile News Message Board | |
| Charts:- Daily , Weekly | |
| Add AMBP to Watchlist: View: Get Complete AMBP Trend Analysis ➞ | |
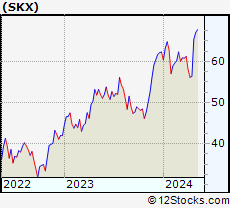 | SKX Skechers U.S.A., Inc. |
| Sector: Consumer Staples | |
| SubSector: Textile - Apparel Footwear & Accessories | |
| MarketCap: 3620.1 Millions | |
| Recent Price: 65.41 Smart Investing & Trading Score: 64 | |
| Day Percent Change: 11.20% Day Change: 6.59 | |
| Week Change: 15.95% Year-to-date Change: 4.9% | |
| SKX Links: Profile News Message Board | |
| Charts:- Daily , Weekly | |
| Add SKX to Watchlist: View: Get Complete SKX Trend Analysis ➞ | |
 | CAVA CAVA Group, Inc. |
| Sector: Services & Goods | |
| SubSector: Restaurants | |
| MarketCap: 4510 Millions | |
| Recent Price: 69.16 Smart Investing & Trading Score: 100 | |
| Day Percent Change: 10.50% Day Change: 6.57 | |
| Week Change: 15.9% Year-to-date Change: 59.1% | |
| CAVA Links: Profile News Message Board | |
| Charts:- Daily , Weekly | |
| Add CAVA to Watchlist: View: Get Complete CAVA Trend Analysis ➞ | |
 | TNDM Tandem Diabetes Care, Inc. |
| Sector: Health Care | |
| SubSector: Medical Instruments & Supplies | |
| MarketCap: 3359.1 Millions | |
| Recent Price: 35.22 Smart Investing & Trading Score: 93 | |
| Day Percent Change: -0.96% Day Change: -0.34 | |
| Week Change: 15.74% Year-to-date Change: 19.1% | |
| TNDM Links: Profile News Message Board | |
| Charts:- Daily , Weekly | |
| Add TNDM to Watchlist: View: Get Complete TNDM Trend Analysis ➞ | |
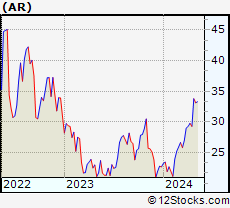 | AR Antero Resources Corporation |
| Sector: Energy | |
| SubSector: Oil & Gas Drilling & Exploration | |
| MarketCap: 256.939 Millions | |
| Recent Price: 33.80 Smart Investing & Trading Score: 100 | |
| Day Percent Change: 1.23% Day Change: 0.41 | |
| Week Change: 15.4% Year-to-date Change: 49.0% | |
| AR Links: Profile News Message Board | |
| Charts:- Daily , Weekly | |
| Add AR to Watchlist: View: Get Complete AR Trend Analysis ➞ | |
 | MPWR Monolithic Power Systems, Inc. |
| Sector: Technology | |
| SubSector: Semiconductor - Specialized | |
| MarketCap: 6436.4 Millions | |
| Recent Price: 677.79 Smart Investing & Trading Score: 75 | |
| Day Percent Change: 2.64% Day Change: 17.45 | |
| Week Change: 14.59% Year-to-date Change: 7.5% | |
| MPWR Links: Profile News Message Board | |
| Charts:- Daily , Weekly | |
| Add MPWR to Watchlist: View: Get Complete MPWR Trend Analysis ➞ | |
 | MCHP Microchip Technology Incorporated |
| Sector: Technology | |
| SubSector: Semiconductor - Broad Line | |
| MarketCap: 16826.3 Millions | |
| Recent Price: 93.56 Smart Investing & Trading Score: 100 | |
| Day Percent Change: 1.46% Day Change: 1.35 | |
| Week Change: 14.54% Year-to-date Change: 3.7% | |
| MCHP Links: Profile News Message Board | |
| Charts:- Daily , Weekly | |
| Add MCHP to Watchlist: View: Get Complete MCHP Trend Analysis ➞ | |
 | IRDM Iridium Communications Inc. |
| Sector: Technology | |
| SubSector: Diversified Communication Services | |
| MarketCap: 2711.24 Millions | |
| Recent Price: 31.38 Smart Investing & Trading Score: 74 | |
| Day Percent Change: 5.68% Day Change: 1.68 | |
| Week Change: 14.51% Year-to-date Change: -23.8% | |
| IRDM Links: Profile News Message Board | |
| Charts:- Daily , Weekly | |
| Add IRDM to Watchlist: View: Get Complete IRDM Trend Analysis ➞ | |
 | TYL Tyler Technologies, Inc. |
| Sector: Technology | |
| SubSector: Technical & System Software | |
| MarketCap: 10785 Millions | |
| Recent Price: 460.74 Smart Investing & Trading Score: 64 | |
| Day Percent Change: 0.58% Day Change: 2.67 | |
| Week Change: 14.23% Year-to-date Change: 10.2% | |
| TYL Links: Profile News Message Board | |
| Charts:- Daily , Weekly | |
| Add TYL to Watchlist: View: Get Complete TYL Trend Analysis ➞ | |
 | GME GameStop Corp. |
| Sector: Services & Goods | |
| SubSector: Electronics Stores | |
| MarketCap: 257.8 Millions | |
| Recent Price: 11.90 Smart Investing & Trading Score: 74 | |
| Day Percent Change: 6.16% Day Change: 0.69 | |
| Week Change: 14.2% Year-to-date Change: -32.1% | |
| GME Links: Profile News Message Board | |
| Charts:- Daily , Weekly | |
| Add GME to Watchlist: View: Get Complete GME Trend Analysis ➞ | |
 | WAB Wabtec Corporation |
| Sector: Transports | |
| SubSector: Railroads | |
| MarketCap: 8230.22 Millions | |
| Recent Price: 164.36 Smart Investing & Trading Score: 100 | |
| Day Percent Change: 0.72% Day Change: 1.18 | |
| Week Change: 14% Year-to-date Change: 29.5% | |
| WAB Links: Profile News Message Board | |
| Charts:- Daily , Weekly | |
| Add WAB to Watchlist: View: Get Complete WAB Trend Analysis ➞ | |
 | GL Globe Life Inc. |
| Sector: Financials | |
| SubSector: Life Insurance | |
| MarketCap: 7596.46 Millions | |
| Recent Price: 75.75 Smart Investing & Trading Score: 27 | |
| Day Percent Change: 0.28% Day Change: 0.21 | |
| Week Change: 13.5% Year-to-date Change: -37.8% | |
| GL Links: Profile News Message Board | |
| Charts:- Daily , Weekly | |
| Add GL to Watchlist: View: Get Complete GL Trend Analysis ➞ | |
 | ALGM Allegro MicroSystems, Inc. |
| Sector: Technology | |
| SubSector: Semiconductors | |
| MarketCap: 50287 Millions | |
| Recent Price: 30.05 Smart Investing & Trading Score: 100 | |
| Day Percent Change: 3.84% Day Change: 1.11 | |
| Week Change: 13.48% Year-to-date Change: -0.8% | |
| ALGM Links: Profile News Message Board | |
| Charts:- Daily , Weekly | |
| Add ALGM to Watchlist: View: Get Complete ALGM Trend Analysis ➞ | |
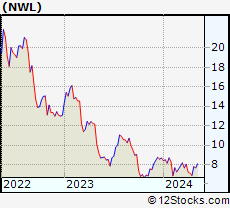 | NWL Newell Brands Inc. |
| Sector: Consumer Staples | |
| SubSector: Housewares & Accessories | |
| MarketCap: 5833.53 Millions | |
| Recent Price: 7.80 Smart Investing & Trading Score: 74 | |
| Day Percent Change: 12.39% Day Change: 0.86 | |
| Week Change: 13.37% Year-to-date Change: -10.1% | |
| NWL Links: Profile News Message Board | |
| Charts:- Daily , Weekly | |
| Add NWL to Watchlist: View: Get Complete NWL Trend Analysis ➞ | |
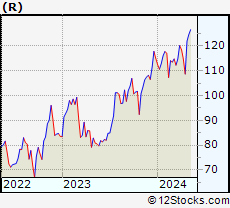 | R Ryder System, Inc. |
| Sector: Transports | |
| SubSector: Rental & Leasing Services | |
| MarketCap: 1550.94 Millions | |
| Recent Price: 121.95 Smart Investing & Trading Score: 86 | |
| Day Percent Change: -0.39% Day Change: -0.48 | |
| Week Change: 12.18% Year-to-date Change: 6.0% | |
| R Links: Profile News Message Board | |
| Charts:- Daily , Weekly | |
| Add R to Watchlist: View: Get Complete R Trend Analysis ➞ | |
 | ON ON Semiconductor Corporation |
| Sector: Technology | |
| SubSector: Semiconductor - Broad Line | |
| MarketCap: 5183.82 Millions | |
| Recent Price: 68.08 Smart Investing & Trading Score: 49 | |
| Day Percent Change: 2.57% Day Change: 1.70 | |
| Week Change: 12.15% Year-to-date Change: -18.5% | |
| ON Links: Profile News Message Board | |
| Charts:- Daily , Weekly | |
| Add ON to Watchlist: View: Get Complete ON Trend Analysis ➞ | |
 | COIN Coinbase Global, Inc. |
| Sector: Financials | |
| SubSector: Financial Data & Stock Exchanges | |
| MarketCap: 16390 Millions | |
| Recent Price: 236.45 Smart Investing & Trading Score: 68 | |
| Day Percent Change: 5.74% Day Change: 12.84 | |
| Week Change: 12.06% Year-to-date Change: 36.8% | |
| COIN Links: Profile News Message Board | |
| Charts:- Daily , Weekly | |
| Add COIN to Watchlist: View: Get Complete COIN Trend Analysis ➞ | |
 | MRVL Marvell Technology Group Ltd. |
| Sector: Technology | |
| SubSector: Semiconductor - Integrated Circuits | |
| MarketCap: 14090.4 Millions | |
| Recent Price: 69.61 Smart Investing & Trading Score: 73 | |
| Day Percent Change: 3.16% Day Change: 2.13 | |
| Week Change: 12.04% Year-to-date Change: 15.4% | |
| MRVL Links: Profile News Message Board | |
| Charts:- Daily , Weekly | |
| Add MRVL to Watchlist: View: Get Complete MRVL Trend Analysis ➞ | |
 | FCNCA First Citizens BancShares, Inc. |
| Sector: Financials | |
| SubSector: Regional - Mid-Atlantic Banks | |
| MarketCap: 3157.19 Millions | |
| Recent Price: 1754.70 Smart Investing & Trading Score: 100 | |
| Day Percent Change: -2.54% Day Change: -45.65 | |
| Week Change: 11.95% Year-to-date Change: 23.7% | |
| FCNCA Links: Profile News Message Board | |
| Charts:- Daily , Weekly | |
| Add FCNCA to Watchlist: View: Get Complete FCNCA Trend Analysis ➞ | |
| For tabular summary view of above stock list: Summary View ➞ 0 - 25 , 25 - 50 , 50 - 75 , 75 - 100 , 100 - 125 , 125 - 150 , 150 - 175 , 175 - 200 , 200 - 225 , 225 - 250 , 250 - 275 , 275 - 300 , 300 - 325 , 325 - 350 , 350 - 375 , 375 - 400 , 400 - 425 , 425 - 450 , 450 - 475 , 475 - 500 , 500 - 525 , 525 - 550 , 550 - 575 , 575 - 600 , 600 - 625 , 625 - 650 , 650 - 675 , 675 - 700 , 700 - 725 , 725 - 750 , 750 - 775 | ||
| Click To Change The Sort Order: By Market Cap or Company Size Performance: Year-to-date, Week and Day | |
| Select Chart Type: | ||
|
Best Stocks Today 12Stocks.com |
© 2024 12Stocks.com Terms & Conditions Privacy Contact Us
All Information Provided Only For Education And Not To Be Used For Investing or Trading. See Terms & Conditions


One More Thing ... Get Best Stocks Delivered Daily!
Never Ever Miss A Move With Our Top Ten Stocks Lists
Find Best Stocks In Any Market - Bull or Bear Market
Take A Peek At Our Top Ten Stocks Lists: Daily, Weekly, Year-to-Date & Top Trends
Find Best Stocks In Any Market - Bull or Bear Market
Take A Peek At Our Top Ten Stocks Lists: Daily, Weekly, Year-to-Date & Top Trends
Midcap Stocks With Best Up Trends [0-bearish to 100-bullish]: ResMed [100], CAVA [100], AutoNation [100], ZoomInfo Technologies[100], Teradyne [100], Allegro Micro[100], Tractor Supply[100], Carrier Global[100], American Homes[100], Mid-America Apartment[100], Zebra Technologies[100]
Best Midcap Stocks Year-to-Date:
Vistra Energy[88.73%], AppLovin [85.5%], ShockWave Medical[73.22%], EMCOR [64.33%], Constellation Energy[60.86%], CAVA [59.06%], Spotify [54.11%], Wingstop [49.13%], Antero Resources[49.03%], Pure Storage[48.49%], Natera [46.34%] Best Midcap Stocks This Week:
HashiCorp [36.05%], ResMed [21.92%], Teradyne [19.07%], MongoDB [17.25%], Kirby [16.9%], Hasbro [16.66%], Ardagh Metal[16.05%], Skechers U.S.A[15.95%], CAVA [15.9%], Tandem Diabetes[15.74%], Antero Resources[15.4%] Best Midcap Stocks Daily:
ResMed [18.89%], Newell [12.39%], Skechers U.S.A[11.20%], Ginkgo Bioworks[10.60%], CAVA [10.50%], QuantumScape [7.65%], AppLovin [6.66%], GameStop [6.16%], Rivian Automotive[6.04%], AutoNation [5.92%], ZoomInfo Technologies[5.90%]