
 Login Sign Up


| |||||
 |  | ||||

| 12Stocks.com Market Intelligence |
Best MidCap Stocks
|
| In a hurry? Mid Cap Stocks Lists: Performance Trends Table, Stock Charts
Sort midcap stocks: Daily, Weekly, Year-to-Date, Market Cap & Trends. Filter midcap stocks list by sector: Show all, Tech, Finance, Energy, Staples, Retail, Industrial, Materials, Utilities and HealthCare Filter midcap stocks list by size:All MidCap Large Mid-Range Small |
| 12Stocks.com Mid Cap Stocks Performances & Trends Daily | |||||||||
|
|  The overall Smart Investing & Trading Score is 63 (0-bearish to 100-bullish) which puts Mid Cap index in short term neutral to bullish trend. The Smart Investing & Trading Score from previous trading session is 44 and an improvement of trend continues.
| ||||||||
Here are the Smart Investing & Trading Scores of the most requested mid cap stocks at 12Stocks.com (click stock name for detailed review):
|


| 12Stocks.com: Top Performing Mid Cap Index Stocks | ||||||||||||||||||||||||||||||||||||||||||||||||
 The top performing Mid Cap Index stocks year to date are
Now, more recently, over last week, the top performing Mid Cap Index stocks on the move are


|
||||||||||||||||||||||||||||||||||||||||||||||||
| 12Stocks.com: Investing in Midcap Index with Stocks | |
|
The following table helps investors and traders sort through current performance and trends (as measured by Smart Investing & Trading Score) of various
stocks in the Midcap Index. Quick View: Move mouse or cursor over stock symbol (ticker) to view short-term technical chart and over stock name to view long term chart. Click on  to add stock symbol to your watchlist and to add stock symbol to your watchlist and  to view watchlist. Click on any ticker or stock name for detailed market intelligence report for that stock. to view watchlist. Click on any ticker or stock name for detailed market intelligence report for that stock. |
12Stocks.com Performance of Stocks in Midcap Index
| Ticker | Stock Name | Watchlist | Category | Recent Price | Smart Investing & Trading Score | Change % | Weekly Change% |
| AYI | Acuity |   | Technology | 253.09 | 63 | -0.82% | 2.44% |
| IT | Gartner | | Technology | 451.06 | 32 | 0.18% | 2.43% |
| RGA | Reinsurance | | Financials | 191.01 | 70 | 0.51% | 2.41% |
| PSTG | Pure Storage | | Technology | 50.65 | 56 | -2.22% | 2.41% |
| NWL | Newell | | Consumer Staples | 7.04 | 42 | -1.19% | 2.40% |
| PTC | PTC | | Technology | 180.61 | 45 | 0.09% | 2.40% |
| AWK | American Water | | Utilities | 121.36 | 74 | 1.24% | 2.40% |
| LAMR | Lamar Advertising | | Financials | 114.11 | 83 | -0.47% | 2.39% |
| YUM | Yum! | | Services & Goods | 141.81 | 100 | 1.22% | 2.39% |
| K | Kellogg | | Consumer Staples | 58.75 | 100 | 1.05% | 2.39% |
| IART | Integra LifeSciences | | Health Care | 29.35 | 25 | -0.10% | 2.34% |
| LII | Lennox | | Industrials | 467.85 | 65 | -1.85% | 2.34% |
| GRMN | Garmin | | Technology | 142.79 | 63 | 0.20% | 2.34% |
| SSRM | SSR Mining | | Materials | 5.47 | 55 | 1.96% | 2.34% |
| HRB | H&R Block | | Services & Goods | 47.93 | 90 | 0.59% | 2.33% |
| CHH | Choice Hotels | | Services & Goods | 119.06 | 42 | 1.64% | 2.33% |
| MHK | Mohawk Industries | | Consumer Staples | 111.40 | 63 | -1.80% | 2.31% |
| PCAR | PACCAR | | Consumer Staples | 113.75 | 58 | 0.38% | 2.30% |
| AGNC | AGNC | | Financials | 9.36 | 44 | -0.11% | 2.30% |
| TSN | Tyson Foods | | Consumer Staples | 61.32 | 100 | 0.56% | 2.29% |
| BFAM | Bright Horizons | | Services & Goods | 106.83 | 63 | -0.73% | 2.28% |
| PEG | Public Service | | Utilities | 67.23 | 95 | 1.11% | 2.27% |
| WSM | Williams-Sonoma | | Services & Goods | 285.51 | 68 | 0.15% | 2.26% |
| TDC | Teradata | | Technology | 37.15 | 49 | 0.95% | 2.26% |
| AMG | Affiliated Managers | | Financials | 162.07 | 61 | 0.37% | 2.25% |
| For chart view version of above stock list: Chart View ➞ 0 - 25 , 25 - 50 , 50 - 75 , 75 - 100 , 100 - 125 , 125 - 150 , 150 - 175 , 175 - 200 , 200 - 225 , 225 - 250 , 250 - 275 , 275 - 300 , 300 - 325 , 325 - 350 , 350 - 375 , 375 - 400 , 400 - 425 , 425 - 450 , 450 - 475 , 475 - 500 , 500 - 525 , 525 - 550 , 550 - 575 , 575 - 600 , 600 - 625 , 625 - 650 , 650 - 675 , 675 - 700 , 700 - 725 , 725 - 750 , 750 - 775 | ||
 | Click To Change The Sort Order: By Market Cap or Company Size Performance: Year-to-date, Week and Day |  |
|
Get the most comprehensive stock market coverage daily at 12Stocks.com ➞ Best Stocks Today ➞ Best Stocks Weekly ➞ Best Stocks Year-to-Date ➞ Best Stocks Trends ➞  Best Stocks Today 12Stocks.com Best Nasdaq Stocks ➞ Best S&P 500 Stocks ➞ Best Tech Stocks ➞ Best Biotech Stocks ➞ |
| Detailed Overview of Midcap Stocks |
| Midcap Technical Overview, Leaders & Laggards, Top Midcap ETF Funds & Detailed Midcap Stocks List, Charts, Trends & More |
| Midcap: Technical Analysis, Trends & YTD Performance | |
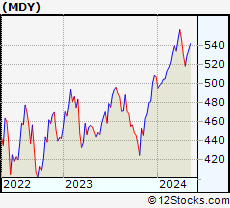
| MidCap segment as represented by
MDY, an exchange-traded fund [ETF], holds basket of about four hundred midcap stocks from across all major sectors of the US stock market. The midcap index (contains stocks like Green Mountain Coffee Roasters and Tractor Supply Company) is up by 4.42% and is currently underperforming the overall market by -1.24% year-to-date. Below is a quick view of technical charts and trends: | |
 MDY Weekly Chart |
|
| Long Term Trend: Very Good | |
| Medium Term Trend: Not Good | |
 MDY Daily Chart |
|
| Short Term Trend: Very Good | |
| Overall Trend Score: 63 | |
| YTD Performance: 4.42% | |
| **Trend Scores & Views Are Only For Educational Purposes And Not For Investing | |
| 12Stocks.com: Investing in Midcap Index using Exchange Traded Funds | |
|
The following table shows list of key exchange traded funds (ETF) that
help investors track Midcap index. The following list also includes leveraged ETF funds that track twice or thrice the daily returns of Midcap indices. Short or inverse ETF funds move in the opposite direction to the index they track and are useful during market pullbacks or during bear markets. Quick View: Move mouse or cursor over ETF symbol (ticker) to view short-term technical chart and over ETF name to view long term chart. Click on ticker or stock name for detailed view. Click on to add stock symbol to your watchlist and to view watchlist. |
12Stocks.com List of ETFs that track Midcap Index
| Ticker | ETF Name | Watchlist | Recent Price | Smart Investing & Trading Score | Change % | Week % | Year-to-date % |
| IJH | iShares Core S&P Mid-Cap | | 57.87 | 68 | 0.03 | 2.28 | 4.4% |
| IWR | iShares Russell Mid-Cap | | 80.41 | 48 | 0.05 | 2.22 | 3.45% |
| MDY | SPDR S&P MidCap 400 ETF | | 529.80 | 63 | 0.00 | 2.22 | 4.42% |
| IWP | iShares Russell Mid-Cap Growth | | 108.49 | 43 | -0.13 | 2.64 | 3.86% |
| IJK | iShares S&P Mid-Cap 400 Growth | | 86.99 | 48 | 0.07 | 2.52 | 9.81% |
| IWS | iShares Russell Mid-Cap Value | | 119.97 | 68 | 0.09 | 1.97 | 3.16% |
| IJJ | iShares S&P Mid-Cap 400 Value | | 112.59 | 41 | 0.11 | 1.85 | -1.27% |
| XMLV | PowerShares S&P MidCap Low Volatil ETF | | 55.00 | 60 | 0.16 | 1.55 | 3.42% |
| MVV | ProShares Ultra MidCap400 | | 61.60 | 41 | 0.10 | 4.41 | 6.41% |
| UMDD | ProShares UltraPro MidCap400 | | 24.09 | 63 | -0.08 | 6.77 | 7.93% |
| SMDD | ProShares UltraPro Short MidCap400 | | 11.65 | 32 | -0.01 | -7.27 | -13.47% |
| MYY | ProShares Short MidCap400 | | 20.74 | 32 | 0.00 | -2.12 | -3.33% |
| MZZ | ProShares UltraShort MidCap400 | | 11.77 | 34 | 0.94 | -3.29 | -6.37% |
| 12Stocks.com: Charts, Trends, Fundamental Data and Performances of MidCap Stocks | |
|
We now take in-depth look at all MidCap stocks including charts, multi-period performances and overall trends (as measured by Smart Investing & Trading Score). One can sort MidCap stocks (click link to choose) by Daily, Weekly and by Year-to-Date performances. Also, one can sort by size of the company or by market capitalization. |
| Select Your Default Chart Type: | |||||
| |||||
| Click on stock symbol or name for detailed view. Click on to add stock symbol to your watchlist and to view watchlist. Quick View: Move mouse or cursor over "Daily" to quickly view daily technical stock chart and over "Weekly" to view weekly technical stock chart. | |||||

 | AYI Acuity Brands, Inc. |
| Sector: Technology | |
| SubSector: Diversified Electronics | |
| MarketCap: 3356.66 Millions | |
| Recent Price: 253.09 Smart Investing & Trading Score: 63 | |
| Day Percent Change: -0.82% Day Change: -2.10 | |
| Week Change: 2.44% Year-to-date Change: 23.6% | |
| AYI Links: Profile News Message Board | |
| Charts:- Daily , Weekly | |
| Add AYI to Watchlist: View: Get Complete AYI Trend Analysis ➞ | |
 | IT Gartner, Inc. |
| Sector: Technology | |
| SubSector: Information Technology Services | |
| MarketCap: 7767.98 Millions | |
| Recent Price: 451.06 Smart Investing & Trading Score: 32 | |
| Day Percent Change: 0.18% Day Change: 0.80 | |
| Week Change: 2.43% Year-to-date Change: 0.0% | |
| IT Links: Profile News Message Board | |
| Charts:- Daily , Weekly | |
| Add IT to Watchlist: View: Get Complete IT Trend Analysis ➞ | |
 | RGA Reinsurance Group of America, Incorporated |
| Sector: Financials | |
| SubSector: Life Insurance | |
| MarketCap: 4423.36 Millions | |
| Recent Price: 191.01 Smart Investing & Trading Score: 70 | |
| Day Percent Change: 0.51% Day Change: 0.97 | |
| Week Change: 2.41% Year-to-date Change: 18.1% | |
| RGA Links: Profile News Message Board | |
| Charts:- Daily , Weekly | |
| Add RGA to Watchlist: View: Get Complete RGA Trend Analysis ➞ | |
 | PSTG Pure Storage, Inc. |
| Sector: Technology | |
| SubSector: Data Storage Devices | |
| MarketCap: 2993.99 Millions | |
| Recent Price: 50.65 Smart Investing & Trading Score: 56 | |
| Day Percent Change: -2.22% Day Change: -1.15 | |
| Week Change: 2.41% Year-to-date Change: 42.0% | |
| PSTG Links: Profile News Message Board | |
| Charts:- Daily , Weekly | |
| Add PSTG to Watchlist: View: Get Complete PSTG Trend Analysis ➞ | |
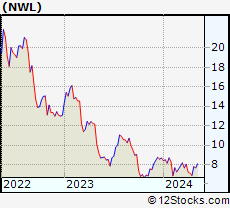 | NWL Newell Brands Inc. |
| Sector: Consumer Staples | |
| SubSector: Housewares & Accessories | |
| MarketCap: 5833.53 Millions | |
| Recent Price: 7.04 Smart Investing & Trading Score: 42 | |
| Day Percent Change: -1.19% Day Change: -0.08 | |
| Week Change: 2.4% Year-to-date Change: -18.8% | |
| NWL Links: Profile News Message Board | |
| Charts:- Daily , Weekly | |
| Add NWL to Watchlist: View: Get Complete NWL Trend Analysis ➞ | |
 | PTC PTC Inc. |
| Sector: Technology | |
| SubSector: Technical & System Software | |
| MarketCap: 6166.7 Millions | |
| Recent Price: 180.61 Smart Investing & Trading Score: 45 | |
| Day Percent Change: 0.09% Day Change: 0.17 | |
| Week Change: 2.4% Year-to-date Change: 3.2% | |
| PTC Links: Profile News Message Board | |
| Charts:- Daily , Weekly | |
| Add PTC to Watchlist: View: Get Complete PTC Trend Analysis ➞ | |
 | AWK American Water Works Company, Inc. |
| Sector: Utilities | |
| SubSector: Water Utilities | |
| MarketCap: 20029.2 Millions | |
| Recent Price: 121.36 Smart Investing & Trading Score: 74 | |
| Day Percent Change: 1.24% Day Change: 1.49 | |
| Week Change: 2.4% Year-to-date Change: -8.1% | |
| AWK Links: Profile News Message Board | |
| Charts:- Daily , Weekly | |
| Add AWK to Watchlist: View: Get Complete AWK Trend Analysis ➞ | |
 | LAMR Lamar Advertising Company (REIT) |
| Sector: Financials | |
| SubSector: REIT - Diversified | |
| MarketCap: 4838.33 Millions | |
| Recent Price: 114.11 Smart Investing & Trading Score: 83 | |
| Day Percent Change: -0.47% Day Change: -0.53 | |
| Week Change: 2.39% Year-to-date Change: 7.4% | |
| LAMR Links: Profile News Message Board | |
| Charts:- Daily , Weekly | |
| Add LAMR to Watchlist: View: Get Complete LAMR Trend Analysis ➞ | |
 | YUM Yum! Brands, Inc. |
| Sector: Services & Goods | |
| SubSector: Restaurants | |
| MarketCap: 18033.3 Millions | |
| Recent Price: 141.81 Smart Investing & Trading Score: 100 | |
| Day Percent Change: 1.22% Day Change: 1.71 | |
| Week Change: 2.39% Year-to-date Change: 8.5% | |
| YUM Links: Profile News Message Board | |
| Charts:- Daily , Weekly | |
| Add YUM to Watchlist: View: Get Complete YUM Trend Analysis ➞ | |
 | K Kellogg Company |
| Sector: Consumer Staples | |
| SubSector: Processed & Packaged Goods | |
| MarketCap: 20264.6 Millions | |
| Recent Price: 58.75 Smart Investing & Trading Score: 100 | |
| Day Percent Change: 1.05% Day Change: 0.61 | |
| Week Change: 2.39% Year-to-date Change: 5.1% | |
| K Links: Profile News Message Board | |
| Charts:- Daily , Weekly | |
| Add K to Watchlist: View: Get Complete K Trend Analysis ➞ | |
 | IART Integra LifeSciences Holdings Corporation |
| Sector: Health Care | |
| SubSector: Medical Instruments & Supplies | |
| MarketCap: 3510.4 Millions | |
| Recent Price: 29.35 Smart Investing & Trading Score: 25 | |
| Day Percent Change: -0.10% Day Change: -0.03 | |
| Week Change: 2.34% Year-to-date Change: -32.6% | |
| IART Links: Profile News Message Board | |
| Charts:- Daily , Weekly | |
| Add IART to Watchlist: View: Get Complete IART Trend Analysis ➞ | |
 | LII Lennox International Inc. |
| Sector: Industrials | |
| SubSector: Diversified Machinery | |
| MarketCap: 7720.66 Millions | |
| Recent Price: 467.85 Smart Investing & Trading Score: 65 | |
| Day Percent Change: -1.85% Day Change: -8.81 | |
| Week Change: 2.34% Year-to-date Change: 4.5% | |
| LII Links: Profile News Message Board | |
| Charts:- Daily , Weekly | |
| Add LII to Watchlist: View: Get Complete LII Trend Analysis ➞ | |
 | GRMN Garmin Ltd. |
| Sector: Technology | |
| SubSector: Scientific & Technical Instruments | |
| MarketCap: 13909.3 Millions | |
| Recent Price: 142.79 Smart Investing & Trading Score: 63 | |
| Day Percent Change: 0.20% Day Change: 0.28 | |
| Week Change: 2.34% Year-to-date Change: 11.1% | |
| GRMN Links: Profile News Message Board | |
| Charts:- Daily , Weekly | |
| Add GRMN to Watchlist: View: Get Complete GRMN Trend Analysis ➞ | |
 | SSRM SSR Mining Inc. |
| Sector: Materials | |
| SubSector: Gold | |
| MarketCap: 1546.09 Millions | |
| Recent Price: 5.47 Smart Investing & Trading Score: 55 | |
| Day Percent Change: 1.96% Day Change: 0.10 | |
| Week Change: 2.34% Year-to-date Change: -49.2% | |
| SSRM Links: Profile News Message Board | |
| Charts:- Daily , Weekly | |
| Add SSRM to Watchlist: View: Get Complete SSRM Trend Analysis ➞ | |
 | HRB H&R Block, Inc. |
| Sector: Services & Goods | |
| SubSector: Personal Services | |
| MarketCap: 3052.45 Millions | |
| Recent Price: 47.93 Smart Investing & Trading Score: 90 | |
| Day Percent Change: 0.59% Day Change: 0.28 | |
| Week Change: 2.33% Year-to-date Change: -0.9% | |
| HRB Links: Profile News Message Board | |
| Charts:- Daily , Weekly | |
| Add HRB to Watchlist: View: Get Complete HRB Trend Analysis ➞ | |
 | CHH Choice Hotels International, Inc. |
| Sector: Services & Goods | |
| SubSector: Lodging | |
| MarketCap: 3427.56 Millions | |
| Recent Price: 119.06 Smart Investing & Trading Score: 42 | |
| Day Percent Change: 1.64% Day Change: 1.92 | |
| Week Change: 2.33% Year-to-date Change: 5.1% | |
| CHH Links: Profile News Message Board | |
| Charts:- Daily , Weekly | |
| Add CHH to Watchlist: View: Get Complete CHH Trend Analysis ➞ | |
 | MHK Mohawk Industries, Inc. |
| Sector: Consumer Staples | |
| SubSector: Home Furnishings & Fixtures | |
| MarketCap: 4682.25 Millions | |
| Recent Price: 111.40 Smart Investing & Trading Score: 63 | |
| Day Percent Change: -1.80% Day Change: -2.04 | |
| Week Change: 2.31% Year-to-date Change: 7.6% | |
| MHK Links: Profile News Message Board | |
| Charts:- Daily , Weekly | |
| Add MHK to Watchlist: View: Get Complete MHK Trend Analysis ➞ | |
 | PCAR PACCAR Inc |
| Sector: Consumer Staples | |
| SubSector: Trucks & Other Vehicles | |
| MarketCap: 19117.7 Millions | |
| Recent Price: 113.75 Smart Investing & Trading Score: 58 | |
| Day Percent Change: 0.38% Day Change: 0.43 | |
| Week Change: 2.3% Year-to-date Change: 16.5% | |
| PCAR Links: Profile News Message Board | |
| Charts:- Daily , Weekly | |
| Add PCAR to Watchlist: View: Get Complete PCAR Trend Analysis ➞ | |
 | AGNC AGNC Investment Corp. |
| Sector: Financials | |
| SubSector: Mortgage Investment | |
| MarketCap: 6622.19 Millions | |
| Recent Price: 9.36 Smart Investing & Trading Score: 44 | |
| Day Percent Change: -0.11% Day Change: -0.01 | |
| Week Change: 2.3% Year-to-date Change: -4.6% | |
| AGNC Links: Profile News Message Board | |
| Charts:- Daily , Weekly | |
| Add AGNC to Watchlist: View: Get Complete AGNC Trend Analysis ➞ | |
 | TSN Tyson Foods, Inc. |
| Sector: Consumer Staples | |
| SubSector: Meat Products | |
| MarketCap: 22124.1 Millions | |
| Recent Price: 61.32 Smart Investing & Trading Score: 100 | |
| Day Percent Change: 0.56% Day Change: 0.34 | |
| Week Change: 2.29% Year-to-date Change: 14.1% | |
| TSN Links: Profile News Message Board | |
| Charts:- Daily , Weekly | |
| Add TSN to Watchlist: View: Get Complete TSN Trend Analysis ➞ | |
 | BFAM Bright Horizons Family Solutions Inc. |
| Sector: Services & Goods | |
| SubSector: Personal Services | |
| MarketCap: 5487.65 Millions | |
| Recent Price: 106.83 Smart Investing & Trading Score: 63 | |
| Day Percent Change: -0.73% Day Change: -0.79 | |
| Week Change: 2.28% Year-to-date Change: 13.4% | |
| BFAM Links: Profile News Message Board | |
| Charts:- Daily , Weekly | |
| Add BFAM to Watchlist: View: Get Complete BFAM Trend Analysis ➞ | |
 | PEG Public Service Enterprise Group Incorporated |
| Sector: Utilities | |
| SubSector: Diversified Utilities | |
| MarketCap: 20886 Millions | |
| Recent Price: 67.23 Smart Investing & Trading Score: 95 | |
| Day Percent Change: 1.11% Day Change: 0.74 | |
| Week Change: 2.27% Year-to-date Change: 9.9% | |
| PEG Links: Profile News Message Board | |
| Charts:- Daily , Weekly | |
| Add PEG to Watchlist: View: Get Complete PEG Trend Analysis ➞ | |
 | WSM Williams-Sonoma, Inc. |
| Sector: Services & Goods | |
| SubSector: Home Furnishing Stores | |
| MarketCap: 3370.05 Millions | |
| Recent Price: 285.51 Smart Investing & Trading Score: 68 | |
| Day Percent Change: 0.15% Day Change: 0.44 | |
| Week Change: 2.26% Year-to-date Change: 41.5% | |
| WSM Links: Profile News Message Board | |
| Charts:- Daily , Weekly | |
| Add WSM to Watchlist: View: Get Complete WSM Trend Analysis ➞ | |
 | TDC Teradata Corporation |
| Sector: Technology | |
| SubSector: Information Technology Services | |
| MarketCap: 2229.48 Millions | |
| Recent Price: 37.15 Smart Investing & Trading Score: 49 | |
| Day Percent Change: 0.95% Day Change: 0.35 | |
| Week Change: 2.26% Year-to-date Change: -14.6% | |
| TDC Links: Profile News Message Board | |
| Charts:- Daily , Weekly | |
| Add TDC to Watchlist: View: Get Complete TDC Trend Analysis ➞ | |
 | AMG Affiliated Managers Group, Inc. |
| Sector: Financials | |
| SubSector: Asset Management | |
| MarketCap: 2849.63 Millions | |
| Recent Price: 162.07 Smart Investing & Trading Score: 61 | |
| Day Percent Change: 0.37% Day Change: 0.60 | |
| Week Change: 2.25% Year-to-date Change: 7.0% | |
| AMG Links: Profile News Message Board | |
| Charts:- Daily , Weekly | |
| Add AMG to Watchlist: View: Get Complete AMG Trend Analysis ➞ | |
| For tabular summary view of above stock list: Summary View ➞ 0 - 25 , 25 - 50 , 50 - 75 , 75 - 100 , 100 - 125 , 125 - 150 , 150 - 175 , 175 - 200 , 200 - 225 , 225 - 250 , 250 - 275 , 275 - 300 , 300 - 325 , 325 - 350 , 350 - 375 , 375 - 400 , 400 - 425 , 425 - 450 , 450 - 475 , 475 - 500 , 500 - 525 , 525 - 550 , 550 - 575 , 575 - 600 , 600 - 625 , 625 - 650 , 650 - 675 , 675 - 700 , 700 - 725 , 725 - 750 , 750 - 775 | ||
| Click To Change The Sort Order: By Market Cap or Company Size Performance: Year-to-date, Week and Day | |
| Select Chart Type: | ||
|
Best Stocks Today 12Stocks.com |
© 2024 12Stocks.com Terms & Conditions Privacy Contact Us
All Information Provided Only For Education And Not To Be Used For Investing or Trading. See Terms & Conditions


One More Thing ... Get Best Stocks Delivered Daily!
Never Ever Miss A Move With Our Top Ten Stocks Lists
Find Best Stocks In Any Market - Bull or Bear Market
Take A Peek At Our Top Ten Stocks Lists: Daily, Weekly, Year-to-Date & Top Trends
Find Best Stocks In Any Market - Bull or Bear Market
Take A Peek At Our Top Ten Stocks Lists: Daily, Weekly, Year-to-Date & Top Trends
Midcap Stocks With Best Up Trends [0-bearish to 100-bullish]: Hasbro [100], Wabtec [100], Allegro Micro[100], Microchip [100], Synchrony Financial[100], EQT [100], Kemper [100], Range Resources[100], Virtu Financial[100], Crane Co[100], National Fuel[100]
Best Midcap Stocks Year-to-Date:
Vistra Energy[82.92%], AppLovin [74.52%], ShockWave Medical[72.42%], Constellation Energy[59.4%], EMCOR [57.31%], Spotify [49.66%], Natera [46.02%], Pure Storage[42.04%], Williams-Sonoma [41.5%], Wingstop [41.37%], NRG Energy[40.44%] Best Midcap Stocks This Week:
HashiCorp [23.7%], Globe Life[17.77%], Hasbro [17.66%], Tandem Diabetes[15.51%], Wabtec [13.32%], MongoDB [12.85%], Ryder System[12.4%], Microchip [11.07%], Watsco [11%], Crane Co[9.77%], Coinbase Global[9.74%] Best Midcap Stocks Daily:
Hasbro [11.85%], Wabtec [10.04%], CoStar [8.74%], Allegro Micro[8.24%], GameStop [7.58%], Watsco [6.54%], Hertz Global[6.41%], ON Semiconductor[6.26%], Sarepta [6.10%], Lattice Semiconductor[5.34%], Microchip [5.26%]