
 Login Sign Up


| |||||
 |  | ||||

| 12Stocks.com Market Intelligence |
Best MidCap Stocks
|
| In a hurry? Mid Cap Stocks Lists: Performance Trends Table, Stock Charts
Sort midcap stocks: Daily, Weekly, Year-to-Date, Market Cap & Trends. Filter midcap stocks list by sector: Show all, Tech, Finance, Energy, Staples, Retail, Industrial, Materials, Utilities and HealthCare Filter midcap stocks list by size:All MidCap Large Mid-Range Small |
| 12Stocks.com Mid Cap Stocks Performances & Trends Daily | |||||||||
|
|  The overall Smart Investing & Trading Score is 63 (0-bearish to 100-bullish) which puts Mid Cap index in short term neutral to bullish trend. The Smart Investing & Trading Score from previous trading session is 44 and an improvement of trend continues.
| ||||||||
Here are the Smart Investing & Trading Scores of the most requested mid cap stocks at 12Stocks.com (click stock name for detailed review):
|


| 12Stocks.com: Top Performing Mid Cap Index Stocks | ||||||||||||||||||||||||||||||||||||||||||||||||
 The top performing Mid Cap Index stocks year to date are
Now, more recently, over last week, the top performing Mid Cap Index stocks on the move are


|
||||||||||||||||||||||||||||||||||||||||||||||||
| 12Stocks.com: Investing in Midcap Index with Stocks | |
|
The following table helps investors and traders sort through current performance and trends (as measured by Smart Investing & Trading Score) of various
stocks in the Midcap Index. Quick View: Move mouse or cursor over stock symbol (ticker) to view short-term technical chart and over stock name to view long term chart. Click on  to add stock symbol to your watchlist and to add stock symbol to your watchlist and  to view watchlist. Click on any ticker or stock name for detailed market intelligence report for that stock. to view watchlist. Click on any ticker or stock name for detailed market intelligence report for that stock. |
12Stocks.com Performance of Stocks in Midcap Index
| Ticker | Stock Name | Watchlist | Category | Recent Price | Smart Investing & Trading Score | Change % | Weekly Change% |
| CFG | Citizens Financial |   | Financials | 34.97 | 95 | 1.22% | 2.88% |
| LAMR | Lamar Advertising | | Financials | 114.64 | 83 | 0.82% | 2.87% |
| RJF | Raymond James | | Financials | 127.14 | 75 | 1.32% | 2.86% |
| LCID | Lucid | | Services & Goods | 2.52 | 59 | 6.11% | 2.86% |
| IONS | Ionis | | Health Care | 41.84 | 49 | 1.87% | 2.85% |
| FAF | First American | | Financials | 58.18 | 59 | 1.89% | 2.83% |
| CGNX | Cognex | | Technology | 39.54 | 68 | 0.94% | 2.81% |
| IBKR | Interactive Brokers | | Financials | 114.69 | 90 | 1.39% | 2.81% |
| BLD | TopBuild | | Industrials | 395.13 | 58 | 2.72% | 2.81% |
| FLS | Flowserve | | Industrials | 47.08 | 68 | 2.26% | 2.79% |
| MRVL | Marvell | | Technology | 63.86 | 17 | 1.56% | 2.78% |
| KNSL | Kinsale Capital | | Financials | 464.36 | 80 | 0.24% | 2.78% |
| BILL | Bill.com | | Technology | 61.26 | 45 | 1.07% | 2.77% |
| SMG | Scotts Miracle-Gro | | Materials | 68.58 | 68 | 1.02% | 2.76% |
| ADT | ADT | | Services & Goods | 6.36 | 42 | 1.27% | 2.75% |
| TRGP | Targa Resources | | Energy | 116.01 | 68 | 1.93% | 2.74% |
| OLLI | Ollie s | | Services & Goods | 75.22 | 90 | 2.06% | 2.74% |
| OLED | Universal Display | | Technology | 153.90 | 35 | 1.10% | 2.73% |
| GDDY | GoDaddy | | Technology | 123.40 | 63 | 1.64% | 2.73% |
| ARW | Arrow Electronics | | Services & Goods | 125.02 | 75 | 1.41% | 2.72% |
| CRUS | Cirrus Logic | | Technology | 84.25 | 68 | -0.26% | 2.72% |
| RBLX | Roblox | | Services & Goods | 36.30 | 35 | 3.83% | 2.72% |
| AXON | Axovant Sciences | | Health Care | 301.56 | 58 | 2.64% | 2.71% |
| CPRT | Copart | | Services & Goods | 54.31 | 58 | 1.89% | 2.70% |
| EEFT | Euronet Worldwide | | Services & Goods | 105.81 | 75 | 1.85% | 2.69% |
| For chart view version of above stock list: Chart View ➞ 0 - 25 , 25 - 50 , 50 - 75 , 75 - 100 , 100 - 125 , 125 - 150 , 150 - 175 , 175 - 200 , 200 - 225 , 225 - 250 , 250 - 275 , 275 - 300 , 300 - 325 , 325 - 350 , 350 - 375 , 375 - 400 , 400 - 425 , 425 - 450 , 450 - 475 , 475 - 500 , 500 - 525 , 525 - 550 , 550 - 575 , 575 - 600 , 600 - 625 , 625 - 650 , 650 - 675 , 675 - 700 , 700 - 725 , 725 - 750 , 750 - 775 | ||
 | Click To Change The Sort Order: By Market Cap or Company Size Performance: Year-to-date, Week and Day |  |
|
Get the most comprehensive stock market coverage daily at 12Stocks.com ➞ Best Stocks Today ➞ Best Stocks Weekly ➞ Best Stocks Year-to-Date ➞ Best Stocks Trends ➞  Best Stocks Today 12Stocks.com Best Nasdaq Stocks ➞ Best S&P 500 Stocks ➞ Best Tech Stocks ➞ Best Biotech Stocks ➞ |
| Detailed Overview of Midcap Stocks |
| Midcap Technical Overview, Leaders & Laggards, Top Midcap ETF Funds & Detailed Midcap Stocks List, Charts, Trends & More |
| Midcap: Technical Analysis, Trends & YTD Performance | |
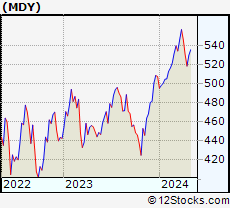
| MidCap segment as represented by
MDY, an exchange-traded fund [ETF], holds basket of about four hundred midcap stocks from across all major sectors of the US stock market. The midcap index (contains stocks like Green Mountain Coffee Roasters and Tractor Supply Company) is up by 4.42% and is currently underperforming the overall market by -1.22% year-to-date. Below is a quick view of technical charts and trends: | |
 MDY Weekly Chart |
|
| Long Term Trend: Very Good | |
| Medium Term Trend: Not Good | |
 MDY Daily Chart |
|
| Short Term Trend: Very Good | |
| Overall Trend Score: 63 | |
| YTD Performance: 4.42% | |
| **Trend Scores & Views Are Only For Educational Purposes And Not For Investing | |
| 12Stocks.com: Investing in Midcap Index using Exchange Traded Funds | |
|
The following table shows list of key exchange traded funds (ETF) that
help investors track Midcap index. The following list also includes leveraged ETF funds that track twice or thrice the daily returns of Midcap indices. Short or inverse ETF funds move in the opposite direction to the index they track and are useful during market pullbacks or during bear markets. Quick View: Move mouse or cursor over ETF symbol (ticker) to view short-term technical chart and over ETF name to view long term chart. Click on ticker or stock name for detailed view. Click on to add stock symbol to your watchlist and to view watchlist. |
12Stocks.com List of ETFs that track Midcap Index
| Ticker | ETF Name | Watchlist | Recent Price | Smart Investing & Trading Score | Change % | Week % | Year-to-date % |
| IJH | iShares Core S&P Mid-Cap | | 57.85 | 68 | 1.82 | 2.24 | 4.37% |
| IWS | iShares Russell Mid-Cap Value | | 119.86 | 68 | 0.89 | 1.88 | 3.07% |
| IWP | iShares Russell Mid-Cap Growth | | 108.63 | 58 | 1.80 | 2.77 | 3.99% |
| IWR | iShares Russell Mid-Cap | | 80.37 | 63 | 1.25 | 2.17 | 3.4% |
| MDY | SPDR S&P MidCap 400 ETF | | 529.80 | 63 | 1.20 | 2.22 | 4.42% |
| IJK | iShares S&P Mid-Cap 400 Growth | | 86.93 | 63 | 1.58 | 2.45 | 9.73% |
| IJJ | iShares S&P Mid-Cap 400 Value | | 112.47 | 63 | 0.83 | 1.74 | -1.38% |
| XMLV | PowerShares S&P MidCap Low Volatil ETF | | 54.91 | 75 | 0.68 | 1.38 | 3.25% |
| UMDD | ProShares UltraPro MidCap400 | | 24.11 | 63 | 4.06 | 6.86 | 8.02% |
| SMDD | ProShares UltraPro Short MidCap400 | | 11.65 | 32 | -3.79 | -7.26 | -13.46% |
| MVV | ProShares Ultra MidCap400 | | 61.54 | 68 | 2.07 | 4.31 | 6.31% |
| MZZ | ProShares UltraShort MidCap400 | | 11.66 | 27 | -2.51 | -4.2 | -7.24% |
| MYY | ProShares Short MidCap400 | | 20.74 | 32 | -1.09 | -2.12 | -3.33% |
| 12Stocks.com: Charts, Trends, Fundamental Data and Performances of MidCap Stocks | |
|
We now take in-depth look at all MidCap stocks including charts, multi-period performances and overall trends (as measured by Smart Investing & Trading Score). One can sort MidCap stocks (click link to choose) by Daily, Weekly and by Year-to-Date performances. Also, one can sort by size of the company or by market capitalization. |
| Select Your Default Chart Type: | |||||
| |||||
| Click on stock symbol or name for detailed view. Click on to add stock symbol to your watchlist and to view watchlist. Quick View: Move mouse or cursor over "Daily" to quickly view daily technical stock chart and over "Weekly" to view weekly technical stock chart. | |||||

 | CFG Citizens Financial Group, Inc. |
| Sector: Financials | |
| SubSector: Regional - Mid-Atlantic Banks | |
| MarketCap: 8225.19 Millions | |
| Recent Price: 34.97 Smart Investing & Trading Score: 95 | |
| Day Percent Change: 1.22% Day Change: 0.42 | |
| Week Change: 2.88% Year-to-date Change: 5.5% | |
| CFG Links: Profile News Message Board | |
| Charts:- Daily , Weekly | |
| Add CFG to Watchlist: View: Get Complete CFG Trend Analysis ➞ | |
 | LAMR Lamar Advertising Company (REIT) |
| Sector: Financials | |
| SubSector: REIT - Diversified | |
| MarketCap: 4838.33 Millions | |
| Recent Price: 114.64 Smart Investing & Trading Score: 83 | |
| Day Percent Change: 0.82% Day Change: 0.93 | |
| Week Change: 2.87% Year-to-date Change: 7.9% | |
| LAMR Links: Profile News Message Board | |
| Charts:- Daily , Weekly | |
| Add LAMR to Watchlist: View: Get Complete LAMR Trend Analysis ➞ | |
 | RJF Raymond James Financial, Inc. |
| Sector: Financials | |
| SubSector: Investment Brokerage - Regional | |
| MarketCap: 9490.65 Millions | |
| Recent Price: 127.14 Smart Investing & Trading Score: 75 | |
| Day Percent Change: 1.32% Day Change: 1.66 | |
| Week Change: 2.86% Year-to-date Change: 14.0% | |
| RJF Links: Profile News Message Board | |
| Charts:- Daily , Weekly | |
| Add RJF to Watchlist: View: Get Complete RJF Trend Analysis ➞ | |
 | LCID Lucid Group, Inc. |
| Sector: Services & Goods | |
| SubSector: Auto Manufacturers | |
| MarketCap: 12910 Millions | |
| Recent Price: 2.52 Smart Investing & Trading Score: 59 | |
| Day Percent Change: 6.11% Day Change: 0.15 | |
| Week Change: 2.86% Year-to-date Change: -39.6% | |
| LCID Links: Profile News Message Board | |
| Charts:- Daily , Weekly | |
| Add LCID to Watchlist: View: Get Complete LCID Trend Analysis ➞ | |
 | IONS Ionis Pharmaceuticals, Inc. |
| Sector: Health Care | |
| SubSector: Biotechnology | |
| MarketCap: 6725.05 Millions | |
| Recent Price: 41.84 Smart Investing & Trading Score: 49 | |
| Day Percent Change: 1.87% Day Change: 0.77 | |
| Week Change: 2.85% Year-to-date Change: -17.3% | |
| IONS Links: Profile News Message Board | |
| Charts:- Daily , Weekly | |
| Add IONS to Watchlist: View: Get Complete IONS Trend Analysis ➞ | |
 | FAF First American Financial Corporation |
| Sector: Financials | |
| SubSector: Property & Casualty Insurance | |
| MarketCap: 4163.82 Millions | |
| Recent Price: 58.18 Smart Investing & Trading Score: 59 | |
| Day Percent Change: 1.89% Day Change: 1.08 | |
| Week Change: 2.83% Year-to-date Change: -9.7% | |
| FAF Links: Profile News Message Board | |
| Charts:- Daily , Weekly | |
| Add FAF to Watchlist: View: Get Complete FAF Trend Analysis ➞ | |
 | CGNX Cognex Corporation |
| Sector: Technology | |
| SubSector: Scientific & Technical Instruments | |
| MarketCap: 7373.13 Millions | |
| Recent Price: 39.54 Smart Investing & Trading Score: 68 | |
| Day Percent Change: 0.94% Day Change: 0.37 | |
| Week Change: 2.81% Year-to-date Change: -5.3% | |
| CGNX Links: Profile News Message Board | |
| Charts:- Daily , Weekly | |
| Add CGNX to Watchlist: View: Get Complete CGNX Trend Analysis ➞ | |
 | IBKR Interactive Brokers Group, Inc. |
| Sector: Financials | |
| SubSector: Investment Brokerage - National | |
| MarketCap: 16975.7 Millions | |
| Recent Price: 114.69 Smart Investing & Trading Score: 90 | |
| Day Percent Change: 1.39% Day Change: 1.57 | |
| Week Change: 2.81% Year-to-date Change: 38.4% | |
| IBKR Links: Profile News Message Board | |
| Charts:- Daily , Weekly | |
| Add IBKR to Watchlist: View: Get Complete IBKR Trend Analysis ➞ | |
 | BLD TopBuild Corp. |
| Sector: Industrials | |
| SubSector: General Building Materials | |
| MarketCap: 2534.53 Millions | |
| Recent Price: 395.13 Smart Investing & Trading Score: 58 | |
| Day Percent Change: 2.72% Day Change: 10.47 | |
| Week Change: 2.81% Year-to-date Change: 5.6% | |
| BLD Links: Profile News Message Board | |
| Charts:- Daily , Weekly | |
| Add BLD to Watchlist: View: Get Complete BLD Trend Analysis ➞ | |
 | FLS Flowserve Corporation |
| Sector: Industrials | |
| SubSector: Diversified Machinery | |
| MarketCap: 2974.66 Millions | |
| Recent Price: 47.08 Smart Investing & Trading Score: 68 | |
| Day Percent Change: 2.26% Day Change: 1.04 | |
| Week Change: 2.79% Year-to-date Change: 14.2% | |
| FLS Links: Profile News Message Board | |
| Charts:- Daily , Weekly | |
| Add FLS to Watchlist: View: Get Complete FLS Trend Analysis ➞ | |
 | MRVL Marvell Technology Group Ltd. |
| Sector: Technology | |
| SubSector: Semiconductor - Integrated Circuits | |
| MarketCap: 14090.4 Millions | |
| Recent Price: 63.86 Smart Investing & Trading Score: 17 | |
| Day Percent Change: 1.56% Day Change: 0.98 | |
| Week Change: 2.78% Year-to-date Change: 5.9% | |
| MRVL Links: Profile News Message Board | |
| Charts:- Daily , Weekly | |
| Add MRVL to Watchlist: View: Get Complete MRVL Trend Analysis ➞ | |
 | KNSL Kinsale Capital Group, Inc. |
| Sector: Financials | |
| SubSector: Property & Casualty Insurance | |
| MarketCap: 2198.12 Millions | |
| Recent Price: 464.36 Smart Investing & Trading Score: 80 | |
| Day Percent Change: 0.24% Day Change: 1.13 | |
| Week Change: 2.78% Year-to-date Change: 38.7% | |
| KNSL Links: Profile News Message Board | |
| Charts:- Daily , Weekly | |
| Add KNSL to Watchlist: View: Get Complete KNSL Trend Analysis ➞ | |
 | BILL Bill.com Holdings, Inc. |
| Sector: Technology | |
| SubSector: Application Software | |
| MarketCap: 3068.42 Millions | |
| Recent Price: 61.26 Smart Investing & Trading Score: 45 | |
| Day Percent Change: 1.07% Day Change: 0.65 | |
| Week Change: 2.77% Year-to-date Change: -24.9% | |
| BILL Links: Profile News Message Board | |
| Charts:- Daily , Weekly | |
| Add BILL to Watchlist: View: Get Complete BILL Trend Analysis ➞ | |
 | SMG The Scotts Miracle-Gro Company |
| Sector: Materials | |
| SubSector: Agricultural Chemicals | |
| MarketCap: 5210.89 Millions | |
| Recent Price: 68.58 Smart Investing & Trading Score: 68 | |
| Day Percent Change: 1.02% Day Change: 0.69 | |
| Week Change: 2.76% Year-to-date Change: 7.6% | |
| SMG Links: Profile News Message Board | |
| Charts:- Daily , Weekly | |
| Add SMG to Watchlist: View: Get Complete SMG Trend Analysis ➞ | |
 | ADT ADT Inc. |
| Sector: Services & Goods | |
| SubSector: Security & Protection Services | |
| MarketCap: 2892.03 Millions | |
| Recent Price: 6.36 Smart Investing & Trading Score: 42 | |
| Day Percent Change: 1.27% Day Change: 0.08 | |
| Week Change: 2.75% Year-to-date Change: -6.7% | |
| ADT Links: Profile News Message Board | |
| Charts:- Daily , Weekly | |
| Add ADT to Watchlist: View: Get Complete ADT Trend Analysis ➞ | |
 | TRGP Targa Resources Corp. |
| Sector: Energy | |
| SubSector: Oil & Gas Pipelines | |
| MarketCap: 2210.65 Millions | |
| Recent Price: 116.01 Smart Investing & Trading Score: 68 | |
| Day Percent Change: 1.93% Day Change: 2.20 | |
| Week Change: 2.74% Year-to-date Change: 33.5% | |
| TRGP Links: Profile News Message Board | |
| Charts:- Daily , Weekly | |
| Add TRGP to Watchlist: View: Get Complete TRGP Trend Analysis ➞ | |
 | OLLI Ollie s Bargain Outlet Holdings, Inc. |
| Sector: Services & Goods | |
| SubSector: Discount, Variety Stores | |
| MarketCap: 2904.62 Millions | |
| Recent Price: 75.22 Smart Investing & Trading Score: 90 | |
| Day Percent Change: 2.06% Day Change: 1.52 | |
| Week Change: 2.74% Year-to-date Change: -0.9% | |
| OLLI Links: Profile News Message Board | |
| Charts:- Daily , Weekly | |
| Add OLLI to Watchlist: View: Get Complete OLLI Trend Analysis ➞ | |
 | OLED Universal Display Corporation |
| Sector: Technology | |
| SubSector: Semiconductor Equipment & Materials | |
| MarketCap: 5660.08 Millions | |
| Recent Price: 153.90 Smart Investing & Trading Score: 35 | |
| Day Percent Change: 1.10% Day Change: 1.68 | |
| Week Change: 2.73% Year-to-date Change: -19.5% | |
| OLED Links: Profile News Message Board | |
| Charts:- Daily , Weekly | |
| Add OLED to Watchlist: View: Get Complete OLED Trend Analysis ➞ | |
 | GDDY GoDaddy Inc. |
| Sector: Technology | |
| SubSector: Internet Software & Services | |
| MarketCap: 9570.51 Millions | |
| Recent Price: 123.40 Smart Investing & Trading Score: 63 | |
| Day Percent Change: 1.64% Day Change: 1.99 | |
| Week Change: 2.73% Year-to-date Change: 16.2% | |
| GDDY Links: Profile News Message Board | |
| Charts:- Daily , Weekly | |
| Add GDDY to Watchlist: View: Get Complete GDDY Trend Analysis ➞ | |
 | ARW Arrow Electronics, Inc. |
| Sector: Services & Goods | |
| SubSector: Electronics Wholesale | |
| MarketCap: 4155.03 Millions | |
| Recent Price: 125.02 Smart Investing & Trading Score: 75 | |
| Day Percent Change: 1.41% Day Change: 1.74 | |
| Week Change: 2.72% Year-to-date Change: 2.3% | |
| ARW Links: Profile News Message Board | |
| Charts:- Daily , Weekly | |
| Add ARW to Watchlist: View: Get Complete ARW Trend Analysis ➞ | |
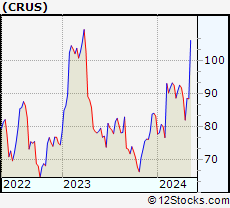 | CRUS Cirrus Logic, Inc. |
| Sector: Technology | |
| SubSector: Semiconductor - Specialized | |
| MarketCap: 3852.6 Millions | |
| Recent Price: 84.25 Smart Investing & Trading Score: 68 | |
| Day Percent Change: -0.26% Day Change: -0.22 | |
| Week Change: 2.72% Year-to-date Change: 1.3% | |
| CRUS Links: Profile News Message Board | |
| Charts:- Daily , Weekly | |
| Add CRUS to Watchlist: View: Get Complete CRUS Trend Analysis ➞ | |
 | RBLX Roblox Corporation |
| Sector: Services & Goods | |
| SubSector: Electronic Gaming & Multimedia | |
| MarketCap: 25420 Millions | |
| Recent Price: 36.30 Smart Investing & Trading Score: 35 | |
| Day Percent Change: 3.83% Day Change: 1.34 | |
| Week Change: 2.72% Year-to-date Change: -21.3% | |
| RBLX Links: Profile News Message Board | |
| Charts:- Daily , Weekly | |
| Add RBLX to Watchlist: View: Get Complete RBLX Trend Analysis ➞ | |
 | AXON Axovant Sciences Ltd. |
| Sector: Health Care | |
| SubSector: Biotechnology | |
| MarketCap: 1492.04 Millions | |
| Recent Price: 301.56 Smart Investing & Trading Score: 58 | |
| Day Percent Change: 2.64% Day Change: 7.76 | |
| Week Change: 2.71% Year-to-date Change: 16.7% | |
| AXON Links: Profile News Message Board | |
| Charts:- Daily , Weekly | |
| Add AXON to Watchlist: View: Get Complete AXON Trend Analysis ➞ | |
 | CPRT Copart, Inc. |
| Sector: Services & Goods | |
| SubSector: Auto Dealerships | |
| MarketCap: 15462.1 Millions | |
| Recent Price: 54.31 Smart Investing & Trading Score: 58 | |
| Day Percent Change: 1.89% Day Change: 1.01 | |
| Week Change: 2.7% Year-to-date Change: 10.8% | |
| CPRT Links: Profile News Message Board | |
| Charts:- Daily , Weekly | |
| Add CPRT to Watchlist: View: Get Complete CPRT Trend Analysis ➞ | |
 | EEFT Euronet Worldwide, Inc. |
| Sector: Services & Goods | |
| SubSector: Business Services | |
| MarketCap: 4809.62 Millions | |
| Recent Price: 105.81 Smart Investing & Trading Score: 75 | |
| Day Percent Change: 1.85% Day Change: 1.92 | |
| Week Change: 2.69% Year-to-date Change: 4.3% | |
| EEFT Links: Profile News Message Board | |
| Charts:- Daily , Weekly | |
| Add EEFT to Watchlist: View: Get Complete EEFT Trend Analysis ➞ | |
| For tabular summary view of above stock list: Summary View ➞ 0 - 25 , 25 - 50 , 50 - 75 , 75 - 100 , 100 - 125 , 125 - 150 , 150 - 175 , 175 - 200 , 200 - 225 , 225 - 250 , 250 - 275 , 275 - 300 , 300 - 325 , 325 - 350 , 350 - 375 , 375 - 400 , 400 - 425 , 425 - 450 , 450 - 475 , 475 - 500 , 500 - 525 , 525 - 550 , 550 - 575 , 575 - 600 , 600 - 625 , 625 - 650 , 650 - 675 , 675 - 700 , 700 - 725 , 725 - 750 , 750 - 775 | ||
| Click To Change The Sort Order: By Market Cap or Company Size Performance: Year-to-date, Week and Day | |
| Select Chart Type: | ||
|
Best Stocks Today 12Stocks.com |
© 2024 12Stocks.com Terms & Conditions Privacy Contact Us
All Information Provided Only For Education And Not To Be Used For Investing or Trading. See Terms & Conditions


One More Thing ... Get Best Stocks Delivered Daily!
Never Ever Miss A Move With Our Top Ten Stocks Lists
Find Best Stocks In Any Market - Bull or Bear Market
Take A Peek At Our Top Ten Stocks Lists: Daily, Weekly, Year-to-Date & Top Trends
Find Best Stocks In Any Market - Bull or Bear Market
Take A Peek At Our Top Ten Stocks Lists: Daily, Weekly, Year-to-Date & Top Trends
Midcap Stocks With Best Up Trends [0-bearish to 100-bullish]: HashiCorp [100], Ryder System[100], Quest Diagnostics[100], Hasbro [100], RLI [100], Popular [100], BioMarin Pharmaceutical[100], SLM [100], Kirby [100], Highwoods Properties[100], HEICO [100]
Best Midcap Stocks Year-to-Date:
AppLovin [78.89%], Vistra Energy[77.7%], ShockWave Medical[72.41%], Spotify [61.41%], Constellation Energy[60.75%], EMCOR [56.93%], Natera [45.34%], Pure Storage[45.26%], Wingstop [42.15%], Williams-Sonoma [41.28%], CAVA [40.73%] Best Midcap Stocks This Week:
HashiCorp [22.53%], Tandem Diabetes[14.92%], Globe Life[13.52%], Ryder System[12.23%], Coinbase Global[12.04%], MongoDB [11.91%], Spotify [9.96%], Kohl s[9.53%], Medpace [9.49%], Repligen [9%], GitLab [8.91%] Best Midcap Stocks Daily:
HashiCorp [19.54%], Globe Life[14.11%], Ryder System[11.94%], Spotify [11.41%], Tandem Diabetes[10.11%], Repligen [8.76%], Medpace [8.21%], Viasat [7.99%], MongoDB [7.69%], GitLab [6.80%], Lucid [6.11%]