
 Login Sign Up


| |||||
 |  | ||||

| 12Stocks.com Market Intelligence |
Best MidCap Stocks
|
| In a hurry? Mid Cap Stocks Lists: Performance Trends Table, Stock Charts
Sort midcap stocks: Daily, Weekly, Year-to-Date, Market Cap & Trends. Filter midcap stocks list by sector: Show all, Tech, Finance, Energy, Staples, Retail, Industrial, Materials, Utilities and HealthCare Filter midcap stocks list by size:All MidCap Large Mid-Range Small |
| 12Stocks.com Mid Cap Stocks Performances & Trends Daily | |||||||||
|
|  The overall Smart Investing & Trading Score is 44 (0-bearish to 100-bullish) which puts Mid Cap index in short term neutral trend. The Smart Investing & Trading Score from previous trading session is 36 and hence an improvement of trend.
| ||||||||
Here are the Smart Investing & Trading Scores of the most requested mid cap stocks at 12Stocks.com (click stock name for detailed review):
|


| 12Stocks.com: Top Performing Mid Cap Index Stocks | ||||||||||||||||||||||||||||||||||||||||||||||||
 The top performing Mid Cap Index stocks year to date are
Now, more recently, over last week, the top performing Mid Cap Index stocks on the move are


|
||||||||||||||||||||||||||||||||||||||||||||||||
| 12Stocks.com: Investing in Midcap Index with Stocks | |
|
The following table helps investors and traders sort through current performance and trends (as measured by Smart Investing & Trading Score) of various
stocks in the Midcap Index. Quick View: Move mouse or cursor over stock symbol (ticker) to view short-term technical chart and over stock name to view long term chart. Click on  to add stock symbol to your watchlist and to add stock symbol to your watchlist and  to view watchlist. Click on any ticker or stock name for detailed market intelligence report for that stock. to view watchlist. Click on any ticker or stock name for detailed market intelligence report for that stock. |
12Stocks.com Performance of Stocks in Midcap Index
| Ticker | Stock Name | Watchlist | Category | Recent Price | Smart Investing & Trading Score | Change % | Weekly Change% |
| LNG | Cheniere Energy |   | Energy | 161.97 | 67 | 0.96% | 3.30% |
| ACGL | Arch Capital | | Financials | 92.93 | 76 | 1.69% | 3.28% |
| CFR | Cullen/Frost Bankers | | Financials | 111.55 | 78 | 2.26% | 3.28% |
| CMS | CMS Energy | | Utilities | 59.55 | 85 | 1.83% | 3.28% |
| WEC | WEC Energy | | Utilities | 81.56 | 86 | 1.39% | 3.28% |
| CHD | Church & Dwight Co | | Consumer Staples | 104.35 | 88 | 1.11% | 3.24% |
| TSCO | Tractor Supply | | Services & Goods | 252.79 | 68 | 2.20% | 3.23% |
| INGR | Ingredion | | Consumer Staples | 113.62 | 58 | 1.15% | 3.15% |
| WTRG | Essential Utilities | | Utilities | 35.44 | 42 | 0.80% | 3.14% |
| AGR | Avangrid | | Utilities | 36.87 | 95 | 1.74% | 3.13% |
| LBRDA | Liberty Broadband | | Technology | 50.12 | 42 | 2.04% | 3.11% |
| FHN | First Horizon | | Financials | 14.63 | 68 | 2.45% | 3.03% |
| MKC | McCormick & | | Consumer Staples | 73.92 | 73 | 1.68% | 3.01% |
| PNW | Pinnacle West | | Utilities | 74.40 | 86 | 1.96% | 2.99% |
| SSRM | SSR Mining | | Materials | 5.34 | 62 | 3.99% | 2.99% |
| AEE | Ameren | | Utilities | 73.88 | 86 | 1.89% | 2.95% |
| CAH | Cardinal Health | | Services & Goods | 108.19 | 32 | 2.07% | 2.94% |
| NCLH | Norwegian Cruise | | Services & Goods | 18.29 | 51 | 0.66% | 2.93% |
| XEL | Xcel Energy | | Utilities | 54.72 | 74 | 1.79% | 2.92% |
| SYF | Synchrony Financial | | Financials | 41.57 | 68 | 1.89% | 2.87% |
| UA | Under Armour | | Services & Goods | 6.47 | 42 | 1.73% | 2.86% |
| ATO | Atmos Energy | | Utilities | 117.20 | 78 | 2.30% | 2.82% |
| ELS | Equity LifeStyle | | Financials | 62.73 | 42 | 0.64% | 2.79% |
| HEI | HEICO | | Industrials | 197.10 | 81 | 0.22% | 2.78% |
| LBRDK | Liberty Broadband | | Services & Goods | 49.88 | 42 | 2.09% | 2.68% |
| For chart view version of above stock list: Chart View ➞ 0 - 25 , 25 - 50 , 50 - 75 , 75 - 100 , 100 - 125 , 125 - 150 , 150 - 175 , 175 - 200 , 200 - 225 , 225 - 250 , 250 - 275 , 275 - 300 , 300 - 325 , 325 - 350 , 350 - 375 , 375 - 400 , 400 - 425 , 425 - 450 , 450 - 475 , 475 - 500 , 500 - 525 , 525 - 550 , 550 - 575 , 575 - 600 , 600 - 625 , 625 - 650 , 650 - 675 , 675 - 700 , 700 - 725 , 725 - 750 , 750 - 775 | ||
 | Click To Change The Sort Order: By Market Cap or Company Size Performance: Year-to-date, Week and Day |  |
|
Get the most comprehensive stock market coverage daily at 12Stocks.com ➞ Best Stocks Today ➞ Best Stocks Weekly ➞ Best Stocks Year-to-Date ➞ Best Stocks Trends ➞  Best Stocks Today 12Stocks.com Best Nasdaq Stocks ➞ Best S&P 500 Stocks ➞ Best Tech Stocks ➞ Best Biotech Stocks ➞ |
| Detailed Overview of Midcap Stocks |
| Midcap Technical Overview, Leaders & Laggards, Top Midcap ETF Funds & Detailed Midcap Stocks List, Charts, Trends & More |
| Midcap: Technical Analysis, Trends & YTD Performance | |
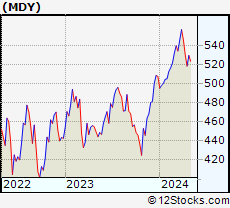
| MidCap segment as represented by
MDY, an exchange-traded fund [ETF], holds basket of about four hundred midcap stocks from across all major sectors of the US stock market. The midcap index (contains stocks like Green Mountain Coffee Roasters and Tractor Supply Company) is up by 2.15% and is currently underperforming the overall market by -1.23% year-to-date. Below is a quick view of technical charts and trends: | |
 MDY Weekly Chart |
|
| Long Term Trend: Good | |
| Medium Term Trend: Not Good | |
 MDY Daily Chart |
|
| Short Term Trend: Deteriorating | |
| Overall Trend Score: 44 | |
| YTD Performance: 2.15% | |
| **Trend Scores & Views Are Only For Educational Purposes And Not For Investing | |
| 12Stocks.com: Investing in Midcap Index using Exchange Traded Funds | |
|
The following table shows list of key exchange traded funds (ETF) that
help investors track Midcap index. The following list also includes leveraged ETF funds that track twice or thrice the daily returns of Midcap indices. Short or inverse ETF funds move in the opposite direction to the index they track and are useful during market pullbacks or during bear markets. Quick View: Move mouse or cursor over ETF symbol (ticker) to view short-term technical chart and over ETF name to view long term chart. Click on ticker or stock name for detailed view. Click on to add stock symbol to your watchlist and to view watchlist. |
12Stocks.com List of ETFs that track Midcap Index
| Ticker | ETF Name | Watchlist | Recent Price | Smart Investing & Trading Score | Change % | Week % | Year-to-date % |
| IJH | iShares Core S&P Mid-Cap | | 56.58 | 36 | 0.27 | -2.26 | 2.07% |
| IWR | iShares Russell Mid-Cap | | 78.66 | 36 | -0.06 | -2.43 | 1.2% |
| IWP | iShares Russell Mid-Cap Growth | | 105.70 | 36 | -0.75 | -3.77 | 1.19% |
| MDY | SPDR S&P MidCap 400 ETF | | 518.28 | 44 | 0.33 | -2.2 | 2.15% |
| IWS | iShares Russell Mid-Cap Value | | 117.65 | 41 | 0.29 | -1.87 | 1.17% |
| IJK | iShares S&P Mid-Cap 400 Growth | | 84.85 | 36 | -0.21 | -3.01 | 7.11% |
| IJJ | iShares S&P Mid-Cap 400 Value | | 110.55 | 17 | 1.00 | -1.29 | -3.06% |
| XMLV | PowerShares S&P MidCap Low Volatil ETF | | 54.16 | 53 | 1.06 | -0.17 | 1.84% |
| MVV | ProShares Ultra MidCap400 | | 59.00 | 36 | 0.99 | -4.42 | 1.92% |
| SMDD | ProShares UltraPro Short MidCap400 | | 12.69 | 59 | -0.01 | 7.99 | -5.75% |
| MZZ | ProShares UltraShort MidCap400 | | 12.21 | 34 | -0.16 | 5.26 | -2.87% |
| UMDD | ProShares UltraPro MidCap400 | | 22.28 | 36 | -0.13 | -7.83 | -0.18% |
| MYY | ProShares Short MidCap400 | | 21.23 | 69 | -0.14 | 2.55 | -1.05% |
| 12Stocks.com: Charts, Trends, Fundamental Data and Performances of MidCap Stocks | |
|
We now take in-depth look at all MidCap stocks including charts, multi-period performances and overall trends (as measured by Smart Investing & Trading Score). One can sort MidCap stocks (click link to choose) by Daily, Weekly and by Year-to-Date performances. Also, one can sort by size of the company or by market capitalization. |
| Select Your Default Chart Type: | |||||
| |||||
| Click on stock symbol or name for detailed view. Click on to add stock symbol to your watchlist and to view watchlist. Quick View: Move mouse or cursor over "Daily" to quickly view daily technical stock chart and over "Weekly" to view weekly technical stock chart. | |||||

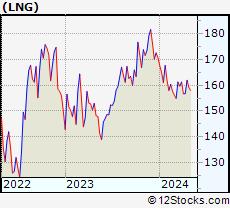 | LNG Cheniere Energy, Inc. |
| Sector: Energy | |
| SubSector: Oil & Gas Pipelines | |
| MarketCap: 9905.15 Millions | |
| Recent Price: 161.97 Smart Investing & Trading Score: 67 | |
| Day Percent Change: 0.96% Day Change: 1.54 | |
| Week Change: 3.3% Year-to-date Change: -5.1% | |
| LNG Links: Profile News Message Board | |
| Charts:- Daily , Weekly | |
| Add LNG to Watchlist: View: Get Complete LNG Trend Analysis ➞ | |
 | ACGL Arch Capital Group Ltd. |
| Sector: Financials | |
| SubSector: Property & Casualty Insurance | |
| MarketCap: 12350.9 Millions | |
| Recent Price: 92.93 Smart Investing & Trading Score: 76 | |
| Day Percent Change: 1.69% Day Change: 1.54 | |
| Week Change: 3.28% Year-to-date Change: 25.1% | |
| ACGL Links: Profile News Message Board | |
| Charts:- Daily , Weekly | |
| Add ACGL to Watchlist: View: Get Complete ACGL Trend Analysis ➞ | |
 | CFR Cullen/Frost Bankers, Inc. |
| Sector: Financials | |
| SubSector: Regional - Southwest Banks | |
| MarketCap: 3536.75 Millions | |
| Recent Price: 111.55 Smart Investing & Trading Score: 78 | |
| Day Percent Change: 2.26% Day Change: 2.46 | |
| Week Change: 3.28% Year-to-date Change: 2.8% | |
| CFR Links: Profile News Message Board | |
| Charts:- Daily , Weekly | |
| Add CFR to Watchlist: View: Get Complete CFR Trend Analysis ➞ | |
 | CMS CMS Energy Corporation |
| Sector: Utilities | |
| SubSector: Electric Utilities | |
| MarketCap: 15105.8 Millions | |
| Recent Price: 59.55 Smart Investing & Trading Score: 85 | |
| Day Percent Change: 1.83% Day Change: 1.07 | |
| Week Change: 3.28% Year-to-date Change: 2.6% | |
| CMS Links: Profile News Message Board | |
| Charts:- Daily , Weekly | |
| Add CMS to Watchlist: View: Get Complete CMS Trend Analysis ➞ | |
 | WEC WEC Energy Group, Inc. |
| Sector: Utilities | |
| SubSector: Electric Utilities | |
| MarketCap: 24852 Millions | |
| Recent Price: 81.56 Smart Investing & Trading Score: 86 | |
| Day Percent Change: 1.39% Day Change: 1.12 | |
| Week Change: 3.28% Year-to-date Change: -3.1% | |
| WEC Links: Profile News Message Board | |
| Charts:- Daily , Weekly | |
| Add WEC to Watchlist: View: Get Complete WEC Trend Analysis ➞ | |
 | CHD Church & Dwight Co., Inc. |
| Sector: Consumer Staples | |
| SubSector: Cleaning Products | |
| MarketCap: 17425.7 Millions | |
| Recent Price: 104.35 Smart Investing & Trading Score: 88 | |
| Day Percent Change: 1.11% Day Change: 1.15 | |
| Week Change: 3.24% Year-to-date Change: 10.4% | |
| CHD Links: Profile News Message Board | |
| Charts:- Daily , Weekly | |
| Add CHD to Watchlist: View: Get Complete CHD Trend Analysis ➞ | |
 | TSCO Tractor Supply Company |
| Sector: Services & Goods | |
| SubSector: Specialty Retail, Other | |
| MarketCap: 9692.94 Millions | |
| Recent Price: 252.79 Smart Investing & Trading Score: 68 | |
| Day Percent Change: 2.20% Day Change: 5.44 | |
| Week Change: 3.23% Year-to-date Change: 17.6% | |
| TSCO Links: Profile News Message Board | |
| Charts:- Daily , Weekly | |
| Add TSCO to Watchlist: View: Get Complete TSCO Trend Analysis ➞ | |
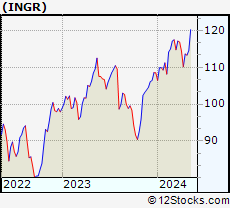 | INGR Ingredion Incorporated |
| Sector: Consumer Staples | |
| SubSector: Processed & Packaged Goods | |
| MarketCap: 5064.18 Millions | |
| Recent Price: 113.62 Smart Investing & Trading Score: 58 | |
| Day Percent Change: 1.15% Day Change: 1.29 | |
| Week Change: 3.15% Year-to-date Change: 4.7% | |
| INGR Links: Profile News Message Board | |
| Charts:- Daily , Weekly | |
| Add INGR to Watchlist: View: Get Complete INGR Trend Analysis ➞ | |
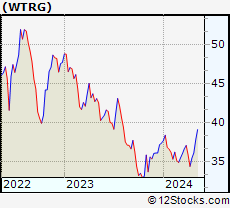 | WTRG Essential Utilities, Inc. |
| Sector: Utilities | |
| SubSector: Water Utilities | |
| MarketCap: 8485.22 Millions | |
| Recent Price: 35.44 Smart Investing & Trading Score: 42 | |
| Day Percent Change: 0.80% Day Change: 0.28 | |
| Week Change: 3.14% Year-to-date Change: -5.1% | |
| WTRG Links: Profile News Message Board | |
| Charts:- Daily , Weekly | |
| Add WTRG to Watchlist: View: Get Complete WTRG Trend Analysis ➞ | |
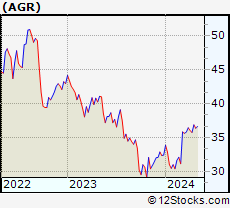 | AGR Avangrid, Inc. |
| Sector: Utilities | |
| SubSector: Gas Utilities | |
| MarketCap: 14337.3 Millions | |
| Recent Price: 36.87 Smart Investing & Trading Score: 95 | |
| Day Percent Change: 1.74% Day Change: 0.63 | |
| Week Change: 3.13% Year-to-date Change: 13.8% | |
| AGR Links: Profile News Message Board | |
| Charts:- Daily , Weekly | |
| Add AGR to Watchlist: View: Get Complete AGR Trend Analysis ➞ | |
 | LBRDA Liberty Broadband Corporation |
| Sector: Technology | |
| SubSector: CATV Systems | |
| MarketCap: 17001.5 Millions | |
| Recent Price: 50.12 Smart Investing & Trading Score: 42 | |
| Day Percent Change: 2.04% Day Change: 1.00 | |
| Week Change: 3.11% Year-to-date Change: -37.9% | |
| LBRDA Links: Profile News Message Board | |
| Charts:- Daily , Weekly | |
| Add LBRDA to Watchlist: View: Get Complete LBRDA Trend Analysis ➞ | |
 | FHN First Horizon National Corporation |
| Sector: Financials | |
| SubSector: Regional - Southeast Banks | |
| MarketCap: 2661.05 Millions | |
| Recent Price: 14.63 Smart Investing & Trading Score: 68 | |
| Day Percent Change: 2.45% Day Change: 0.35 | |
| Week Change: 3.03% Year-to-date Change: 3.3% | |
| FHN Links: Profile News Message Board | |
| Charts:- Daily , Weekly | |
| Add FHN to Watchlist: View: Get Complete FHN Trend Analysis ➞ | |
 | MKC McCormick & Company, Incorporated |
| Sector: Consumer Staples | |
| SubSector: Processed & Packaged Goods | |
| MarketCap: 18522.8 Millions | |
| Recent Price: 73.92 Smart Investing & Trading Score: 73 | |
| Day Percent Change: 1.68% Day Change: 1.22 | |
| Week Change: 3.01% Year-to-date Change: 8.0% | |
| MKC Links: Profile News Message Board | |
| Charts:- Daily , Weekly | |
| Add MKC to Watchlist: View: Get Complete MKC Trend Analysis ➞ | |
 | PNW Pinnacle West Capital Corporation |
| Sector: Utilities | |
| SubSector: Electric Utilities | |
| MarketCap: 8240.24 Millions | |
| Recent Price: 74.40 Smart Investing & Trading Score: 86 | |
| Day Percent Change: 1.96% Day Change: 1.43 | |
| Week Change: 2.99% Year-to-date Change: 3.6% | |
| PNW Links: Profile News Message Board | |
| Charts:- Daily , Weekly | |
| Add PNW to Watchlist: View: Get Complete PNW Trend Analysis ➞ | |
 | SSRM SSR Mining Inc. |
| Sector: Materials | |
| SubSector: Gold | |
| MarketCap: 1546.09 Millions | |
| Recent Price: 5.34 Smart Investing & Trading Score: 62 | |
| Day Percent Change: 3.99% Day Change: 0.21 | |
| Week Change: 2.99% Year-to-date Change: -50.3% | |
| SSRM Links: Profile News Message Board | |
| Charts:- Daily , Weekly | |
| Add SSRM to Watchlist: View: Get Complete SSRM Trend Analysis ➞ | |
 | AEE Ameren Corporation |
| Sector: Utilities | |
| SubSector: Electric Utilities | |
| MarketCap: 17308.2 Millions | |
| Recent Price: 73.88 Smart Investing & Trading Score: 86 | |
| Day Percent Change: 1.89% Day Change: 1.37 | |
| Week Change: 2.95% Year-to-date Change: 2.1% | |
| AEE Links: Profile News Message Board | |
| Charts:- Daily , Weekly | |
| Add AEE to Watchlist: View: Get Complete AEE Trend Analysis ➞ | |
 | CAH Cardinal Health, Inc. |
| Sector: Services & Goods | |
| SubSector: Drugs Wholesale | |
| MarketCap: 14509.9 Millions | |
| Recent Price: 108.19 Smart Investing & Trading Score: 32 | |
| Day Percent Change: 2.07% Day Change: 2.19 | |
| Week Change: 2.94% Year-to-date Change: 7.3% | |
| CAH Links: Profile News Message Board | |
| Charts:- Daily , Weekly | |
| Add CAH to Watchlist: View: Get Complete CAH Trend Analysis ➞ | |
 | NCLH Norwegian Cruise Line Holdings Ltd. |
| Sector: Services & Goods | |
| SubSector: Resorts & Casinos | |
| MarketCap: 2895.54 Millions | |
| Recent Price: 18.29 Smart Investing & Trading Score: 51 | |
| Day Percent Change: 0.66% Day Change: 0.12 | |
| Week Change: 2.93% Year-to-date Change: -8.7% | |
| NCLH Links: Profile News Message Board | |
| Charts:- Daily , Weekly | |
| Add NCLH to Watchlist: View: Get Complete NCLH Trend Analysis ➞ | |
 | XEL Xcel Energy Inc. |
| Sector: Utilities | |
| SubSector: Electric Utilities | |
| MarketCap: 28960.8 Millions | |
| Recent Price: 54.72 Smart Investing & Trading Score: 74 | |
| Day Percent Change: 1.79% Day Change: 0.96 | |
| Week Change: 2.92% Year-to-date Change: -11.6% | |
| XEL Links: Profile News Message Board | |
| Charts:- Daily , Weekly | |
| Add XEL to Watchlist: View: Get Complete XEL Trend Analysis ➞ | |
 | SYF Synchrony Financial |
| Sector: Financials | |
| SubSector: Credit Services | |
| MarketCap: 9297.28 Millions | |
| Recent Price: 41.57 Smart Investing & Trading Score: 68 | |
| Day Percent Change: 1.89% Day Change: 0.77 | |
| Week Change: 2.87% Year-to-date Change: 8.9% | |
| SYF Links: Profile News Message Board | |
| Charts:- Daily , Weekly | |
| Add SYF to Watchlist: View: Get Complete SYF Trend Analysis ➞ | |
 | UA Under Armour, Inc. |
| Sector: Services & Goods | |
| SubSector: Textile - Apparel Clothing | |
| MarketCap: 3926.93 Millions | |
| Recent Price: 6.47 Smart Investing & Trading Score: 42 | |
| Day Percent Change: 1.73% Day Change: 0.11 | |
| Week Change: 2.86% Year-to-date Change: -22.5% | |
| UA Links: Profile News Message Board | |
| Charts:- Daily , Weekly | |
| Add UA to Watchlist: View: Get Complete UA Trend Analysis ➞ | |
 | ATO Atmos Energy Corporation |
| Sector: Utilities | |
| SubSector: Gas Utilities | |
| MarketCap: 11449 Millions | |
| Recent Price: 117.20 Smart Investing & Trading Score: 78 | |
| Day Percent Change: 2.30% Day Change: 2.63 | |
| Week Change: 2.82% Year-to-date Change: 1.1% | |
| ATO Links: Profile News Message Board | |
| Charts:- Daily , Weekly | |
| Add ATO to Watchlist: View: Get Complete ATO Trend Analysis ➞ | |
 | ELS Equity LifeStyle Properties, Inc. |
| Sector: Financials | |
| SubSector: REIT - Residential | |
| MarketCap: 9570.61 Millions | |
| Recent Price: 62.73 Smart Investing & Trading Score: 42 | |
| Day Percent Change: 0.64% Day Change: 0.40 | |
| Week Change: 2.79% Year-to-date Change: -11.1% | |
| ELS Links: Profile News Message Board | |
| Charts:- Daily , Weekly | |
| Add ELS to Watchlist: View: Get Complete ELS Trend Analysis ➞ | |
 | HEI HEICO Corporation |
| Sector: Industrials | |
| SubSector: Aerospace/Defense Products & Services | |
| MarketCap: 10023.1 Millions | |
| Recent Price: 197.10 Smart Investing & Trading Score: 81 | |
| Day Percent Change: 0.22% Day Change: 0.44 | |
| Week Change: 2.78% Year-to-date Change: 10.2% | |
| HEI Links: Profile News Message Board | |
| Charts:- Daily , Weekly | |
| Add HEI to Watchlist: View: Get Complete HEI Trend Analysis ➞ | |
 | LBRDK Liberty Broadband Corporation |
| Sector: Services & Goods | |
| SubSector: Broadcasting - TV | |
| MarketCap: 13847.3 Millions | |
| Recent Price: 49.88 Smart Investing & Trading Score: 42 | |
| Day Percent Change: 2.09% Day Change: 1.02 | |
| Week Change: 2.68% Year-to-date Change: -38.1% | |
| LBRDK Links: Profile News Message Board | |
| Charts:- Daily , Weekly | |
| Add LBRDK to Watchlist: View: Get Complete LBRDK Trend Analysis ➞ | |
| For tabular summary view of above stock list: Summary View ➞ 0 - 25 , 25 - 50 , 50 - 75 , 75 - 100 , 100 - 125 , 125 - 150 , 150 - 175 , 175 - 200 , 200 - 225 , 225 - 250 , 250 - 275 , 275 - 300 , 300 - 325 , 325 - 350 , 350 - 375 , 375 - 400 , 400 - 425 , 425 - 450 , 450 - 475 , 475 - 500 , 500 - 525 , 525 - 550 , 550 - 575 , 575 - 600 , 600 - 625 , 625 - 650 , 650 - 675 , 675 - 700 , 700 - 725 , 725 - 750 , 750 - 775 | ||
| Click To Change The Sort Order: By Market Cap or Company Size Performance: Year-to-date, Week and Day | |
| Select Chart Type: | ||
|
Best Stocks Today 12Stocks.com |
© 2024 12Stocks.com Terms & Conditions Privacy Contact Us
All Information Provided Only For Education And Not To Be Used For Investing or Trading. See Terms & Conditions


One More Thing ... Get Best Stocks Delivered Daily!
Never Ever Miss A Move With Our Top Ten Stocks Lists
Find Best Stocks In Any Market - Bull or Bear Market
Take A Peek At Our Top Ten Stocks Lists: Daily, Weekly, Year-to-Date & Top Trends
Find Best Stocks In Any Market - Bull or Bear Market
Take A Peek At Our Top Ten Stocks Lists: Daily, Weekly, Year-to-Date & Top Trends
Midcap Stocks With Best Up Trends [0-bearish to 100-bullish]: UGI [100], Entergy [100], Bunge [100], Flowers Foods[100], Tyson Foods[100], Genuine Parts[100], Wendy s[100], Alaska Air[100], Consolidated Edison[100], Conagra [100], United Airlines[100]
Best Midcap Stocks Year-to-Date:
ShockWave Medical[72.66%], Vistra Energy[70.46%], AppLovin [67.86%], Constellation Energy[54.47%], EMCOR [52.55%], Spotify [46.79%], Pure Storage[38.7%], Williams-Sonoma [38.37%], CAVA [37.24%], Natera [36.14%], Coupang [35.86%] Best Midcap Stocks This Week:
United Airlines[22.92%], AMC Entertainment[19.25%], Globe Life[12.95%], Genuine Parts[11.7%], Advance Auto[11.62%], Iridium [11.07%], Medical Properties[10.78%], agilon health[10.3%], UGI [9.72%], Alaska Air[8.98%], Flowers Foods[8.66%] Best Midcap Stocks Daily:
AMC Entertainment[8.22%], UGI [8.20%], Hawaiian Electric[6.86%], Fifth Third[5.93%], Iridium [5.14%], agilon health[4.10%], SSR Mining[3.99%], Walgreens Boots[3.70%], Darling Ingredients[3.47%], Citizens Financial[3.31%], J. M.[3.29%]