
 Login Sign Up


| |||||
 |  | ||||

| 12Stocks.com Market Intelligence |
Best MidCap Stocks
|
| In a hurry? Mid Cap Stocks Lists: Performance Trends Table, Stock Charts
Sort midcap stocks: Daily, Weekly, Year-to-Date, Market Cap & Trends. Filter midcap stocks list by sector: Show all, Tech, Finance, Energy, Staples, Retail, Industrial, Materials, Utilities and HealthCare Filter midcap stocks list by size:All MidCap Large Mid-Range Small |
| 12Stocks.com Mid Cap Stocks Performances & Trends Daily | |||||||||
|
|  The overall Smart Investing & Trading Score is 49 (0-bearish to 100-bullish) which puts Mid Cap index in short term neutral trend. The Smart Investing & Trading Score from previous trading session is 63 and hence a deterioration of trend.
| ||||||||
Here are the Smart Investing & Trading Scores of the most requested mid cap stocks at 12Stocks.com (click stock name for detailed review):
|


| 12Stocks.com: Top Performing Mid Cap Index Stocks | ||||||||||||||||||||||||||||||||||||||||||||||||
 The top performing Mid Cap Index stocks year to date are
Now, more recently, over last week, the top performing Mid Cap Index stocks on the move are


|
||||||||||||||||||||||||||||||||||||||||||||||||
| 12Stocks.com: Investing in Midcap Index with Stocks | |
|
The following table helps investors and traders sort through current performance and trends (as measured by Smart Investing & Trading Score) of various
stocks in the Midcap Index. Quick View: Move mouse or cursor over stock symbol (ticker) to view short-term technical chart and over stock name to view long term chart. Click on  to add stock symbol to your watchlist and to add stock symbol to your watchlist and  to view watchlist. Click on any ticker or stock name for detailed market intelligence report for that stock. to view watchlist. Click on any ticker or stock name for detailed market intelligence report for that stock. |
12Stocks.com Performance of Stocks in Midcap Index
| Ticker | Stock Name | Watchlist | Category | Recent Price | Smart Investing & Trading Score | Change % | Weekly Change% |
| CTRA | Contura Energy |   | Materials | 28.20 | 88 | -0.90% | 1.64% |
| SPG | Simon Property | | Financials | 142.73 | 44 | -0.06% | 1.63% |
| GXO | GXO Logistics | | Industrials | 50.54 | 42 | 1.61% | 1.63% |
| TPL | Texas Pacific | | Financials | 592.02 | 49 | 0.51% | 1.62% |
| LFUS | Littelfuse | | Services & Goods | 230.39 | 52 | -1.37% | 1.61% |
| KEYS | Keysight Technologies | | Technology | 147.43 | 35 | 0.57% | 1.59% |
| HII | Huntington Ingalls | | Industrials | 275.98 | 51 | 0.05% | 1.59% |
| BK | Bank of New York | | Financials | 57.18 | 68 | -1.33% | 1.58% |
| OHI | Omega | | Financials | 30.90 | 65 | 0.72% | 1.58% |
| FITB | Fifth Third | | Financials | 36.82 | 81 | -1.10% | 1.57% |
| TSN | Tyson Foods | | Consumer Staples | 60.89 | 78 | -0.70% | 1.57% |
| CMS | CMS Energy | | Utilities | 60.48 | 93 | 0.33% | 1.56% |
| AWI | Armstrong World | | Industrials | 115.76 | 56 | -0.17% | 1.56% |
| OLLI | Ollie s | | Services & Goods | 74.35 | 83 | -0.48% | 1.56% |
| EQH | Equitable | | Financials | 37.13 | 53 | -2.47% | 1.56% |
| PRGO | Perrigo | | Health Care | 31.27 | 67 | 0.13% | 1.53% |
| NYT | New York | | Services & Goods | 43.25 | 50 | -0.12% | 1.53% |
| HRL | Hormel Foods | | Consumer Staples | 35.27 | 88 | -0.93% | 1.53% |
| WEC | WEC Energy | | Utilities | 82.81 | 100 | 0.22% | 1.53% |
| ANSS | ANSYS | | Technology | 327.04 | 31 | -0.47% | 1.53% |
| WWD | Woodward | | Industrials | 149.74 | 63 | 0.09% | 1.53% |
| DVN | Devon Energy | | Energy | 52.61 | 54 | 0.98% | 1.50% |
| BILL | Bill.com | | Technology | 60.50 | 30 | -1.48% | 1.49% |
| GLPI | Gaming and | | Financials | 43.43 | 42 | -0.05% | 1.47% |
| QDEL | Quidel | | Health Care | 39.69 | 42 | -2.77% | 1.46% |
| For chart view version of above stock list: Chart View ➞ 0 - 25 , 25 - 50 , 50 - 75 , 75 - 100 , 100 - 125 , 125 - 150 , 150 - 175 , 175 - 200 , 200 - 225 , 225 - 250 , 250 - 275 , 275 - 300 , 300 - 325 , 325 - 350 , 350 - 375 , 375 - 400 , 400 - 425 , 425 - 450 , 450 - 475 , 475 - 500 , 500 - 525 , 525 - 550 , 550 - 575 , 575 - 600 , 600 - 625 , 625 - 650 , 650 - 675 , 675 - 700 , 700 - 725 , 725 - 750 , 750 - 775 | ||
 | Click To Change The Sort Order: By Market Cap or Company Size Performance: Year-to-date, Week and Day |  |
|
Get the most comprehensive stock market coverage daily at 12Stocks.com ➞ Best Stocks Today ➞ Best Stocks Weekly ➞ Best Stocks Year-to-Date ➞ Best Stocks Trends ➞  Best Stocks Today 12Stocks.com Best Nasdaq Stocks ➞ Best S&P 500 Stocks ➞ Best Tech Stocks ➞ Best Biotech Stocks ➞ |
| Detailed Overview of Midcap Stocks |
| Midcap Technical Overview, Leaders & Laggards, Top Midcap ETF Funds & Detailed Midcap Stocks List, Charts, Trends & More |
| Midcap: Technical Analysis, Trends & YTD Performance | |
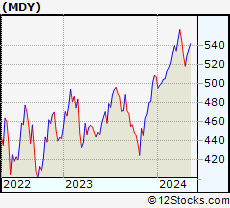
| MidCap segment as represented by
MDY, an exchange-traded fund [ETF], holds basket of about four hundred midcap stocks from across all major sectors of the US stock market. The midcap index (contains stocks like Green Mountain Coffee Roasters and Tractor Supply Company) is up by 4.04% and is currently underperforming the overall market by -1.12% year-to-date. Below is a quick view of technical charts and trends: | |
 MDY Weekly Chart |
|
| Long Term Trend: Good | |
| Medium Term Trend: Not Good | |
 MDY Daily Chart |
|
| Short Term Trend: Very Good | |
| Overall Trend Score: 49 | |
| YTD Performance: 4.04% | |
| **Trend Scores & Views Are Only For Educational Purposes And Not For Investing | |
| 12Stocks.com: Investing in Midcap Index using Exchange Traded Funds | |
|
The following table shows list of key exchange traded funds (ETF) that
help investors track Midcap index. The following list also includes leveraged ETF funds that track twice or thrice the daily returns of Midcap indices. Short or inverse ETF funds move in the opposite direction to the index they track and are useful during market pullbacks or during bear markets. Quick View: Move mouse or cursor over ETF symbol (ticker) to view short-term technical chart and over ETF name to view long term chart. Click on ticker or stock name for detailed view. Click on to add stock symbol to your watchlist and to view watchlist. |
12Stocks.com List of ETFs that track Midcap Index
| Ticker | ETF Name | Watchlist | Recent Price | Smart Investing & Trading Score | Change % | Week % | Year-to-date % |
| IJH | iShares Core S&P Mid-Cap | | 57.68 | 61 | -0.33 | 1.94 | 4.06% |
| IWP | iShares Russell Mid-Cap Growth | | 108.46 | 51 | -0.03 | 2.61 | 3.83% |
| IWR | iShares Russell Mid-Cap | | 80.27 | 56 | -0.17 | 2.05 | 3.27% |
| MDY | SPDR S&P MidCap 400 ETF | | 527.86 | 49 | -0.37 | 1.85 | 4.04% |
| IWS | iShares Russell Mid-Cap Value | | 119.79 | 61 | -0.15 | 1.82 | 3.01% |
| IJK | iShares S&P Mid-Cap 400 Growth | | 86.74 | 56 | -0.29 | 2.23 | 9.49% |
| IJJ | iShares S&P Mid-Cap 400 Value | | 111.95 | 51 | -0.57 | 1.27 | -1.83% |
| XMLV | PowerShares S&P MidCap Low Volatil ETF | | 54.74 | 68 | -0.55 | 1.07 | 2.93% |
| SMDD | ProShares UltraPro Short MidCap400 | | 11.89 | 39 | 0.46 | -5.36 | -11.69% |
| UMDD | ProShares UltraPro MidCap400 | | 23.72 | 49 | -1.54 | 5.13 | 6.27% |
| MVV | ProShares Ultra MidCap400 | | 61.03 | 41 | -0.93 | 3.44 | 5.42% |
| MZZ | ProShares UltraShort MidCap400 | | 11.75 | 34 | 0.51 | -3.46 | -6.53% |
| MYY | ProShares Short MidCap400 | | 20.97 | 39 | 1.11 | -1.03 | -2.26% |
| 12Stocks.com: Charts, Trends, Fundamental Data and Performances of MidCap Stocks | |
|
We now take in-depth look at all MidCap stocks including charts, multi-period performances and overall trends (as measured by Smart Investing & Trading Score). One can sort MidCap stocks (click link to choose) by Daily, Weekly and by Year-to-Date performances. Also, one can sort by size of the company or by market capitalization. |
| Select Your Default Chart Type: | |||||
| |||||
| Click on stock symbol or name for detailed view. Click on to add stock symbol to your watchlist and to view watchlist. Quick View: Move mouse or cursor over "Daily" to quickly view daily technical stock chart and over "Weekly" to view weekly technical stock chart. | |||||

 | CTRA Contura Energy, Inc. |
| Sector: Materials | |
| SubSector: Industrial Metals & Minerals | |
| MarketCap: 75.291 Millions | |
| Recent Price: 28.20 Smart Investing & Trading Score: 88 | |
| Day Percent Change: -0.90% Day Change: -0.26 | |
| Week Change: 1.64% Year-to-date Change: 10.5% | |
| CTRA Links: Profile News Message Board | |
| Charts:- Daily , Weekly | |
| Add CTRA to Watchlist: View: Get Complete CTRA Trend Analysis ➞ | |
 | SPG Simon Property Group, Inc. |
| Sector: Financials | |
| SubSector: REIT - Retail | |
| MarketCap: 17959.6 Millions | |
| Recent Price: 142.73 Smart Investing & Trading Score: 44 | |
| Day Percent Change: -0.06% Day Change: -0.08 | |
| Week Change: 1.63% Year-to-date Change: 0.1% | |
| SPG Links: Profile News Message Board | |
| Charts:- Daily , Weekly | |
| Add SPG to Watchlist: View: Get Complete SPG Trend Analysis ➞ | |
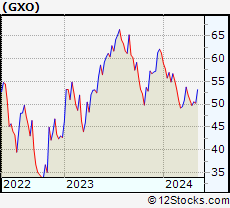 | GXO GXO Logistics, Inc. |
| Sector: Industrials | |
| SubSector: Integrated Freight & Logistics | |
| MarketCap: 7340 Millions | |
| Recent Price: 50.54 Smart Investing & Trading Score: 42 | |
| Day Percent Change: 1.61% Day Change: 0.80 | |
| Week Change: 1.63% Year-to-date Change: -17.5% | |
| GXO Links: Profile News Message Board | |
| Charts:- Daily , Weekly | |
| Add GXO to Watchlist: View: Get Complete GXO Trend Analysis ➞ | |
 | TPL Texas Pacific Land Trust |
| Sector: Financials | |
| SubSector: Real Estate Development | |
| MarketCap: 3052.29 Millions | |
| Recent Price: 592.02 Smart Investing & Trading Score: 49 | |
| Day Percent Change: 0.51% Day Change: 3.01 | |
| Week Change: 1.62% Year-to-date Change: -62.4% | |
| TPL Links: Profile News Message Board | |
| Charts:- Daily , Weekly | |
| Add TPL to Watchlist: View: Get Complete TPL Trend Analysis ➞ | |
 | LFUS Littelfuse, Inc. |
| Sector: Services & Goods | |
| SubSector: Electronics Wholesale | |
| MarketCap: 2965.23 Millions | |
| Recent Price: 230.39 Smart Investing & Trading Score: 52 | |
| Day Percent Change: -1.37% Day Change: -3.21 | |
| Week Change: 1.61% Year-to-date Change: -13.9% | |
| LFUS Links: Profile News Message Board | |
| Charts:- Daily , Weekly | |
| Add LFUS to Watchlist: View: Get Complete LFUS Trend Analysis ➞ | |
 | KEYS Keysight Technologies, Inc. |
| Sector: Technology | |
| SubSector: Scientific & Technical Instruments | |
| MarketCap: 17355.1 Millions | |
| Recent Price: 147.43 Smart Investing & Trading Score: 35 | |
| Day Percent Change: 0.57% Day Change: 0.83 | |
| Week Change: 1.59% Year-to-date Change: -7.3% | |
| KEYS Links: Profile News Message Board | |
| Charts:- Daily , Weekly | |
| Add KEYS to Watchlist: View: Get Complete KEYS Trend Analysis ➞ | |
 | HII Huntington Ingalls Industries, Inc. |
| Sector: Industrials | |
| SubSector: Aerospace/Defense Products & Services | |
| MarketCap: 7276.11 Millions | |
| Recent Price: 275.98 Smart Investing & Trading Score: 51 | |
| Day Percent Change: 0.05% Day Change: 0.14 | |
| Week Change: 1.59% Year-to-date Change: 6.3% | |
| HII Links: Profile News Message Board | |
| Charts:- Daily , Weekly | |
| Add HII to Watchlist: View: Get Complete HII Trend Analysis ➞ | |
 | BK The Bank of New York Mellon Corporation |
| Sector: Financials | |
| SubSector: Asset Management | |
| MarketCap: 29807.5 Millions | |
| Recent Price: 57.18 Smart Investing & Trading Score: 68 | |
| Day Percent Change: -1.33% Day Change: -0.77 | |
| Week Change: 1.58% Year-to-date Change: 9.9% | |
| BK Links: Profile News Message Board | |
| Charts:- Daily , Weekly | |
| Add BK to Watchlist: View: Get Complete BK Trend Analysis ➞ | |
 | OHI Omega Healthcare Investors, Inc. |
| Sector: Financials | |
| SubSector: REIT - Healthcare Facilities | |
| MarketCap: 6433.84 Millions | |
| Recent Price: 30.90 Smart Investing & Trading Score: 65 | |
| Day Percent Change: 0.72% Day Change: 0.22 | |
| Week Change: 1.58% Year-to-date Change: 0.8% | |
| OHI Links: Profile News Message Board | |
| Charts:- Daily , Weekly | |
| Add OHI to Watchlist: View: Get Complete OHI Trend Analysis ➞ | |
 | FITB Fifth Third Bancorp |
| Sector: Financials | |
| SubSector: Regional - Midwest Banks | |
| MarketCap: 10197 Millions | |
| Recent Price: 36.82 Smart Investing & Trading Score: 81 | |
| Day Percent Change: -1.10% Day Change: -0.41 | |
| Week Change: 1.57% Year-to-date Change: 6.8% | |
| FITB Links: Profile News Message Board | |
| Charts:- Daily , Weekly | |
| Add FITB to Watchlist: View: Get Complete FITB Trend Analysis ➞ | |
 | TSN Tyson Foods, Inc. |
| Sector: Consumer Staples | |
| SubSector: Meat Products | |
| MarketCap: 22124.1 Millions | |
| Recent Price: 60.89 Smart Investing & Trading Score: 78 | |
| Day Percent Change: -0.70% Day Change: -0.43 | |
| Week Change: 1.57% Year-to-date Change: 13.3% | |
| TSN Links: Profile News Message Board | |
| Charts:- Daily , Weekly | |
| Add TSN to Watchlist: View: Get Complete TSN Trend Analysis ➞ | |
 | CMS CMS Energy Corporation |
| Sector: Utilities | |
| SubSector: Electric Utilities | |
| MarketCap: 15105.8 Millions | |
| Recent Price: 60.48 Smart Investing & Trading Score: 93 | |
| Day Percent Change: 0.33% Day Change: 0.20 | |
| Week Change: 1.56% Year-to-date Change: 4.2% | |
| CMS Links: Profile News Message Board | |
| Charts:- Daily , Weekly | |
| Add CMS to Watchlist: View: Get Complete CMS Trend Analysis ➞ | |
 | AWI Armstrong World Industries, Inc. |
| Sector: Industrials | |
| SubSector: General Building Materials | |
| MarketCap: 3609.53 Millions | |
| Recent Price: 115.76 Smart Investing & Trading Score: 56 | |
| Day Percent Change: -0.17% Day Change: -0.20 | |
| Week Change: 1.56% Year-to-date Change: 17.7% | |
| AWI Links: Profile News Message Board | |
| Charts:- Daily , Weekly | |
| Add AWI to Watchlist: View: Get Complete AWI Trend Analysis ➞ | |
 | OLLI Ollie s Bargain Outlet Holdings, Inc. |
| Sector: Services & Goods | |
| SubSector: Discount, Variety Stores | |
| MarketCap: 2904.62 Millions | |
| Recent Price: 74.35 Smart Investing & Trading Score: 83 | |
| Day Percent Change: -0.48% Day Change: -0.36 | |
| Week Change: 1.56% Year-to-date Change: -2.0% | |
| OLLI Links: Profile News Message Board | |
| Charts:- Daily , Weekly | |
| Add OLLI to Watchlist: View: Get Complete OLLI Trend Analysis ➞ | |
 | EQH Equitable Holdings, Inc. |
| Sector: Financials | |
| SubSector: Insurance Brokers | |
| MarketCap: 5520.07 Millions | |
| Recent Price: 37.13 Smart Investing & Trading Score: 53 | |
| Day Percent Change: -2.47% Day Change: -0.94 | |
| Week Change: 1.56% Year-to-date Change: 11.5% | |
| EQH Links: Profile News Message Board | |
| Charts:- Daily , Weekly | |
| Add EQH to Watchlist: View: Get Complete EQH Trend Analysis ➞ | |
 | PRGO Perrigo Company plc |
| Sector: Health Care | |
| SubSector: Drug Related Products | |
| MarketCap: 6493.93 Millions | |
| Recent Price: 31.27 Smart Investing & Trading Score: 67 | |
| Day Percent Change: 0.13% Day Change: 0.04 | |
| Week Change: 1.53% Year-to-date Change: -2.8% | |
| PRGO Links: Profile News Message Board | |
| Charts:- Daily , Weekly | |
| Add PRGO to Watchlist: View: Get Complete PRGO Trend Analysis ➞ | |
 | NYT The New York Times Company |
| Sector: Services & Goods | |
| SubSector: Publishing - Newspapers | |
| MarketCap: 5188.22 Millions | |
| Recent Price: 43.25 Smart Investing & Trading Score: 50 | |
| Day Percent Change: -0.12% Day Change: -0.05 | |
| Week Change: 1.53% Year-to-date Change: -11.7% | |
| NYT Links: Profile News Message Board | |
| Charts:- Daily , Weekly | |
| Add NYT to Watchlist: View: Get Complete NYT Trend Analysis ➞ | |
 | HRL Hormel Foods Corporation |
| Sector: Consumer Staples | |
| SubSector: Meat Products | |
| MarketCap: 25590.2 Millions | |
| Recent Price: 35.27 Smart Investing & Trading Score: 88 | |
| Day Percent Change: -0.93% Day Change: -0.33 | |
| Week Change: 1.53% Year-to-date Change: 9.8% | |
| HRL Links: Profile News Message Board | |
| Charts:- Daily , Weekly | |
| Add HRL to Watchlist: View: Get Complete HRL Trend Analysis ➞ | |
 | WEC WEC Energy Group, Inc. |
| Sector: Utilities | |
| SubSector: Electric Utilities | |
| MarketCap: 24852 Millions | |
| Recent Price: 82.81 Smart Investing & Trading Score: 100 | |
| Day Percent Change: 0.22% Day Change: 0.18 | |
| Week Change: 1.53% Year-to-date Change: -1.6% | |
| WEC Links: Profile News Message Board | |
| Charts:- Daily , Weekly | |
| Add WEC to Watchlist: View: Get Complete WEC Trend Analysis ➞ | |
 | ANSS ANSYS, Inc. |
| Sector: Technology | |
| SubSector: Application Software | |
| MarketCap: 19497.4 Millions | |
| Recent Price: 327.04 Smart Investing & Trading Score: 31 | |
| Day Percent Change: -0.47% Day Change: -1.53 | |
| Week Change: 1.53% Year-to-date Change: -9.9% | |
| ANSS Links: Profile News Message Board | |
| Charts:- Daily , Weekly | |
| Add ANSS to Watchlist: View: Get Complete ANSS Trend Analysis ➞ | |
 | WWD Woodward, Inc. |
| Sector: Industrials | |
| SubSector: Aerospace/Defense Products & Services | |
| MarketCap: 3764.01 Millions | |
| Recent Price: 149.74 Smart Investing & Trading Score: 63 | |
| Day Percent Change: 0.09% Day Change: 0.13 | |
| Week Change: 1.53% Year-to-date Change: 10.0% | |
| WWD Links: Profile News Message Board | |
| Charts:- Daily , Weekly | |
| Add WWD to Watchlist: View: Get Complete WWD Trend Analysis ➞ | |
 | DVN Devon Energy Corporation |
| Sector: Energy | |
| SubSector: Independent Oil & Gas | |
| MarketCap: 2693.03 Millions | |
| Recent Price: 52.61 Smart Investing & Trading Score: 54 | |
| Day Percent Change: 0.98% Day Change: 0.51 | |
| Week Change: 1.5% Year-to-date Change: 16.1% | |
| DVN Links: Profile News Message Board | |
| Charts:- Daily , Weekly | |
| Add DVN to Watchlist: View: Get Complete DVN Trend Analysis ➞ | |
 | BILL Bill.com Holdings, Inc. |
| Sector: Technology | |
| SubSector: Application Software | |
| MarketCap: 3068.42 Millions | |
| Recent Price: 60.50 Smart Investing & Trading Score: 30 | |
| Day Percent Change: -1.48% Day Change: -0.91 | |
| Week Change: 1.49% Year-to-date Change: -25.9% | |
| BILL Links: Profile News Message Board | |
| Charts:- Daily , Weekly | |
| Add BILL to Watchlist: View: Get Complete BILL Trend Analysis ➞ | |
 | GLPI Gaming and Leisure Properties, Inc. |
| Sector: Financials | |
| SubSector: REIT - Diversified | |
| MarketCap: 4922.33 Millions | |
| Recent Price: 43.43 Smart Investing & Trading Score: 42 | |
| Day Percent Change: -0.05% Day Change: -0.02 | |
| Week Change: 1.47% Year-to-date Change: -12.0% | |
| GLPI Links: Profile News Message Board | |
| Charts:- Daily , Weekly | |
| Add GLPI to Watchlist: View: Get Complete GLPI Trend Analysis ➞ | |
 | QDEL Quidel Corporation |
| Sector: Health Care | |
| SubSector: Diagnostic Substances | |
| MarketCap: 4104.91 Millions | |
| Recent Price: 39.69 Smart Investing & Trading Score: 42 | |
| Day Percent Change: -2.77% Day Change: -1.13 | |
| Week Change: 1.46% Year-to-date Change: -46.2% | |
| QDEL Links: Profile News Message Board | |
| Charts:- Daily , Weekly | |
| Add QDEL to Watchlist: View: Get Complete QDEL Trend Analysis ➞ | |
| For tabular summary view of above stock list: Summary View ➞ 0 - 25 , 25 - 50 , 50 - 75 , 75 - 100 , 100 - 125 , 125 - 150 , 150 - 175 , 175 - 200 , 200 - 225 , 225 - 250 , 250 - 275 , 275 - 300 , 300 - 325 , 325 - 350 , 350 - 375 , 375 - 400 , 400 - 425 , 425 - 450 , 450 - 475 , 475 - 500 , 500 - 525 , 525 - 550 , 550 - 575 , 575 - 600 , 600 - 625 , 625 - 650 , 650 - 675 , 675 - 700 , 700 - 725 , 725 - 750 , 750 - 775 | ||
| Click To Change The Sort Order: By Market Cap or Company Size Performance: Year-to-date, Week and Day | |
| Select Chart Type: | ||
|
Best Stocks Today 12Stocks.com |
© 2024 12Stocks.com Terms & Conditions Privacy Contact Us
All Information Provided Only For Education And Not To Be Used For Investing or Trading. See Terms & Conditions


One More Thing ... Get Best Stocks Delivered Daily!
Never Ever Miss A Move With Our Top Ten Stocks Lists
Find Best Stocks In Any Market - Bull or Bear Market
Take A Peek At Our Top Ten Stocks Lists: Daily, Weekly, Year-to-Date & Top Trends
Find Best Stocks In Any Market - Bull or Bear Market
Take A Peek At Our Top Ten Stocks Lists: Daily, Weekly, Year-to-Date & Top Trends
Midcap Stocks With Best Up Trends [0-bearish to 100-bullish]: Kirby [100], HashiCorp [100], Ardagh Metal[100], Teradyne [100], Antero Resources[100], Churchill Downs[100], Dover [100], Tractor Supply[100], Virtu Financial[100], EQT [100], Microchip [100]
Best Midcap Stocks Year-to-Date:
Vistra Energy[88.16%], AppLovin [73.92%], ShockWave Medical[72.7%], EMCOR [62.16%], Constellation Energy[60.54%], Spotify [53.81%], Antero Resources[47.22%], Pure Storage[46.44%], Natera [45.72%], Wingstop [44.17%], CAVA [43.95%] Best Midcap Stocks This Week:
HashiCorp [36.92%], Hasbro [17.55%], Kirby [17.07%], Tandem Diabetes[16.86%], Ardagh Metal[14.9%], First Citizens[14.87%], Antero Resources[14%], Tyler Technologies[13.57%], Teradyne [13.48%], Wabtec [13.19%], Globe Life[13.19%] Best Midcap Stocks Daily:
Kirby [10.99%], HashiCorp [10.69%], First Citizens[9.80%], Tyler Technologies[9.32%], Ardagh Metal[8.82%], TransUnion [8.17%], Teradyne [8.15%], Carrier Global[7.19%], Antero Resources[6.20%], CACI [5.93%], United Rentals[5.45%]