
 Login Sign Up


| |||||
 |  | ||||

| 12Stocks.com Market Intelligence |
Best MidCap Stocks
|
| In a hurry? Mid Cap Stocks Lists: Performance Trends Table, Stock Charts
Sort midcap stocks: Daily, Weekly, Year-to-Date, Market Cap & Trends. Filter midcap stocks list by sector: Show all, Tech, Finance, Energy, Staples, Retail, Industrial, Materials, Utilities and HealthCare Filter midcap stocks list by size:All MidCap Large Mid-Range Small |
| 12Stocks.com Mid Cap Stocks Performances & Trends Daily | |||||||||
|
|  The overall Smart Investing & Trading Score is 70 (0-bearish to 100-bullish) which puts Mid Cap index in short term neutral to bullish trend. The Smart Investing & Trading Score from previous trading session is 56 and hence an improvement of trend.
| ||||||||
Here are the Smart Investing & Trading Scores of the most requested mid cap stocks at 12Stocks.com (click stock name for detailed review):
|


| 12Stocks.com: Top Performing Mid Cap Index Stocks | ||||||||||||||||||||||||||||||||||||||||||||||||
 The top performing Mid Cap Index stocks year to date are
Now, more recently, over last week, the top performing Mid Cap Index stocks on the move are


|
||||||||||||||||||||||||||||||||||||||||||||||||
| 12Stocks.com: Investing in Midcap Index with Stocks | |
|
The following table helps investors and traders sort through current performance and trends (as measured by Smart Investing & Trading Score) of various
stocks in the Midcap Index. Quick View: Move mouse or cursor over stock symbol (ticker) to view short-term technical chart and over stock name to view long term chart. Click on  to add stock symbol to your watchlist and to add stock symbol to your watchlist and  to view watchlist. Click on any ticker or stock name for detailed market intelligence report for that stock. to view watchlist. Click on any ticker or stock name for detailed market intelligence report for that stock. |
12Stocks.com Performance of Stocks in Midcap Index
| Ticker | Stock Name | Watchlist | Category | Recent Price | Smart Investing & Trading Score | Change % | Weekly Change% |
| AMG | Affiliated Managers |   | Financials | 158.92 | 46 | -0.80% | -0.80% |
| BSY | Bentley | | Technology | 53.56 | 61 | -0.80% | -0.80% |
| AMH | American Homes | | Financials | 36.11 | 100 | -0.82% | -0.82% |
| MORN | Morningstar | | Technology | 283.83 | 26 | -0.86% | -0.86% |
| CSL | Carlisle | | Consumer Staples | 397.00 | 83 | -0.89% | -0.89% |
| FANG | Diamondback Energy | | Energy | 205.86 | 54 | -0.91% | -0.91% |
| AGNC | AGNC | | Financials | 9.24 | 30 | -0.96% | -0.96% |
| BOKF | BOK Financial | | Financials | 89.95 | 58 | -0.97% | -0.97% |
| SNV | Synovus Financial | | Financials | 36.49 | 15 | -0.98% | -0.98% |
| PSTG | Pure Storage | | Technology | 52.43 | 75 | -0.98% | -0.98% |
| WAL | Western Alliance | | Financials | 58.10 | 37 | -0.99% | -0.99% |
| OHI | Omega | | Financials | 30.78 | 66 | -1.00% | -1.00% |
| DAR | Darling Ingredients | | Industrials | 44.21 | 88 | -1.03% | -1.03% |
| ZION | Zions Ban | | Financials | 41.32 | 49 | -1.05% | -1.05% |
| ORI | Old Republic | | Financials | 29.80 | 48 | -1.10% | -1.10% |
| CBSH | Commerce Bancshares | | Financials | 54.79 | 68 | -1.12% | -1.12% |
| APP | AppLovin | | Technology | 72.99 | 61 | -1.12% | -1.12% |
| MTCH | Match | | Technology | 31.53 | 15 | -1.13% | -1.13% |
| COLM | Columbia Sportswear | | Consumer Staples | 79.09 | 55 | -1.14% | -1.14% |
| ANSS | ANSYS | | Technology | 329.87 | 38 | -1.16% | -1.16% |
| PNFP | Pinnacle Financial | | Financials | 79.36 | 25 | -1.16% | -1.16% |
| PEN | Penumbra | | Health Care | 202.04 | 15 | -1.16% | -1.16% |
| APO | Apollo Global | | Financials | 110.91 | 41 | -1.17% | -1.17% |
| SLM | SLM | | Financials | 21.63 | 58 | -1.23% | -1.23% |
| X | United States | | Materials | 36.96 | 35 | -1.23% | -1.23% |
| For chart view version of above stock list: Chart View ➞ 0 - 25 , 25 - 50 , 50 - 75 , 75 - 100 , 100 - 125 , 125 - 150 , 150 - 175 , 175 - 200 , 200 - 225 , 225 - 250 , 250 - 275 , 275 - 300 , 300 - 325 , 325 - 350 , 350 - 375 , 375 - 400 , 400 - 425 , 425 - 450 , 450 - 475 , 475 - 500 , 500 - 525 , 525 - 550 , 550 - 575 , 575 - 600 , 600 - 625 , 625 - 650 , 650 - 675 , 675 - 700 , 700 - 725 , 725 - 750 , 750 - 775 | ||
 | Click To Change The Sort Order: By Market Cap or Company Size Performance: Year-to-date, Week and Day |  |
|
Get the most comprehensive stock market coverage daily at 12Stocks.com ➞ Best Stocks Today ➞ Best Stocks Weekly ➞ Best Stocks Year-to-Date ➞ Best Stocks Trends ➞  Best Stocks Today 12Stocks.com Best Nasdaq Stocks ➞ Best S&P 500 Stocks ➞ Best Tech Stocks ➞ Best Biotech Stocks ➞ |
| Detailed Overview of Midcap Stocks |
| Midcap Technical Overview, Leaders & Laggards, Top Midcap ETF Funds & Detailed Midcap Stocks List, Charts, Trends & More |
| Midcap: Technical Analysis, Trends & YTD Performance | |
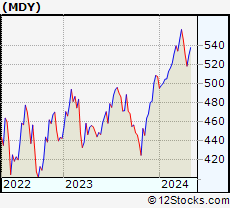
| MidCap segment as represented by
MDY, an exchange-traded fund [ETF], holds basket of about four hundred midcap stocks from across all major sectors of the US stock market. The midcap index (contains stocks like Green Mountain Coffee Roasters and Tractor Supply Company) is up by 4.91% and is currently underperforming the overall market by -1.65% year-to-date. Below is a quick view of technical charts and trends: | |
 MDY Weekly Chart |
|
| Long Term Trend: Very Good | |
| Medium Term Trend: Good | |
 MDY Daily Chart |
|
| Short Term Trend: Very Good | |
| Overall Trend Score: 70 | |
| YTD Performance: 4.91% | |
| **Trend Scores & Views Are Only For Educational Purposes And Not For Investing | |
| 12Stocks.com: Investing in Midcap Index using Exchange Traded Funds | |
|
The following table shows list of key exchange traded funds (ETF) that
help investors track Midcap index. The following list also includes leveraged ETF funds that track twice or thrice the daily returns of Midcap indices. Short or inverse ETF funds move in the opposite direction to the index they track and are useful during market pullbacks or during bear markets. Quick View: Move mouse or cursor over ETF symbol (ticker) to view short-term technical chart and over ETF name to view long term chart. Click on ticker or stock name for detailed view. Click on to add stock symbol to your watchlist and to view watchlist. |
12Stocks.com List of ETFs that track Midcap Index
| Ticker | ETF Name | Watchlist | Recent Price | Smart Investing & Trading Score | Change % | Week % | Year-to-date % |
| IJH | iShares Core S&P Mid-Cap | | 58.17 | 75 | 0.61 | 0.61 | 4.94% |
| IWR | iShares Russell Mid-Cap | | 80.98 | 75 | 0.57 | 0.57 | 4.18% |
| IWP | iShares Russell Mid-Cap Growth | | 109.47 | 78 | 0.45 | 0.45 | 4.8% |
| MDY | SPDR S&P MidCap 400 ETF | | 532.28 | 70 | 0.55 | 0.55 | 4.91% |
| IWS | iShares Russell Mid-Cap Value | | 120.76 | 75 | 0.64 | 0.64 | 3.84% |
| IJK | iShares S&P Mid-Cap 400 Growth | | 87.51 | 70 | 0.59 | 0.59 | 10.46% |
| IJJ | iShares S&P Mid-Cap 400 Value | | 112.85 | 88 | 0.55 | 0.55 | -1.04% |
| XMLV | PowerShares S&P MidCap Low Volatil ETF | | 54.94 | 83 | 0.53 | 0.53 | 3.31% |
| UMDD | ProShares UltraPro MidCap400 | | 24.32 | 71 | 1.50 | 1.5 | 8.96% |
| SMDD | ProShares UltraPro Short MidCap400 | | 11.62 | 10 | -1.78 | -1.78 | -13.69% |
| MYY | ProShares Short MidCap400 | | 20.69 | 18 | -0.48 | -0.48 | -3.56% |
| MZZ | ProShares UltraShort MidCap400 | | 11.59 | 20 | -0.77 | -0.77 | -7.8% |
| MVV | ProShares Ultra MidCap400 | | 61.81 | 75 | 0.61 | 0.61 | 6.76% |
| 12Stocks.com: Charts, Trends, Fundamental Data and Performances of MidCap Stocks | |
|
We now take in-depth look at all MidCap stocks including charts, multi-period performances and overall trends (as measured by Smart Investing & Trading Score). One can sort MidCap stocks (click link to choose) by Daily, Weekly and by Year-to-Date performances. Also, one can sort by size of the company or by market capitalization. |
| Select Your Default Chart Type: | |||||
| |||||
| Click on stock symbol or name for detailed view. Click on to add stock symbol to your watchlist and to view watchlist. Quick View: Move mouse or cursor over "Daily" to quickly view daily technical stock chart and over "Weekly" to view weekly technical stock chart. | |||||

 | AMG Affiliated Managers Group, Inc. |
| Sector: Financials | |
| SubSector: Asset Management | |
| MarketCap: 2849.63 Millions | |
| Recent Price: 158.92 Smart Investing & Trading Score: 46 | |
| Day Percent Change: -0.80% Day Change: -1.28 | |
| Week Change: -0.8% Year-to-date Change: 5.0% | |
| AMG Links: Profile News Message Board | |
| Charts:- Daily , Weekly | |
| Add AMG to Watchlist: View: Get Complete AMG Trend Analysis ➞ | |
 | BSY Bentley Systems, Incorporated |
| Sector: Technology | |
| SubSector: Software Application | |
| MarketCap: 98687 Millions | |
| Recent Price: 53.56 Smart Investing & Trading Score: 61 | |
| Day Percent Change: -0.80% Day Change: -0.43 | |
| Week Change: -0.8% Year-to-date Change: 2.7% | |
| BSY Links: Profile News Message Board | |
| Charts:- Daily , Weekly | |
| Add BSY to Watchlist: View: Get Complete BSY Trend Analysis ➞ | |
 | AMH American Homes 4 Rent |
| Sector: Financials | |
| SubSector: REIT - Residential | |
| MarketCap: 6135.31 Millions | |
| Recent Price: 36.11 Smart Investing & Trading Score: 100 | |
| Day Percent Change: -0.82% Day Change: -0.30 | |
| Week Change: -0.82% Year-to-date Change: 0.4% | |
| AMH Links: Profile News Message Board | |
| Charts:- Daily , Weekly | |
| Add AMH to Watchlist: View: Get Complete AMH Trend Analysis ➞ | |
 | MORN Morningstar, Inc. |
| Sector: Technology | |
| SubSector: Information & Delivery Services | |
| MarketCap: 4997.87 Millions | |
| Recent Price: 283.83 Smart Investing & Trading Score: 26 | |
| Day Percent Change: -0.86% Day Change: -2.46 | |
| Week Change: -0.86% Year-to-date Change: -0.8% | |
| MORN Links: Profile News Message Board | |
| Charts:- Daily , Weekly | |
| Add MORN to Watchlist: View: Get Complete MORN Trend Analysis ➞ | |
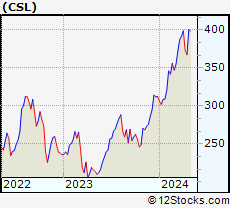 | CSL Carlisle Companies Incorporated |
| Sector: Consumer Staples | |
| SubSector: Rubber & Plastics | |
| MarketCap: 6542.7 Millions | |
| Recent Price: 397.00 Smart Investing & Trading Score: 83 | |
| Day Percent Change: -0.89% Day Change: -3.56 | |
| Week Change: -0.89% Year-to-date Change: 27.1% | |
| CSL Links: Profile News Message Board | |
| Charts:- Daily , Weekly | |
| Add CSL to Watchlist: View: Get Complete CSL Trend Analysis ➞ | |
 | FANG Diamondback Energy, Inc. |
| Sector: Energy | |
| SubSector: Independent Oil & Gas | |
| MarketCap: 3009.13 Millions | |
| Recent Price: 205.86 Smart Investing & Trading Score: 54 | |
| Day Percent Change: -0.91% Day Change: -1.90 | |
| Week Change: -0.91% Year-to-date Change: 32.7% | |
| FANG Links: Profile News Message Board | |
| Charts:- Daily , Weekly | |
| Add FANG to Watchlist: View: Get Complete FANG Trend Analysis ➞ | |
 | AGNC AGNC Investment Corp. |
| Sector: Financials | |
| SubSector: Mortgage Investment | |
| MarketCap: 6622.19 Millions | |
| Recent Price: 9.24 Smart Investing & Trading Score: 30 | |
| Day Percent Change: -0.96% Day Change: -0.09 | |
| Week Change: -0.96% Year-to-date Change: -5.8% | |
| AGNC Links: Profile News Message Board | |
| Charts:- Daily , Weekly | |
| Add AGNC to Watchlist: View: Get Complete AGNC Trend Analysis ➞ | |
 | BOKF BOK Financial Corporation |
| Sector: Financials | |
| SubSector: Regional - Southwest Banks | |
| MarketCap: 2945.35 Millions | |
| Recent Price: 89.95 Smart Investing & Trading Score: 58 | |
| Day Percent Change: -0.97% Day Change: -0.88 | |
| Week Change: -0.97% Year-to-date Change: 5.0% | |
| BOKF Links: Profile News Message Board | |
| Charts:- Daily , Weekly | |
| Add BOKF to Watchlist: View: Get Complete BOKF Trend Analysis ➞ | |
 | SNV Synovus Financial Corp. |
| Sector: Financials | |
| SubSector: Regional - Mid-Atlantic Banks | |
| MarketCap: 2697.29 Millions | |
| Recent Price: 36.49 Smart Investing & Trading Score: 15 | |
| Day Percent Change: -0.98% Day Change: -0.36 | |
| Week Change: -0.98% Year-to-date Change: -3.1% | |
| SNV Links: Profile News Message Board | |
| Charts:- Daily , Weekly | |
| Add SNV to Watchlist: View: Get Complete SNV Trend Analysis ➞ | |
 | PSTG Pure Storage, Inc. |
| Sector: Technology | |
| SubSector: Data Storage Devices | |
| MarketCap: 2993.99 Millions | |
| Recent Price: 52.43 Smart Investing & Trading Score: 75 | |
| Day Percent Change: -0.98% Day Change: -0.52 | |
| Week Change: -0.98% Year-to-date Change: 47.0% | |
| PSTG Links: Profile News Message Board | |
| Charts:- Daily , Weekly | |
| Add PSTG to Watchlist: View: Get Complete PSTG Trend Analysis ➞ | |
 | WAL Western Alliance Bancorporation |
| Sector: Financials | |
| SubSector: Regional - Pacific Banks | |
| MarketCap: 2980.09 Millions | |
| Recent Price: 58.10 Smart Investing & Trading Score: 37 | |
| Day Percent Change: -0.99% Day Change: -0.58 | |
| Week Change: -0.99% Year-to-date Change: -11.7% | |
| WAL Links: Profile News Message Board | |
| Charts:- Daily , Weekly | |
| Add WAL to Watchlist: View: Get Complete WAL Trend Analysis ➞ | |
 | OHI Omega Healthcare Investors, Inc. |
| Sector: Financials | |
| SubSector: REIT - Healthcare Facilities | |
| MarketCap: 6433.84 Millions | |
| Recent Price: 30.78 Smart Investing & Trading Score: 66 | |
| Day Percent Change: -1.00% Day Change: -0.31 | |
| Week Change: -1% Year-to-date Change: 0.4% | |
| OHI Links: Profile News Message Board | |
| Charts:- Daily , Weekly | |
| Add OHI to Watchlist: View: Get Complete OHI Trend Analysis ➞ | |
 | DAR Darling Ingredients Inc. |
| Sector: Industrials | |
| SubSector: Waste Management | |
| MarketCap: 3075.28 Millions | |
| Recent Price: 44.21 Smart Investing & Trading Score: 88 | |
| Day Percent Change: -1.03% Day Change: -0.46 | |
| Week Change: -1.03% Year-to-date Change: -11.3% | |
| DAR Links: Profile News Message Board | |
| Charts:- Daily , Weekly | |
| Add DAR to Watchlist: View: Get Complete DAR Trend Analysis ➞ | |
 | ZION Zions Bancorporation, National Association |
| Sector: Financials | |
| SubSector: Regional - Pacific Banks | |
| MarketCap: 4577.89 Millions | |
| Recent Price: 41.32 Smart Investing & Trading Score: 49 | |
| Day Percent Change: -1.05% Day Change: -0.44 | |
| Week Change: -1.05% Year-to-date Change: -5.8% | |
| ZION Links: Profile News Message Board | |
| Charts:- Daily , Weekly | |
| Add ZION to Watchlist: View: Get Complete ZION Trend Analysis ➞ | |
 | ORI Old Republic International Corporation |
| Sector: Financials | |
| SubSector: Property & Casualty Insurance | |
| MarketCap: 4420.92 Millions | |
| Recent Price: 29.80 Smart Investing & Trading Score: 48 | |
| Day Percent Change: -1.10% Day Change: -0.33 | |
| Week Change: -1.1% Year-to-date Change: 1.4% | |
| ORI Links: Profile News Message Board | |
| Charts:- Daily , Weekly | |
| Add ORI to Watchlist: View: Get Complete ORI Trend Analysis ➞ | |
 | CBSH Commerce Bancshares, Inc. |
| Sector: Financials | |
| SubSector: Regional - Midwest Banks | |
| MarketCap: 6201.5 Millions | |
| Recent Price: 54.79 Smart Investing & Trading Score: 68 | |
| Day Percent Change: -1.12% Day Change: -0.62 | |
| Week Change: -1.12% Year-to-date Change: 2.6% | |
| CBSH Links: Profile News Message Board | |
| Charts:- Daily , Weekly | |
| Add CBSH to Watchlist: View: Get Complete CBSH Trend Analysis ➞ | |
 | APP AppLovin Corporation |
| Sector: Technology | |
| SubSector: Software - Application | |
| MarketCap: 9000 Millions | |
| Recent Price: 72.99 Smart Investing & Trading Score: 61 | |
| Day Percent Change: -1.12% Day Change: -0.83 | |
| Week Change: -1.12% Year-to-date Change: 83.4% | |
| APP Links: Profile News Message Board | |
| Charts:- Daily , Weekly | |
| Add APP to Watchlist: View: Get Complete APP Trend Analysis ➞ | |
 | MTCH Match Group, Inc. |
| Sector: Technology | |
| SubSector: Internet Information Providers | |
| MarketCap: 14655.8 Millions | |
| Recent Price: 31.53 Smart Investing & Trading Score: 15 | |
| Day Percent Change: -1.13% Day Change: -0.36 | |
| Week Change: -1.13% Year-to-date Change: -13.6% | |
| MTCH Links: Profile News Message Board | |
| Charts:- Daily , Weekly | |
| Add MTCH to Watchlist: View: Get Complete MTCH Trend Analysis ➞ | |
 | COLM Columbia Sportswear Company |
| Sector: Consumer Staples | |
| SubSector: Textile - Apparel Clothing | |
| MarketCap: 4371.75 Millions | |
| Recent Price: 79.09 Smart Investing & Trading Score: 55 | |
| Day Percent Change: -1.14% Day Change: -0.91 | |
| Week Change: -1.14% Year-to-date Change: -0.6% | |
| COLM Links: Profile News Message Board | |
| Charts:- Daily , Weekly | |
| Add COLM to Watchlist: View: Get Complete COLM Trend Analysis ➞ | |
 | ANSS ANSYS, Inc. |
| Sector: Technology | |
| SubSector: Application Software | |
| MarketCap: 19497.4 Millions | |
| Recent Price: 329.87 Smart Investing & Trading Score: 38 | |
| Day Percent Change: -1.16% Day Change: -3.88 | |
| Week Change: -1.16% Year-to-date Change: -9.1% | |
| ANSS Links: Profile News Message Board | |
| Charts:- Daily , Weekly | |
| Add ANSS to Watchlist: View: Get Complete ANSS Trend Analysis ➞ | |
 | PNFP Pinnacle Financial Partners, Inc. |
| Sector: Financials | |
| SubSector: Regional - Southeast Banks | |
| MarketCap: 2771.75 Millions | |
| Recent Price: 79.36 Smart Investing & Trading Score: 25 | |
| Day Percent Change: -1.16% Day Change: -0.93 | |
| Week Change: -1.16% Year-to-date Change: -9.0% | |
| PNFP Links: Profile News Message Board | |
| Charts:- Daily , Weekly | |
| Add PNFP to Watchlist: View: Get Complete PNFP Trend Analysis ➞ | |
 | PEN Penumbra, Inc. |
| Sector: Health Care | |
| SubSector: Medical Instruments & Supplies | |
| MarketCap: 4854.1 Millions | |
| Recent Price: 202.04 Smart Investing & Trading Score: 15 | |
| Day Percent Change: -1.16% Day Change: -2.37 | |
| Week Change: -1.16% Year-to-date Change: -19.7% | |
| PEN Links: Profile News Message Board | |
| Charts:- Daily , Weekly | |
| Add PEN to Watchlist: View: Get Complete PEN Trend Analysis ➞ | |
 | APO Apollo Global Management, Inc. |
| Sector: Financials | |
| SubSector: Diversified Investments | |
| MarketCap: 12706 Millions | |
| Recent Price: 110.91 Smart Investing & Trading Score: 41 | |
| Day Percent Change: -1.17% Day Change: -1.31 | |
| Week Change: -1.17% Year-to-date Change: 19.0% | |
| APO Links: Profile News Message Board | |
| Charts:- Daily , Weekly | |
| Add APO to Watchlist: View: Get Complete APO Trend Analysis ➞ | |
 | SLM SLM Corporation |
| Sector: Financials | |
| SubSector: Credit Services | |
| MarketCap: 3099.78 Millions | |
| Recent Price: 21.63 Smart Investing & Trading Score: 58 | |
| Day Percent Change: -1.23% Day Change: -0.27 | |
| Week Change: -1.23% Year-to-date Change: 13.1% | |
| SLM Links: Profile News Message Board | |
| Charts:- Daily , Weekly | |
| Add SLM to Watchlist: View: Get Complete SLM Trend Analysis ➞ | |
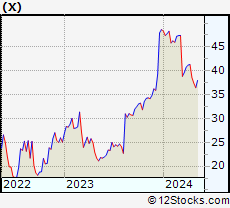 | X United States Steel Corporation |
| Sector: Materials | |
| SubSector: Steel & Iron | |
| MarketCap: 1062.88 Millions | |
| Recent Price: 36.96 Smart Investing & Trading Score: 35 | |
| Day Percent Change: -1.23% Day Change: -0.46 | |
| Week Change: -1.23% Year-to-date Change: -24.0% | |
| X Links: Profile News Message Board | |
| Charts:- Daily , Weekly | |
| Add X to Watchlist: View: Get Complete X Trend Analysis ➞ | |
| For tabular summary view of above stock list: Summary View ➞ 0 - 25 , 25 - 50 , 50 - 75 , 75 - 100 , 100 - 125 , 125 - 150 , 150 - 175 , 175 - 200 , 200 - 225 , 225 - 250 , 250 - 275 , 275 - 300 , 300 - 325 , 325 - 350 , 350 - 375 , 375 - 400 , 400 - 425 , 425 - 450 , 450 - 475 , 475 - 500 , 500 - 525 , 525 - 550 , 550 - 575 , 575 - 600 , 600 - 625 , 625 - 650 , 650 - 675 , 675 - 700 , 700 - 725 , 725 - 750 , 750 - 775 | ||
| Click To Change The Sort Order: By Market Cap or Company Size Performance: Year-to-date, Week and Day | |
| Select Chart Type: | ||
|
Best Stocks Today 12Stocks.com |
© 2024 12Stocks.com Terms & Conditions Privacy Contact Us
All Information Provided Only For Education And Not To Be Used For Investing or Trading. See Terms & Conditions


One More Thing ... Get Best Stocks Delivered Daily!
Never Ever Miss A Move With Our Top Ten Stocks Lists
Find Best Stocks In Any Market - Bull or Bear Market
Take A Peek At Our Top Ten Stocks Lists: Daily, Weekly, Year-to-Date & Top Trends
Find Best Stocks In Any Market - Bull or Bear Market
Take A Peek At Our Top Ten Stocks Lists: Daily, Weekly, Year-to-Date & Top Trends
Midcap Stocks With Best Up Trends [0-bearish to 100-bullish]: Albemarle [100], Medical Properties[100], Domino s[100], Tandem Diabetes[100], Lattice Semiconductor[100], Quest Diagnostics[100], AES [100], Carrier Global[100], Teradyne [100], DaVita [100], Skyworks Solutions[100]
Best Midcap Stocks Year-to-Date:
Vistra Energy[102.39%], AppLovin [83.42%], ShockWave Medical[72.92%], EMCOR [68.8%], CAVA [62.35%], Constellation Energy[61.05%], Spotify [53.34%], Antero Resources[51.23%], Natera [50.13%], Wingstop [49.98%], Pure Storage[47.03%] Best Midcap Stocks This Week:
Ginkgo Bioworks[15.08%], Hertz Global[7.92%], Albemarle [7.57%], Vistra Energy[7.24%], Medical Properties[5.99%], Domino s[5.62%], Liberty SiriusXM[5.49%], Liberty SiriusXM[5.27%], Tandem Diabetes[5.19%], Sirius XM[4.97%], Peloton Interactive[4.43%] Best Midcap Stocks Daily:
Ginkgo Bioworks[15.08%], Hertz Global[7.92%], Albemarle [7.57%], Vistra Energy[7.24%], Medical Properties[5.99%], Domino s[5.62%], Liberty SiriusXM[5.49%], Liberty SiriusXM[5.27%], Tandem Diabetes[5.19%], Sirius XM[4.97%], Peloton Interactive[4.43%]