
 Login Sign Up


| |||||
 |  | ||||

| 12Stocks.com Market Intelligence |
Best MidCap Stocks
|
| In a hurry? Mid Cap Stocks Lists: Performance Trends Table, Stock Charts
Sort midcap stocks: Daily, Weekly, Year-to-Date, Market Cap & Trends. Filter midcap stocks list by sector: Show all, Tech, Finance, Energy, Staples, Retail, Industrial, Materials, Utilities and HealthCare Filter midcap stocks list by size:All MidCap Large Mid-Range Small |
| 12Stocks.com Mid Cap Stocks Performances & Trends Daily | |||||||||
|
|  The overall Smart Investing & Trading Score is 81 (0-bearish to 100-bullish) which puts Mid Cap index in short term bullish trend. The Smart Investing & Trading Score from previous trading session is 76 and hence an improvement of trend.
| ||||||||
Here are the Smart Investing & Trading Scores of the most requested mid cap stocks at 12Stocks.com (click stock name for detailed review):
|


| 12Stocks.com: Top Performing Mid Cap Index Stocks | ||||||||||||||||||||||||||||||||||||||||||||||||
 The top performing Mid Cap Index stocks year to date are
Now, more recently, over last week, the top performing Mid Cap Index stocks on the move are


|
||||||||||||||||||||||||||||||||||||||||||||||||
| 12Stocks.com: Investing in Midcap Index with Stocks | |
|
The following table helps investors and traders sort through current performance and trends (as measured by Smart Investing & Trading Score) of various
stocks in the Midcap Index. Quick View: Move mouse or cursor over stock symbol (ticker) to view short-term technical chart and over stock name to view long term chart. Click on  to add stock symbol to your watchlist and to add stock symbol to your watchlist and  to view watchlist. Click on any ticker or stock name for detailed market intelligence report for that stock. to view watchlist. Click on any ticker or stock name for detailed market intelligence report for that stock. |
12Stocks.com Performance of Stocks in Midcap Index
| Ticker | Stock Name | Watchlist | Category | Recent Price | Smart Investing & Trading Score | Change % | YTD Change% |
| CNA | CNA Financial |   | Financials | 44.54 | 0 | -1.18% | -7.05% |
| HOLX | Hologic | | Health Care | 65.85 | 88 | 1.46% | -8.66% |
| JBHT | J.B. Hunt | | Transports | 152.67 | 83 | -0.25% | -10.31% |
| FMC | FMC | | Materials | 43.63 | 70 | 0.76% | -8.99% |
| NI | NiSource | | Utilities | 39.34 | 35 | 0.87% | 7.83% |
| BAH | Booz Allen | | Services & Goods | 107.02 | 42 | -0.51% | -16.46% |
| NTAP | NetApp | | Technology | 106.67 | 71 | 0.01% | -7.10% |
| FDS | FactSet Research | | Technology | 447.81 | 66 | 0.73% | -6.55% |
| TTD | Trade Desk | | Technology | 75.63 | 100 | 2.16% | -35.65% |
| APP | AppLovin | | Technology | 352.74 | 90 | 2.32% | 8.93% |
| IR | Ingersoll Rand | | Industrials | 87.70 | 95 | 0.79% | -3.03% |
| PKG | Packaging | | Consumer Staples | 204.08 | 95 | 0.65% | -8.76% |
| DVA | DaVita | | Health Care | 141.84 | 46 | -1.36% | -5.16% |
| RF | Regions Financial | | Financials | 24.63 | 83 | -0.12% | 5.84% |
| CBOE | Cboe Global | | Financials | 232.06 | 66 | -0.21% | 19.12% |
| TPG | TPG | | Financials | 54.20 | 88 | 1.33% | -12.96% |
| QGEN | QIAGEN N.V | | Services & Goods | 47.96 | 58 | 0.23% | 7.63% |
| MAS | Masco | | Industrials | 66.89 | 100 | 2.04% | -7.45% |
| TAP | Molson Coors | | Consumer Staples | 49.55 | 57 | 0.34% | -12.90% |
| GPC | Genuine Parts | | Services & Goods | 125.25 | 63 | -1.13% | 8.16% |
| MPW | Medical Properties | | Financials | 4.15 | 10 | -1.89% | 6.48% |
| EXAS | Exact Sciences | | Health Care | 55.31 | 95 | 3.31% | -1.57% |
| CE | Celanese | | Materials | 60.77 | 88 | 0.68% | -12.15% |
| ALLE | Allegion | | Services & Goods | 150.06 | 90 | 1.02% | 15.30% |
| MASI | Masimo | | Health Care | 165.41 | 51 | 1.88% | 0.07% |
| For chart view version of above stock list: Chart View ➞ 0 - 25 , 25 - 50 , 50 - 75 , 75 - 100 , 100 - 125 , 125 - 150 , 150 - 175 , 175 - 200 , 200 - 225 , 225 - 250 , 250 - 275 , 275 - 300 , 300 - 325 , 325 - 350 , 350 - 375 , 375 - 400 , 400 - 425 , 425 - 450 , 450 - 475 , 475 - 500 , 500 - 525 , 525 - 550 , 550 - 575 , 575 - 600 , 600 - 625 , 625 - 650 , 650 - 675 , 675 - 700 , 700 - 725 | ||
 | Click To Change The Sort Order: By Market Cap or Company Size Performance: Year-to-date, Week and Day |  |
|
Get the most comprehensive stock market coverage daily at 12Stocks.com ➞ Best Stocks Today ➞ Best Stocks Weekly ➞ Best Stocks Year-to-Date ➞ Best Stocks Trends ➞  Best Stocks Today 12Stocks.com Best Nasdaq Stocks ➞ Best S&P 500 Stocks ➞ Best Tech Stocks ➞ Best Biotech Stocks ➞ |
| Detailed Overview of Midcap Stocks |
| Midcap Technical Overview, Leaders & Laggards, Top Midcap ETF Funds & Detailed Midcap Stocks List, Charts, Trends & More |
| Midcap: Technical Analysis, Trends & YTD Performance | |
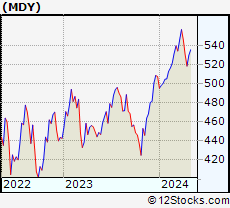
| MidCap segment as represented by
MDY, an exchange-traded fund [ETF], holds basket of about four hundred midcap stocks from across all major sectors of the US stock market. The midcap index (contains stocks like Green Mountain Coffee Roasters and Tractor Supply Company) is up by 2.37% and is currently underperforming the overall market by -4.11% year-to-date. Below is a quick view of technical charts and trends: | |
 MDY Weekly Chart |
|
| Long Term Trend: Very Good | |
| Medium Term Trend: Very Good | |
 MDY Daily Chart |
|
| Short Term Trend: Not Good | |
| Overall Trend Score: 81 | |
| YTD Performance: 2.37% | |
| **Trend Scores & Views Are Only For Educational Purposes And Not For Investing | |
| 12Stocks.com: Investing in Midcap Index using Exchange Traded Funds | |
|
The following table shows list of key exchange traded funds (ETF) that
help investors track Midcap index. The following list also includes leveraged ETF funds that track twice or thrice the daily returns of Midcap indices. Short or inverse ETF funds move in the opposite direction to the index they track and are useful during market pullbacks or during bear markets. Quick View: Move mouse or cursor over ETF symbol (ticker) to view short-term technical chart and over ETF name to view long term chart. Click on ticker or stock name for detailed view. Click on to add stock symbol to your watchlist and to view watchlist. |
12Stocks.com List of ETFs that track Midcap Index
| Ticker | ETF Name | Watchlist | Recent Price | Smart Investing & Trading Score | Change % | Week % | Year-to-date % |
| MDY | SPDR S&P MidCap 400 ETF | | 581.66 | 81 | 0.42 | -0.13 | 2.37% |
| UMDD | ProShares UltraPro MidCap400 | | 24.47 | 76 | 1.2 | -0.68 | -7.59% |
| SMDD | ProShares UltraPro Short MidCap400 | | 14.38 | 39 | -1.33 | 0.42 | 61.6% |
| MYY | ProShares Short MidCap400 | | 18.29 | 25 | -0.4 | 0.23 | -3.02% |
| MZZ | ProShares UltraShort MidCap400 | | 8.72 | 28 | -0.81 | 0.34 | -9.9% |
| 12Stocks.com: Charts, Trends, Fundamental Data and Performances of MidCap Stocks | |
|
We now take in-depth look at all MidCap stocks including charts, multi-period performances and overall trends (as measured by Smart Investing & Trading Score). One can sort MidCap stocks (click link to choose) by Daily, Weekly and by Year-to-Date performances. Also, one can sort by size of the company or by market capitalization. |
| Select Your Default Chart Type: | |||||
| |||||
| Click on stock symbol or name for detailed view. Click on to add stock symbol to your watchlist and to view watchlist. Quick View: Move mouse or cursor over "Daily" to quickly view daily technical stock chart and over "Weekly" to view weekly technical stock chart. | |||||

 | CNA CNA Financial Corporation |
| Sector: Financials | |
| SubSector: Property & Casualty Insurance | |
| MarketCap: 9123.32 Millions | |
| Recent Price: 44.54 Smart Investing & Trading Score: 0 | |
| Day Percent Change: -1.18% Day Change: -0.53 | |
| Week Change: -2.52% Year-to-date Change: -7.1% | |
| CNA Links: Profile News Message Board | |
| Charts:- Daily , Weekly | |
| Add CNA to Watchlist: View: Get Complete CNA Trend Analysis ➞ | |
 | HOLX Hologic, Inc. |
| Sector: Health Care | |
| SubSector: Medical Instruments & Supplies | |
| MarketCap: 9075.2 Millions | |
| Recent Price: 65.85 Smart Investing & Trading Score: 88 | |
| Day Percent Change: 1.46% Day Change: 0.95 | |
| Week Change: 1.65% Year-to-date Change: -8.7% | |
| HOLX Links: Profile News Message Board | |
| Charts:- Daily , Weekly | |
| Add HOLX to Watchlist: View: Get Complete HOLX Trend Analysis ➞ | |
 | JBHT J.B. Hunt Transport Services, Inc. |
| Sector: Transports | |
| SubSector: Trucking | |
| MarketCap: 9074 Millions | |
| Recent Price: 152.67 Smart Investing & Trading Score: 83 | |
| Day Percent Change: -0.25% Day Change: -0.38 | |
| Week Change: -0.14% Year-to-date Change: -10.3% | |
| JBHT Links: Profile News Message Board | |
| Charts:- Daily , Weekly | |
| Add JBHT to Watchlist: View: Get Complete JBHT Trend Analysis ➞ | |
 | FMC FMC Corporation |
| Sector: Materials | |
| SubSector: Chemicals - Major Diversified | |
| MarketCap: 9068.36 Millions | |
| Recent Price: 43.63 Smart Investing & Trading Score: 70 | |
| Day Percent Change: 0.76% Day Change: 0.33 | |
| Week Change: -1.36% Year-to-date Change: -9.0% | |
| FMC Links: Profile News Message Board | |
| Charts:- Daily , Weekly | |
| Add FMC to Watchlist: View: Get Complete FMC Trend Analysis ➞ | |
 | NI NiSource Inc. |
| Sector: Utilities | |
| SubSector: Diversified Utilities | |
| MarketCap: 9056.8 Millions | |
| Recent Price: 39.34 Smart Investing & Trading Score: 35 | |
| Day Percent Change: 0.87% Day Change: 0.34 | |
| Week Change: -0.56% Year-to-date Change: 7.8% | |
| NI Links: Profile News Message Board | |
| Charts:- Daily , Weekly | |
| Add NI to Watchlist: View: Get Complete NI Trend Analysis ➞ | |
 | BAH Booz Allen Hamilton Holding Corporation |
| Sector: Services & Goods | |
| SubSector: Management Services | |
| MarketCap: 9037.35 Millions | |
| Recent Price: 107.02 Smart Investing & Trading Score: 42 | |
| Day Percent Change: -0.51% Day Change: -0.55 | |
| Week Change: -1.75% Year-to-date Change: -16.5% | |
| BAH Links: Profile News Message Board | |
| Charts:- Daily , Weekly | |
| Add BAH to Watchlist: View: Get Complete BAH Trend Analysis ➞ | |
 | NTAP NetApp, Inc. |
| Sector: Technology | |
| SubSector: Data Storage Devices | |
| MarketCap: 9028.89 Millions | |
| Recent Price: 106.67 Smart Investing & Trading Score: 71 | |
| Day Percent Change: 0.01% Day Change: 0.01 | |
| Week Change: -0.55% Year-to-date Change: -7.1% | |
| NTAP Links: Profile News Message Board | |
| Charts:- Daily , Weekly | |
| Add NTAP to Watchlist: View: Get Complete NTAP Trend Analysis ➞ | |
 | FDS FactSet Research Systems Inc. |
| Sector: Technology | |
| SubSector: Information & Delivery Services | |
| MarketCap: 9024.37 Millions | |
| Recent Price: 447.81 Smart Investing & Trading Score: 66 | |
| Day Percent Change: 0.73% Day Change: 3.24 | |
| Week Change: -0.03% Year-to-date Change: -6.6% | |
| FDS Links: Profile News Message Board | |
| Charts:- Daily , Weekly | |
| Add FDS to Watchlist: View: Get Complete FDS Trend Analysis ➞ | |
 | TTD The Trade Desk, Inc. |
| Sector: Technology | |
| SubSector: Application Software | |
| MarketCap: 9006.92 Millions | |
| Recent Price: 75.63 Smart Investing & Trading Score: 100 | |
| Day Percent Change: 2.16% Day Change: 1.6 | |
| Week Change: 1.64% Year-to-date Change: -35.7% | |
| TTD Links: Profile News Message Board | |
| Charts:- Daily , Weekly | |
| Add TTD to Watchlist: View: Get Complete TTD Trend Analysis ➞ | |
 | APP AppLovin Corporation |
| Sector: Technology | |
| SubSector: Software - Application | |
| MarketCap: 9000 Millions | |
| Recent Price: 352.74 Smart Investing & Trading Score: 90 | |
| Day Percent Change: 2.32% Day Change: 7.99 | |
| Week Change: 3.25% Year-to-date Change: 8.9% | |
| APP Links: Profile News Message Board | |
| Charts:- Daily , Weekly | |
| Add APP to Watchlist: View: Get Complete APP Trend Analysis ➞ | |
 | IR Ingersoll Rand Inc. |
| Sector: Industrials | |
| SubSector: Diversified Machinery | |
| MarketCap: 8970.56 Millions | |
| Recent Price: 87.70 Smart Investing & Trading Score: 95 | |
| Day Percent Change: 0.79% Day Change: 0.69 | |
| Week Change: 0.83% Year-to-date Change: -3.0% | |
| IR Links: Profile News Message Board | |
| Charts:- Daily , Weekly | |
| Add IR to Watchlist: View: Get Complete IR Trend Analysis ➞ | |
 | PKG Packaging Corporation of America |
| Sector: Consumer Staples | |
| SubSector: Packaging & Containers | |
| MarketCap: 8963 Millions | |
| Recent Price: 204.08 Smart Investing & Trading Score: 95 | |
| Day Percent Change: 0.65% Day Change: 1.31 | |
| Week Change: 0.88% Year-to-date Change: -8.8% | |
| PKG Links: Profile News Message Board | |
| Charts:- Daily , Weekly | |
| Add PKG to Watchlist: View: Get Complete PKG Trend Analysis ➞ | |
 | DVA DaVita Inc. |
| Sector: Health Care | |
| SubSector: Specialized Health Services | |
| MarketCap: 8954.36 Millions | |
| Recent Price: 141.84 Smart Investing & Trading Score: 46 | |
| Day Percent Change: -1.36% Day Change: -1.96 | |
| Week Change: -0.51% Year-to-date Change: -5.2% | |
| DVA Links: Profile News Message Board | |
| Charts:- Daily , Weekly | |
| Add DVA to Watchlist: View: Get Complete DVA Trend Analysis ➞ | |
 | RF Regions Financial Corporation |
| Sector: Financials | |
| SubSector: Regional - Southeast Banks | |
| MarketCap: 8936.25 Millions | |
| Recent Price: 24.63 Smart Investing & Trading Score: 83 | |
| Day Percent Change: -0.12% Day Change: -0.03 | |
| Week Change: -0.69% Year-to-date Change: 5.8% | |
| RF Links: Profile News Message Board | |
| Charts:- Daily , Weekly | |
| Add RF to Watchlist: View: Get Complete RF Trend Analysis ➞ | |
 | CBOE Cboe Global Markets, Inc. |
| Sector: Financials | |
| SubSector: Diversified Investments | |
| MarketCap: 8834.5 Millions | |
| Recent Price: 232.06 Smart Investing & Trading Score: 66 | |
| Day Percent Change: -0.21% Day Change: -0.48 | |
| Week Change: 0.3% Year-to-date Change: 19.1% | |
| CBOE Links: Profile News Message Board | |
| Charts:- Daily , Weekly | |
| Add CBOE to Watchlist: View: Get Complete CBOE Trend Analysis ➞ | |
 | TPG TPG Inc. |
| Sector: Financials | |
| SubSector: Asset Management | |
| MarketCap: 8700 Millions | |
| Recent Price: 54.20 Smart Investing & Trading Score: 88 | |
| Day Percent Change: 1.33% Day Change: 0.71 | |
| Week Change: 0.24% Year-to-date Change: -13.0% | |
| TPG Links: Profile News Message Board | |
| Charts:- Daily , Weekly | |
| Add TPG to Watchlist: View: Get Complete TPG Trend Analysis ➞ | |
 | QGEN QIAGEN N.V. |
| Sector: Services & Goods | |
| SubSector: Research Services | |
| MarketCap: 8698.94 Millions | |
| Recent Price: 47.96 Smart Investing & Trading Score: 58 | |
| Day Percent Change: 0.23% Day Change: 0.11 | |
| Week Change: -0.79% Year-to-date Change: 7.6% | |
| QGEN Links: Profile News Message Board | |
| Charts:- Daily , Weekly | |
| Add QGEN to Watchlist: View: Get Complete QGEN Trend Analysis ➞ | |
 | MAS Masco Corporation |
| Sector: Industrials | |
| SubSector: General Building Materials | |
| MarketCap: 8655.63 Millions | |
| Recent Price: 66.89 Smart Investing & Trading Score: 100 | |
| Day Percent Change: 2.04% Day Change: 1.34 | |
| Week Change: 0.77% Year-to-date Change: -7.5% | |
| MAS Links: Profile News Message Board | |
| Charts:- Daily , Weekly | |
| Add MAS to Watchlist: View: Get Complete MAS Trend Analysis ➞ | |
 | TAP Molson Coors Beverage Company |
| Sector: Consumer Staples | |
| SubSector: Beverages - Brewers | |
| MarketCap: 8619.97 Millions | |
| Recent Price: 49.55 Smart Investing & Trading Score: 57 | |
| Day Percent Change: 0.34% Day Change: 0.17 | |
| Week Change: 0.22% Year-to-date Change: -12.9% | |
| TAP Links: Profile News Message Board | |
| Charts:- Daily , Weekly | |
| Add TAP to Watchlist: View: Get Complete TAP Trend Analysis ➞ | |
 | GPC Genuine Parts Company |
| Sector: Services & Goods | |
| SubSector: Auto Parts Stores | |
| MarketCap: 8605.9 Millions | |
| Recent Price: 125.25 Smart Investing & Trading Score: 63 | |
| Day Percent Change: -1.13% Day Change: -1.43 | |
| Week Change: -1.7% Year-to-date Change: 8.2% | |
| GPC Links: Profile News Message Board | |
| Charts:- Daily , Weekly | |
| Add GPC to Watchlist: View: Get Complete GPC Trend Analysis ➞ | |
 | MPW Medical Properties Trust, Inc. |
| Sector: Financials | |
| SubSector: REIT - Healthcare Facilities | |
| MarketCap: 8586.74 Millions | |
| Recent Price: 4.15 Smart Investing & Trading Score: 10 | |
| Day Percent Change: -1.89% Day Change: -0.08 | |
| Week Change: -5.25% Year-to-date Change: 6.5% | |
| MPW Links: Profile News Message Board | |
| Charts:- Daily , Weekly | |
| Add MPW to Watchlist: View: Get Complete MPW Trend Analysis ➞ | |
 | EXAS Exact Sciences Corporation |
| Sector: Health Care | |
| SubSector: Medical Laboratories & Research | |
| MarketCap: 8572 Millions | |
| Recent Price: 55.31 Smart Investing & Trading Score: 95 | |
| Day Percent Change: 3.31% Day Change: 1.77 | |
| Week Change: 3.65% Year-to-date Change: -1.6% | |
| EXAS Links: Profile News Message Board | |
| Charts:- Daily , Weekly | |
| Add EXAS to Watchlist: View: Get Complete EXAS Trend Analysis ➞ | |
 | CE Celanese Corporation |
| Sector: Materials | |
| SubSector: Chemicals - Major Diversified | |
| MarketCap: 8521.06 Millions | |
| Recent Price: 60.77 Smart Investing & Trading Score: 88 | |
| Day Percent Change: 0.68% Day Change: 0.41 | |
| Week Change: -0.18% Year-to-date Change: -12.2% | |
| CE Links: Profile News Message Board | |
| Charts:- Daily , Weekly | |
| Add CE to Watchlist: View: Get Complete CE Trend Analysis ➞ | |
 | ALLE Allegion plc |
| Sector: Services & Goods | |
| SubSector: Security & Protection Services | |
| MarketCap: 8515.93 Millions | |
| Recent Price: 150.06 Smart Investing & Trading Score: 90 | |
| Day Percent Change: 1.02% Day Change: 1.52 | |
| Week Change: 1.32% Year-to-date Change: 15.3% | |
| ALLE Links: Profile News Message Board | |
| Charts:- Daily , Weekly | |
| Add ALLE to Watchlist: View: Get Complete ALLE Trend Analysis ➞ | |
 | MASI Masimo Corporation |
| Sector: Health Care | |
| SubSector: Medical Instruments & Supplies | |
| MarketCap: 8493.2 Millions | |
| Recent Price: 165.41 Smart Investing & Trading Score: 51 | |
| Day Percent Change: 1.88% Day Change: 3.06 | |
| Week Change: -1.29% Year-to-date Change: 0.1% | |
| MASI Links: Profile News Message Board | |
| Charts:- Daily , Weekly | |
| Add MASI to Watchlist: View: Get Complete MASI Trend Analysis ➞ | |
| For tabular summary view of above stock list: Summary View ➞ 0 - 25 , 25 - 50 , 50 - 75 , 75 - 100 , 100 - 125 , 125 - 150 , 150 - 175 , 175 - 200 , 200 - 225 , 225 - 250 , 250 - 275 , 275 - 300 , 300 - 325 , 325 - 350 , 350 - 375 , 375 - 400 , 400 - 425 , 425 - 450 , 450 - 475 , 475 - 500 , 500 - 525 , 525 - 550 , 550 - 575 , 575 - 600 , 600 - 625 , 625 - 650 , 650 - 675 , 675 - 700 , 700 - 725 | ||
| Click To Change The Sort Order: By Market Cap or Company Size Performance: Year-to-date, Week and Day | |
| Select Chart Type: | ||
|
Best Stocks Today 12Stocks.com |
© 2025 12Stocks.com Terms & Conditions Privacy Contact Us
All Information Provided Only For Education And Not To Be Used For Investing or Trading. See Terms & Conditions


One More Thing ... Get Best Stocks Delivered Daily!
Never Ever Miss A Move With Our Top Ten Stocks Lists
Find Best Stocks In Any Market - Bull or Bear Market
Take A Peek At Our Top Ten Stocks Lists: Daily, Weekly, Year-to-Date & Top Trends
Find Best Stocks In Any Market - Bull or Bear Market
Take A Peek At Our Top Ten Stocks Lists: Daily, Weekly, Year-to-Date & Top Trends
Midcap Stocks With Best Up Trends [0-bearish to 100-bullish]: Plug Power[100], AES [100], PTC [100], TopBuild [100], D.R. Horton[100], Ultragenyx Pharmaceutical[100], Advance Auto[100], Builders FirstSource[100], Pulte [100], MongoDB [100], Capri [100]
Best Midcap Stocks Year-to-Date:
Robinhood Markets[153.73%], Avis Budget[120.57%], Hertz Global[94.81%], MP Materials[92.5%], Palantir Technologies[89.25%], Roblox [84.38%], Viasat [81.55%], Cloudflare [79.69%], SSR Mining[77.87%], Zscaler [75.43%], Celsius [75.02%] Best Midcap Stocks This Week:
Plug Power[21.09%], PTC [19.6%], QuantumScape [19.09%], AES [15.1%], Advance Auto[13.08%], Unity Software[12.32%], TopBuild [8.97%], SoFi Technologies[8.89%], Capri [7.66%], Teladoc Health[6.76%], Palantir Technologies[6.53%] Best Midcap Stocks Daily:
Plug Power[25.35%], AES [19.78%], PTC [17.65%], Apellis [7.38%], Sunrun [6.76%], TopBuild [6.14%], D.R. Horton[5.36%], Coinbase Global[5.36%], Ultragenyx Pharmaceutical[5.12%], Advance Auto[4.77%], Enphase Energy[4.67%]