
 Login Sign Up


| |||||
 |  | ||||

| 12Stocks.com Market Intelligence |
Best MidCap Stocks
|
| In a hurry? Mid Cap Stocks Lists: Performance Trends Table, Stock Charts
Sort midcap stocks: Daily, Weekly, Year-to-Date, Market Cap & Trends. Filter midcap stocks list by sector: Show all, Tech, Finance, Energy, Staples, Retail, Industrial, Materials, Utilities and HealthCare Filter midcap stocks list by size:All MidCap Large Mid-Range Small |
| 12Stocks.com Mid Cap Stocks Performances & Trends Daily | |||||||||
|
|  The overall Smart Investing & Trading Score is 71 (0-bearish to 100-bullish) which puts Mid Cap index in short term neutral to bullish trend. The Smart Investing & Trading Score from previous trading session is 76 and hence a deterioration of trend.
| ||||||||
Here are the Smart Investing & Trading Scores of the most requested mid cap stocks at 12Stocks.com (click stock name for detailed review):
|


| 12Stocks.com: Top Performing Mid Cap Index Stocks | ||||||||||||||||||||||||||||||||||||||||||||||||
 The top performing Mid Cap Index stocks year to date are
Now, more recently, over last week, the top performing Mid Cap Index stocks on the move are


|
||||||||||||||||||||||||||||||||||||||||||||||||
| 12Stocks.com: Investing in Midcap Index with Stocks | |
|
The following table helps investors and traders sort through current performance and trends (as measured by Smart Investing & Trading Score) of various
stocks in the Midcap Index. Quick View: Move mouse or cursor over stock symbol (ticker) to view short-term technical chart and over stock name to view long term chart. Click on  to add stock symbol to your watchlist and to add stock symbol to your watchlist and  to view watchlist. Click on any ticker or stock name for detailed market intelligence report for that stock. to view watchlist. Click on any ticker or stock name for detailed market intelligence report for that stock. |
12Stocks.com Performance of Stocks in Midcap Index
| Ticker | Stock Name | Watchlist | Category | Recent Price | Smart Investing & Trading Score | Change % | YTD Change% |
| IQV | IQVIA |   | Health Care | 160.13 | 56 | -1.64% | -18.51% |
| DXCM | DexCom | | Health Care | 85.33 | 59 | 2.35% | 9.72% |
| ANSS | ANSYS | | Technology | 385.85 | 100 | 3.03% | 14.38% |
| LUV | Southwest Airlines | | Transports | 37.70 | 100 | 1.54% | 12.80% |
| EIX | Edison | | Utilities | 50.96 | 35 | -0.20% | -34.50% |
| ZBH | Zimmer Biomet | | Health Care | 93.86 | 49 | 0.07% | -10.95% |
| CMI | Cummins | | Industrials | 340.22 | 95 | 0.41% | -1.94% |
| PCAR | PACCAR | | Consumer Staples | 95.89 | 56 | -1.36% | -7.53% |
| CTVA | Corteva | | Materials | 73.11 | 36 | -0.63% | 28.70% |
| RMD | ResMed | | Health Care | 254.11 | 53 | -0.11% | 11.36% |
| STT | State Street | | Financials | 110.03 | 78 | 0.43% | 13.95% |
| MKC | McCormick & | | Consumer Staples | 71.96 | 18 | 0.01% | -5.06% |
| TDG | TransDigm | | Industrials | 1574.85 | 100 | 2.06% | 24.27% |
| DTE | DTE Energy | | Utilities | 134.15 | 64 | 0.20% | 12.00% |
| HLT | Hilton Worldwide | | Services & Goods | 278.65 | 90 | 0.48% | 12.80% |
| YUM | Yum! | | Services & Goods | 147.17 | 10 | -1.75% | 10.22% |
| SPG | Simon Property | | Financials | 162.43 | 66 | 0.42% | -4.51% |
| RNG | RingCentral | | Technology | 26.50 | 26 | -1.60% | -24.31% |
| KKR | KKR | | Financials | 139.43 | 71 | -1.15% | -5.61% |
| O | Realty ome | | Financials | 58.70 | 100 | 2.69% | 12.03% |
| FAST | Fastenal | | Services & Goods | 45.07 | 59 | 4.16% | -36.62% |
| ETR | Entergy | | Utilities | 82.79 | 80 | 1.27% | 9.99% |
| FWONA | Formula One | | Services & Goods | 92.80 | 63 | 0.29% | 10.42% |
| CHD | Church & Dwight Co | | Consumer Staples | 97.07 | 25 | -1.00% | -7.04% |
| KEYS | Keysight Technologies | | Technology | 163.34 | 51 | -0.21% | 1.69% |
| For chart view version of above stock list: Chart View ➞ 0 - 25 , 25 - 50 , 50 - 75 , 75 - 100 , 100 - 125 , 125 - 150 , 150 - 175 , 175 - 200 , 200 - 225 , 225 - 250 , 250 - 275 , 275 - 300 , 300 - 325 , 325 - 350 , 350 - 375 , 375 - 400 , 400 - 425 , 425 - 450 , 450 - 475 , 475 - 500 , 500 - 525 , 525 - 550 , 550 - 575 , 575 - 600 , 600 - 625 , 625 - 650 , 650 - 675 , 675 - 700 , 700 - 725 , 725 - 750 | ||
 | Click To Change The Sort Order: By Market Cap or Company Size Performance: Year-to-date, Week and Day |  |
|
Get the most comprehensive stock market coverage daily at 12Stocks.com ➞ Best Stocks Today ➞ Best Stocks Weekly ➞ Best Stocks Year-to-Date ➞ Best Stocks Trends ➞  Best Stocks Today 12Stocks.com Best Nasdaq Stocks ➞ Best S&P 500 Stocks ➞ Best Tech Stocks ➞ Best Biotech Stocks ➞ |
| Detailed Overview of Midcap Stocks |
| Midcap Technical Overview, Leaders & Laggards, Top Midcap ETF Funds & Detailed Midcap Stocks List, Charts, Trends & More |
| Midcap: Technical Analysis, Trends & YTD Performance | |
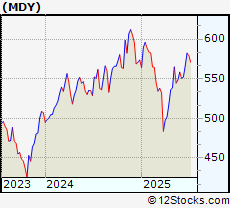
| MidCap segment as represented by
MDY, an exchange-traded fund [ETF], holds basket of about four hundred midcap stocks from across all major sectors of the US stock market. The midcap index (contains stocks like Green Mountain Coffee Roasters and Tractor Supply Company) is up by 2.29% and is currently underperforming the overall market by -4.26% year-to-date. Below is a quick view of technical charts and trends: | |
 MDY Weekly Chart |
|
| Long Term Trend: Very Good | |
| Medium Term Trend: Very Good | |
 MDY Daily Chart |
|
| Short Term Trend: Not Good | |
| Overall Trend Score: 71 | |
| YTD Performance: 2.29% | |
| **Trend Scores & Views Are Only For Educational Purposes And Not For Investing | |
| 12Stocks.com: Investing in Midcap Index using Exchange Traded Funds | |
|
The following table shows list of key exchange traded funds (ETF) that
help investors track Midcap index. The following list also includes leveraged ETF funds that track twice or thrice the daily returns of Midcap indices. Short or inverse ETF funds move in the opposite direction to the index they track and are useful during market pullbacks or during bear markets. Quick View: Move mouse or cursor over ETF symbol (ticker) to view short-term technical chart and over ETF name to view long term chart. Click on ticker or stock name for detailed view. Click on to add stock symbol to your watchlist and to view watchlist. |
12Stocks.com List of ETFs that track Midcap Index
| Ticker | ETF Name | Watchlist | Recent Price | Smart Investing & Trading Score | Change % | Week % | Year-to-date % |
| MDY | SPDR S&P MidCap 400 ETF | | 581.19 | 71 | 0.34 | 0.34 | 2.29% |
| UMDD | ProShares UltraPro MidCap400 | | 24.37 | 78 | 0.77 | 0.77 | -7.96% |
| SMDD | ProShares UltraPro Short MidCap400 | | 14.43 | 49 | -0.92 | -0.92 | 62.16% |
| MYY | ProShares Short MidCap400 | | 18.32 | 35 | -0.28 | -0.28 | -2.87% |
| MZZ | ProShares UltraShort MidCap400 | | 8.75 | 28 | -0.47 | -0.47 | -9.64% |
| 12Stocks.com: Charts, Trends, Fundamental Data and Performances of MidCap Stocks | |
|
We now take in-depth look at all MidCap stocks including charts, multi-period performances and overall trends (as measured by Smart Investing & Trading Score). One can sort MidCap stocks (click link to choose) by Daily, Weekly and by Year-to-Date performances. Also, one can sort by size of the company or by market capitalization. |
| Select Your Default Chart Type: | |||||
| |||||
| Click on stock symbol or name for detailed view. Click on to add stock symbol to your watchlist and to view watchlist. Quick View: Move mouse or cursor over "Daily" to quickly view daily technical stock chart and over "Weekly" to view weekly technical stock chart. | |||||

 | IQV IQVIA Holdings Inc. |
| Sector: Health Care | |
| SubSector: Medical Laboratories & Research | |
| MarketCap: 19616.5 Millions | |
| Recent Price: 160.13 Smart Investing & Trading Score: 56 | |
| Day Percent Change: -1.64% Day Change: -2.67 | |
| Week Change: -1.64% Year-to-date Change: -18.5% | |
| IQV Links: Profile News Message Board | |
| Charts:- Daily , Weekly | |
| Add IQV to Watchlist: View: Get Complete IQV Trend Analysis ➞ | |
 | DXCM DexCom, Inc. |
| Sector: Health Care | |
| SubSector: Medical Laboratories & Research | |
| MarketCap: 19559 Millions | |
| Recent Price: 85.33 Smart Investing & Trading Score: 59 | |
| Day Percent Change: 2.35% Day Change: 1.96 | |
| Week Change: 2.35% Year-to-date Change: 9.7% | |
| DXCM Links: Profile News Message Board | |
| Charts:- Daily , Weekly | |
| Add DXCM to Watchlist: View: Get Complete DXCM Trend Analysis ➞ | |
 | ANSS ANSYS, Inc. |
| Sector: Technology | |
| SubSector: Application Software | |
| MarketCap: 19497.4 Millions | |
| Recent Price: 385.85 Smart Investing & Trading Score: 100 | |
| Day Percent Change: 3.03% Day Change: 11.33 | |
| Week Change: 3.03% Year-to-date Change: 14.4% | |
| ANSS Links: Profile News Message Board | |
| Charts:- Daily , Weekly | |
| Add ANSS to Watchlist: View: Get Complete ANSS Trend Analysis ➞ | |
 | LUV Southwest Airlines Co. |
| Sector: Transports | |
| SubSector: Regional Airlines | |
| MarketCap: 19463.3 Millions | |
| Recent Price: 37.70 Smart Investing & Trading Score: 100 | |
| Day Percent Change: 1.54% Day Change: 0.57 | |
| Week Change: 1.54% Year-to-date Change: 12.8% | |
| LUV Links: Profile News Message Board | |
| Charts:- Daily , Weekly | |
| Add LUV to Watchlist: View: Get Complete LUV Trend Analysis ➞ | |
 | EIX Edison International |
| Sector: Utilities | |
| SubSector: Electric Utilities | |
| MarketCap: 19358.1 Millions | |
| Recent Price: 50.96 Smart Investing & Trading Score: 35 | |
| Day Percent Change: -0.2% Day Change: -0.1 | |
| Week Change: -0.2% Year-to-date Change: -34.5% | |
| EIX Links: Profile News Message Board | |
| Charts:- Daily , Weekly | |
| Add EIX to Watchlist: View: Get Complete EIX Trend Analysis ➞ | |
 | ZBH Zimmer Biomet Holdings, Inc. |
| Sector: Health Care | |
| SubSector: Medical Appliances & Equipment | |
| MarketCap: 19339.4 Millions | |
| Recent Price: 93.86 Smart Investing & Trading Score: 49 | |
| Day Percent Change: 0.07% Day Change: 0.07 | |
| Week Change: 0.07% Year-to-date Change: -11.0% | |
| ZBH Links: Profile News Message Board | |
| Charts:- Daily , Weekly | |
| Add ZBH to Watchlist: View: Get Complete ZBH Trend Analysis ➞ | |
 | CMI Cummins Inc. |
| Sector: Industrials | |
| SubSector: Diversified Machinery | |
| MarketCap: 19127.1 Millions | |
| Recent Price: 340.22 Smart Investing & Trading Score: 95 | |
| Day Percent Change: 0.41% Day Change: 1.4 | |
| Week Change: 0.41% Year-to-date Change: -1.9% | |
| CMI Links: Profile News Message Board | |
| Charts:- Daily , Weekly | |
| Add CMI to Watchlist: View: Get Complete CMI Trend Analysis ➞ | |
 | PCAR PACCAR Inc |
| Sector: Consumer Staples | |
| SubSector: Trucks & Other Vehicles | |
| MarketCap: 19117.7 Millions | |
| Recent Price: 95.89 Smart Investing & Trading Score: 56 | |
| Day Percent Change: -1.36% Day Change: -1.32 | |
| Week Change: -1.36% Year-to-date Change: -7.5% | |
| PCAR Links: Profile News Message Board | |
| Charts:- Daily , Weekly | |
| Add PCAR to Watchlist: View: Get Complete PCAR Trend Analysis ➞ | |
 | CTVA Corteva, Inc. |
| Sector: Materials | |
| SubSector: Agricultural Chemicals | |
| MarketCap: 18894.3 Millions | |
| Recent Price: 73.11 Smart Investing & Trading Score: 36 | |
| Day Percent Change: -0.63% Day Change: -0.46 | |
| Week Change: -0.63% Year-to-date Change: 28.7% | |
| CTVA Links: Profile News Message Board | |
| Charts:- Daily , Weekly | |
| Add CTVA to Watchlist: View: Get Complete CTVA Trend Analysis ➞ | |
 | RMD ResMed Inc. |
| Sector: Health Care | |
| SubSector: Medical Instruments & Supplies | |
| MarketCap: 18660.2 Millions | |
| Recent Price: 254.11 Smart Investing & Trading Score: 53 | |
| Day Percent Change: -0.11% Day Change: -0.29 | |
| Week Change: -0.11% Year-to-date Change: 11.4% | |
| RMD Links: Profile News Message Board | |
| Charts:- Daily , Weekly | |
| Add RMD to Watchlist: View: Get Complete RMD Trend Analysis ➞ | |
 | STT State Street Corporation |
| Sector: Financials | |
| SubSector: Asset Management | |
| MarketCap: 18623 Millions | |
| Recent Price: 110.03 Smart Investing & Trading Score: 78 | |
| Day Percent Change: 0.43% Day Change: 0.47 | |
| Week Change: 0.43% Year-to-date Change: 14.0% | |
| STT Links: Profile News Message Board | |
| Charts:- Daily , Weekly | |
| Add STT to Watchlist: View: Get Complete STT Trend Analysis ➞ | |
 | MKC McCormick & Company, Incorporated |
| Sector: Consumer Staples | |
| SubSector: Processed & Packaged Goods | |
| MarketCap: 18522.8 Millions | |
| Recent Price: 71.96 Smart Investing & Trading Score: 18 | |
| Day Percent Change: 0.01% Day Change: 0.01 | |
| Week Change: 0.01% Year-to-date Change: -5.1% | |
| MKC Links: Profile News Message Board | |
| Charts:- Daily , Weekly | |
| Add MKC to Watchlist: View: Get Complete MKC Trend Analysis ➞ | |
 | TDG TransDigm Group Incorporated |
| Sector: Industrials | |
| SubSector: Aerospace/Defense Products & Services | |
| MarketCap: 18441 Millions | |
| Recent Price: 1574.85 Smart Investing & Trading Score: 100 | |
| Day Percent Change: 2.06% Day Change: 31.81 | |
| Week Change: 2.06% Year-to-date Change: 24.3% | |
| TDG Links: Profile News Message Board | |
| Charts:- Daily , Weekly | |
| Add TDG to Watchlist: View: Get Complete TDG Trend Analysis ➞ | |
 | DTE DTE Energy Company |
| Sector: Utilities | |
| SubSector: Electric Utilities | |
| MarketCap: 18218.1 Millions | |
| Recent Price: 134.15 Smart Investing & Trading Score: 64 | |
| Day Percent Change: 0.2% Day Change: 0.27 | |
| Week Change: 0.2% Year-to-date Change: 12.0% | |
| DTE Links: Profile News Message Board | |
| Charts:- Daily , Weekly | |
| Add DTE to Watchlist: View: Get Complete DTE Trend Analysis ➞ | |
 | HLT Hilton Worldwide Holdings Inc. |
| Sector: Services & Goods | |
| SubSector: Lodging | |
| MarketCap: 18064.6 Millions | |
| Recent Price: 278.65 Smart Investing & Trading Score: 90 | |
| Day Percent Change: 0.48% Day Change: 1.34 | |
| Week Change: 0.48% Year-to-date Change: 12.8% | |
| HLT Links: Profile News Message Board | |
| Charts:- Daily , Weekly | |
| Add HLT to Watchlist: View: Get Complete HLT Trend Analysis ➞ | |
 | YUM Yum! Brands, Inc. |
| Sector: Services & Goods | |
| SubSector: Restaurants | |
| MarketCap: 18033.3 Millions | |
| Recent Price: 147.17 Smart Investing & Trading Score: 10 | |
| Day Percent Change: -1.75% Day Change: -2.62 | |
| Week Change: -1.75% Year-to-date Change: 10.2% | |
| YUM Links: Profile News Message Board | |
| Charts:- Daily , Weekly | |
| Add YUM to Watchlist: View: Get Complete YUM Trend Analysis ➞ | |
 | SPG Simon Property Group, Inc. |
| Sector: Financials | |
| SubSector: REIT - Retail | |
| MarketCap: 17959.6 Millions | |
| Recent Price: 162.43 Smart Investing & Trading Score: 66 | |
| Day Percent Change: 0.42% Day Change: 0.68 | |
| Week Change: 0.42% Year-to-date Change: -4.5% | |
| SPG Links: Profile News Message Board | |
| Charts:- Daily , Weekly | |
| Add SPG to Watchlist: View: Get Complete SPG Trend Analysis ➞ | |
 | RNG RingCentral, Inc. |
| Sector: Technology | |
| SubSector: Application Software | |
| MarketCap: 17755.3 Millions | |
| Recent Price: 26.50 Smart Investing & Trading Score: 26 | |
| Day Percent Change: -1.6% Day Change: -0.43 | |
| Week Change: -1.6% Year-to-date Change: -24.3% | |
| RNG Links: Profile News Message Board | |
| Charts:- Daily , Weekly | |
| Add RNG to Watchlist: View: Get Complete RNG Trend Analysis ➞ | |
 | KKR KKR & Co. Inc. |
| Sector: Financials | |
| SubSector: Asset Management | |
| MarketCap: 17722.5 Millions | |
| Recent Price: 139.43 Smart Investing & Trading Score: 71 | |
| Day Percent Change: -1.15% Day Change: -1.62 | |
| Week Change: -1.15% Year-to-date Change: -5.6% | |
| KKR Links: Profile News Message Board | |
| Charts:- Daily , Weekly | |
| Add KKR to Watchlist: View: Get Complete KKR Trend Analysis ➞ | |
 | O Realty Income Corporation |
| Sector: Financials | |
| SubSector: REIT - Retail | |
| MarketCap: 17647.4 Millions | |
| Recent Price: 58.70 Smart Investing & Trading Score: 100 | |
| Day Percent Change: 2.69% Day Change: 1.54 | |
| Week Change: 2.69% Year-to-date Change: 12.0% | |
| O Links: Profile News Message Board | |
| Charts:- Daily , Weekly | |
| Add O to Watchlist: View: Get Complete O Trend Analysis ➞ | |
 | FAST Fastenal Company |
| Sector: Services & Goods | |
| SubSector: Industrial Equipment Wholesale | |
| MarketCap: 17609.9 Millions | |
| Recent Price: 45.07 Smart Investing & Trading Score: 59 | |
| Day Percent Change: 4.16% Day Change: 1.8 | |
| Week Change: 4.16% Year-to-date Change: -36.6% | |
| FAST Links: Profile News Message Board | |
| Charts:- Daily , Weekly | |
| Add FAST to Watchlist: View: Get Complete FAST Trend Analysis ➞ | |
 | ETR Entergy Corporation |
| Sector: Utilities | |
| SubSector: Electric Utilities | |
| MarketCap: 17545 Millions | |
| Recent Price: 82.79 Smart Investing & Trading Score: 80 | |
| Day Percent Change: 1.27% Day Change: 1.04 | |
| Week Change: 1.27% Year-to-date Change: 10.0% | |
| ETR Links: Profile News Message Board | |
| Charts:- Daily , Weekly | |
| Add ETR to Watchlist: View: Get Complete ETR Trend Analysis ➞ | |
 | FWONA Formula One Group |
| Sector: Services & Goods | |
| SubSector: Broadcasting - TV | |
| MarketCap: 17485.6 Millions | |
| Recent Price: 92.80 Smart Investing & Trading Score: 63 | |
| Day Percent Change: 0.29% Day Change: 0.27 | |
| Week Change: 0.29% Year-to-date Change: 10.4% | |
| FWONA Links: Profile News Message Board | |
| Charts:- Daily , Weekly | |
| Add FWONA to Watchlist: View: Get Complete FWONA Trend Analysis ➞ | |
 | CHD Church & Dwight Co., Inc. |
| Sector: Consumer Staples | |
| SubSector: Cleaning Products | |
| MarketCap: 17425.7 Millions | |
| Recent Price: 97.07 Smart Investing & Trading Score: 25 | |
| Day Percent Change: -1% Day Change: -0.98 | |
| Week Change: -1% Year-to-date Change: -7.0% | |
| CHD Links: Profile News Message Board | |
| Charts:- Daily , Weekly | |
| Add CHD to Watchlist: View: Get Complete CHD Trend Analysis ➞ | |
 | KEYS Keysight Technologies, Inc. |
| Sector: Technology | |
| SubSector: Scientific & Technical Instruments | |
| MarketCap: 17355.1 Millions | |
| Recent Price: 163.34 Smart Investing & Trading Score: 51 | |
| Day Percent Change: -0.21% Day Change: -0.35 | |
| Week Change: -0.21% Year-to-date Change: 1.7% | |
| KEYS Links: Profile News Message Board | |
| Charts:- Daily , Weekly | |
| Add KEYS to Watchlist: View: Get Complete KEYS Trend Analysis ➞ | |
| For tabular summary view of above stock list: Summary View ➞ 0 - 25 , 25 - 50 , 50 - 75 , 75 - 100 , 100 - 125 , 125 - 150 , 150 - 175 , 175 - 200 , 200 - 225 , 225 - 250 , 250 - 275 , 275 - 300 , 300 - 325 , 325 - 350 , 350 - 375 , 375 - 400 , 400 - 425 , 425 - 450 , 450 - 475 , 475 - 500 , 500 - 525 , 525 - 550 , 550 - 575 , 575 - 600 , 600 - 625 , 625 - 650 , 650 - 675 , 675 - 700 , 700 - 725 , 725 - 750 | ||
| Click To Change The Sort Order: By Market Cap or Company Size Performance: Year-to-date, Week and Day | |
| Select Chart Type: | ||
|
Best Stocks Today 12Stocks.com |
© 2025 12Stocks.com Terms & Conditions Privacy Contact Us
All Information Provided Only For Education And Not To Be Used For Investing or Trading. See Terms & Conditions


One More Thing ... Get Best Stocks Delivered Daily!
Never Ever Miss A Move With Our Top Ten Stocks Lists
Find Best Stocks In Any Market - Bull or Bear Market
Take A Peek At Our Top Ten Stocks Lists: Daily, Weekly, Year-to-Date & Top Trends
Find Best Stocks In Any Market - Bull or Bear Market
Take A Peek At Our Top Ten Stocks Lists: Daily, Weekly, Year-to-Date & Top Trends
Midcap Stocks With Best Up Trends [0-bearish to 100-bullish]: QuantumScape [100], MP Materials[100], nCino [100], Tapestry [100], ANSYS [100], Realty ome[100], Houlihan Lokey[100], Performance Food[100], Delta Air[100], Lazard [100], Apellis [100]
Best Midcap Stocks Year-to-Date:
MP Materials[211.03%], Robinhood Markets[168.28%], Avis Budget[141.73%], Hertz Global[116.12%], Palantir Technologies[97.21%], QuantumScape [93.64%], Roblox [93.28%], SSR Mining[82.76%], Viasat [75.21%], Celsius [72.63%], Cloudflare [69.86%] Best Midcap Stocks This Week:
QuantumScape [8.88%], MP Materials[7.56%], AppLovin [6.21%], Sarepta [5.83%], Roblox [5.81%], EQT [5.33%], Freshpet [5.12%], Palantir Technologies[4.96%], Hertz Global[4.91%], Olaplex [4.86%], Ciena [4.72%] Best Midcap Stocks Daily:
QuantumScape [8.88%], MP Materials[7.56%], AppLovin [6.21%], Sarepta [5.83%], Roblox [5.81%], EQT [5.33%], Freshpet [5.12%], Palantir Technologies[4.96%], Hertz Global[4.91%], Olaplex [4.86%], Ciena [4.72%]