
 Login Sign Up


| |||||
 |  | ||||

| 12Stocks.com Market Intelligence |
Best MidCap Stocks
|
| In a hurry? Mid Cap Stocks Lists: Performance Trends Table, Stock Charts
Sort midcap stocks: Daily, Weekly, Year-to-Date, Market Cap & Trends. Filter midcap stocks list by sector: Show all, Tech, Finance, Energy, Staples, Retail, Industrial, Materials, Utilities and HealthCare Filter midcap stocks list by size:All MidCap Large Mid-Range Small |
| 12Stocks.com Mid Cap Stocks Performances & Trends Daily | |||||||||
|
|  The overall Smart Investing & Trading Score is 63 (0-bearish to 100-bullish) which puts Mid Cap index in short term neutral to bullish trend. The Smart Investing & Trading Score from previous trading session is 44 and an improvement of trend continues.
| ||||||||
Here are the Smart Investing & Trading Scores of the most requested mid cap stocks at 12Stocks.com (click stock name for detailed review):
|


| 12Stocks.com: Top Performing Mid Cap Index Stocks | ||||||||||||||||||||||||||||||||||||||||||||||||
 The top performing Mid Cap Index stocks year to date are
Now, more recently, over last week, the top performing Mid Cap Index stocks on the move are


|
||||||||||||||||||||||||||||||||||||||||||||||||
| 12Stocks.com: Investing in Midcap Index with Stocks | |
|
The following table helps investors and traders sort through current performance and trends (as measured by Smart Investing & Trading Score) of various
stocks in the Midcap Index. Quick View: Move mouse or cursor over stock symbol (ticker) to view short-term technical chart and over stock name to view long term chart. Click on  to add stock symbol to your watchlist and to add stock symbol to your watchlist and  to view watchlist. Click on any ticker or stock name for detailed market intelligence report for that stock. to view watchlist. Click on any ticker or stock name for detailed market intelligence report for that stock. |
12Stocks.com Performance of Stocks in Midcap Index
| Ticker | Stock Name | Watchlist | Category | Recent Price | Smart Investing & Trading Score | Change % | YTD Change% |
| COO | Cooper |   | Health Care | 91.68 | 32 | 1.82% | -3.10% |
| INCY | yte | | Health Care | 51.65 | 10 | -0.52% | -17.74% |
| OKTA | Okta | | Technology | 94.37 | 56 | 1.21% | 4.24% |
| NTRS | Northern Trust | | Financials | 84.18 | 68 | 0.77% | -0.24% |
| CMS | CMS Energy | | Utilities | 59.95 | 100 | -0.08% | 3.24% |
| PH | Parker-Hannifin | | Industrials | 550.40 | 63 | 1.98% | 19.47% |
| BMRN | BioMarin Pharmaceutical | | Health Care | 92.06 | 100 | 2.87% | -4.52% |
| NDAQ | Nasdaq | | Financials | 61.09 | 68 | -0.18% | 5.07% |
| AJG | Arthur J. | | Financials | 237.87 | 58 | 0.15% | 5.78% |
| MTCH | Match | | Technology | 31.69 | 15 | -0.84% | -13.18% |
| CAH | Cardinal Health | | Services & Goods | 103.37 | 0 | 0.53% | 2.55% |
| AKAM | Akamai Technologies | | Technology | 101.76 | 42 | 0.87% | -14.02% |
| CPB | Campbell Soup | | Consumer Staples | 44.96 | 87 | -0.35% | 4.00% |
| ODFL | Old Dominion | | Transports | 219.28 | 42 | 3.63% | -45.90% |
| LSXMA | Liberty SiriusXM | | Services & Goods | 25.39 | 42 | 2.30% | -11.66% |
| AGR | Avangrid | | Utilities | 36.84 | 90 | -0.57% | 13.67% |
| RIVN | Rivian Automotive | | Services & Goods | 9.03 | 35 | 2.79% | -61.46% |
| SWK | Stanley Black | | Industrials | 90.74 | 37 | 1.56% | -7.50% |
| MRVL | Marvell | | Technology | 63.86 | 17 | 1.56% | 5.89% |
| CAG | Conagra | | Consumer Staples | 31.27 | 93 | 0.55% | 9.11% |
| SWKS | Skyworks Solutions | | Technology | 99.30 | 32 | 1.21% | -11.67% |
| AMCR | Amcor | | Consumer Staples | 8.98 | 28 | -0.55% | -6.85% |
| MTB | M&T Bank | | Financials | 146.86 | 100 | 0.81% | 7.13% |
| GRMN | Garmin | | Technology | 142.51 | 63 | 1.06% | 10.87% |
| LBRDK | Liberty Broadband | | Services & Goods | 50.01 | 49 | 0.30% | -37.95% |
| For chart view version of above stock list: Chart View ➞ 0 - 25 , 25 - 50 , 50 - 75 , 75 - 100 , 100 - 125 , 125 - 150 , 150 - 175 , 175 - 200 , 200 - 225 , 225 - 250 , 250 - 275 , 275 - 300 , 300 - 325 , 325 - 350 , 350 - 375 , 375 - 400 , 400 - 425 , 425 - 450 , 450 - 475 , 475 - 500 , 500 - 525 , 525 - 550 , 550 - 575 , 575 - 600 , 600 - 625 , 625 - 650 , 650 - 675 , 675 - 700 , 700 - 725 , 725 - 750 , 750 - 775 | ||
 | Click To Change The Sort Order: By Market Cap or Company Size Performance: Year-to-date, Week and Day |  |
|
Get the most comprehensive stock market coverage daily at 12Stocks.com ➞ Best Stocks Today ➞ Best Stocks Weekly ➞ Best Stocks Year-to-Date ➞ Best Stocks Trends ➞  Best Stocks Today 12Stocks.com Best Nasdaq Stocks ➞ Best S&P 500 Stocks ➞ Best Tech Stocks ➞ Best Biotech Stocks ➞ |
| Detailed Overview of Midcap Stocks |
| Midcap Technical Overview, Leaders & Laggards, Top Midcap ETF Funds & Detailed Midcap Stocks List, Charts, Trends & More |
| Midcap: Technical Analysis, Trends & YTD Performance | |
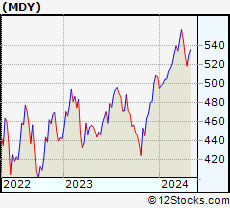
| MidCap segment as represented by
MDY, an exchange-traded fund [ETF], holds basket of about four hundred midcap stocks from across all major sectors of the US stock market. The midcap index (contains stocks like Green Mountain Coffee Roasters and Tractor Supply Company) is up by 4.42% and is currently underperforming the overall market by -1.22% year-to-date. Below is a quick view of technical charts and trends: | |
 MDY Weekly Chart |
|
| Long Term Trend: Very Good | |
| Medium Term Trend: Not Good | |
 MDY Daily Chart |
|
| Short Term Trend: Very Good | |
| Overall Trend Score: 63 | |
| YTD Performance: 4.42% | |
| **Trend Scores & Views Are Only For Educational Purposes And Not For Investing | |
| 12Stocks.com: Investing in Midcap Index using Exchange Traded Funds | |
|
The following table shows list of key exchange traded funds (ETF) that
help investors track Midcap index. The following list also includes leveraged ETF funds that track twice or thrice the daily returns of Midcap indices. Short or inverse ETF funds move in the opposite direction to the index they track and are useful during market pullbacks or during bear markets. Quick View: Move mouse or cursor over ETF symbol (ticker) to view short-term technical chart and over ETF name to view long term chart. Click on ticker or stock name for detailed view. Click on to add stock symbol to your watchlist and to view watchlist. |
12Stocks.com List of ETFs that track Midcap Index
| Ticker | ETF Name | Watchlist | Recent Price | Smart Investing & Trading Score | Change % | Week % | Year-to-date % |
| IJH | iShares Core S&P Mid-Cap | | 57.85 | 68 | 1.82 | 2.24 | 4.37% |
| IWS | iShares Russell Mid-Cap Value | | 119.86 | 68 | 0.89 | 1.88 | 3.07% |
| IWP | iShares Russell Mid-Cap Growth | | 108.63 | 58 | 1.80 | 2.77 | 3.99% |
| IWR | iShares Russell Mid-Cap | | 80.37 | 63 | 1.25 | 2.17 | 3.4% |
| MDY | SPDR S&P MidCap 400 ETF | | 529.80 | 63 | 1.20 | 2.22 | 4.42% |
| IJK | iShares S&P Mid-Cap 400 Growth | | 86.93 | 63 | 1.58 | 2.45 | 9.73% |
| IJJ | iShares S&P Mid-Cap 400 Value | | 112.47 | 63 | 0.83 | 1.74 | -1.38% |
| XMLV | PowerShares S&P MidCap Low Volatil ETF | | 54.91 | 75 | 0.68 | 1.38 | 3.25% |
| UMDD | ProShares UltraPro MidCap400 | | 24.11 | 63 | 4.06 | 6.86 | 8.02% |
| SMDD | ProShares UltraPro Short MidCap400 | | 11.65 | 32 | -3.79 | -7.26 | -13.46% |
| MVV | ProShares Ultra MidCap400 | | 61.54 | 63 | 2.07 | 4.31 | 6.31% |
| MZZ | ProShares UltraShort MidCap400 | | 11.66 | 27 | -2.51 | -4.2 | -7.24% |
| MYY | ProShares Short MidCap400 | | 20.74 | 32 | -1.09 | -2.12 | -3.33% |
| 12Stocks.com: Charts, Trends, Fundamental Data and Performances of MidCap Stocks | |
|
We now take in-depth look at all MidCap stocks including charts, multi-period performances and overall trends (as measured by Smart Investing & Trading Score). One can sort MidCap stocks (click link to choose) by Daily, Weekly and by Year-to-Date performances. Also, one can sort by size of the company or by market capitalization. |
| Select Your Default Chart Type: | |||||
| |||||
| Click on stock symbol or name for detailed view. Click on to add stock symbol to your watchlist and to view watchlist. Quick View: Move mouse or cursor over "Daily" to quickly view daily technical stock chart and over "Weekly" to view weekly technical stock chart. | |||||

 | COO The Cooper Companies, Inc. |
| Sector: Health Care | |
| SubSector: Medical Instruments & Supplies | |
| MarketCap: 15460 Millions | |
| Recent Price: 91.68 Smart Investing & Trading Score: 32 | |
| Day Percent Change: 1.82% Day Change: 1.64 | |
| Week Change: 1.39% Year-to-date Change: -3.1% | |
| COO Links: Profile News Message Board | |
| Charts:- Daily , Weekly | |
| Add COO to Watchlist: View: Get Complete COO Trend Analysis ➞ | |
 | INCY Incyte Corporation |
| Sector: Health Care | |
| SubSector: Biotechnology | |
| MarketCap: 15343.2 Millions | |
| Recent Price: 51.65 Smart Investing & Trading Score: 10 | |
| Day Percent Change: -0.52% Day Change: -0.27 | |
| Week Change: -1.34% Year-to-date Change: -17.7% | |
| INCY Links: Profile News Message Board | |
| Charts:- Daily , Weekly | |
| Add INCY to Watchlist: View: Get Complete INCY Trend Analysis ➞ | |
 | OKTA Okta, Inc. |
| Sector: Technology | |
| SubSector: Technical & System Software | |
| MarketCap: 15332.9 Millions | |
| Recent Price: 94.37 Smart Investing & Trading Score: 56 | |
| Day Percent Change: 1.21% Day Change: 1.13 | |
| Week Change: 2.51% Year-to-date Change: 4.2% | |
| OKTA Links: Profile News Message Board | |
| Charts:- Daily , Weekly | |
| Add OKTA to Watchlist: View: Get Complete OKTA Trend Analysis ➞ | |
 | NTRS Northern Trust Corporation |
| Sector: Financials | |
| SubSector: Asset Management | |
| MarketCap: 15316.8 Millions | |
| Recent Price: 84.18 Smart Investing & Trading Score: 68 | |
| Day Percent Change: 0.77% Day Change: 0.64 | |
| Week Change: 3.35% Year-to-date Change: -0.2% | |
| NTRS Links: Profile News Message Board | |
| Charts:- Daily , Weekly | |
| Add NTRS to Watchlist: View: Get Complete NTRS Trend Analysis ➞ | |
 | CMS CMS Energy Corporation |
| Sector: Utilities | |
| SubSector: Electric Utilities | |
| MarketCap: 15105.8 Millions | |
| Recent Price: 59.95 Smart Investing & Trading Score: 100 | |
| Day Percent Change: -0.08% Day Change: -0.05 | |
| Week Change: 0.67% Year-to-date Change: 3.2% | |
| CMS Links: Profile News Message Board | |
| Charts:- Daily , Weekly | |
| Add CMS to Watchlist: View: Get Complete CMS Trend Analysis ➞ | |
 | PH Parker-Hannifin Corporation |
| Sector: Industrials | |
| SubSector: Industrial Equipment & Components | |
| MarketCap: 14888.9 Millions | |
| Recent Price: 550.40 Smart Investing & Trading Score: 63 | |
| Day Percent Change: 1.98% Day Change: 10.68 | |
| Week Change: 2.95% Year-to-date Change: 19.5% | |
| PH Links: Profile News Message Board | |
| Charts:- Daily , Weekly | |
| Add PH to Watchlist: View: Get Complete PH Trend Analysis ➞ | |
 | BMRN BioMarin Pharmaceutical Inc. |
| Sector: Health Care | |
| SubSector: Biotechnology | |
| MarketCap: 14887.5 Millions | |
| Recent Price: 92.06 Smart Investing & Trading Score: 100 | |
| Day Percent Change: 2.87% Day Change: 2.57 | |
| Week Change: 3.87% Year-to-date Change: -4.5% | |
| BMRN Links: Profile News Message Board | |
| Charts:- Daily , Weekly | |
| Add BMRN to Watchlist: View: Get Complete BMRN Trend Analysis ➞ | |
 | NDAQ Nasdaq, Inc. |
| Sector: Financials | |
| SubSector: Diversified Investments | |
| MarketCap: 14885.2 Millions | |
| Recent Price: 61.09 Smart Investing & Trading Score: 68 | |
| Day Percent Change: -0.18% Day Change: -0.11 | |
| Week Change: 1.23% Year-to-date Change: 5.1% | |
| NDAQ Links: Profile News Message Board | |
| Charts:- Daily , Weekly | |
| Add NDAQ to Watchlist: View: Get Complete NDAQ Trend Analysis ➞ | |
 | AJG Arthur J. Gallagher & Co. |
| Sector: Financials | |
| SubSector: Insurance Brokers | |
| MarketCap: 14852.2 Millions | |
| Recent Price: 237.87 Smart Investing & Trading Score: 58 | |
| Day Percent Change: 0.15% Day Change: 0.35 | |
| Week Change: 0.55% Year-to-date Change: 5.8% | |
| AJG Links: Profile News Message Board | |
| Charts:- Daily , Weekly | |
| Add AJG to Watchlist: View: Get Complete AJG Trend Analysis ➞ | |
 | MTCH Match Group, Inc. |
| Sector: Technology | |
| SubSector: Internet Information Providers | |
| MarketCap: 14655.8 Millions | |
| Recent Price: 31.69 Smart Investing & Trading Score: 15 | |
| Day Percent Change: -0.84% Day Change: -0.27 | |
| Week Change: -1.52% Year-to-date Change: -13.2% | |
| MTCH Links: Profile News Message Board | |
| Charts:- Daily , Weekly | |
| Add MTCH to Watchlist: View: Get Complete MTCH Trend Analysis ➞ | |
 | CAH Cardinal Health, Inc. |
| Sector: Services & Goods | |
| SubSector: Drugs Wholesale | |
| MarketCap: 14509.9 Millions | |
| Recent Price: 103.37 Smart Investing & Trading Score: 0 | |
| Day Percent Change: 0.53% Day Change: 0.54 | |
| Week Change: -4.46% Year-to-date Change: 2.6% | |
| CAH Links: Profile News Message Board | |
| Charts:- Daily , Weekly | |
| Add CAH to Watchlist: View: Get Complete CAH Trend Analysis ➞ | |
 | AKAM Akamai Technologies, Inc. |
| Sector: Technology | |
| SubSector: Internet Information Providers | |
| MarketCap: 14495.5 Millions | |
| Recent Price: 101.76 Smart Investing & Trading Score: 42 | |
| Day Percent Change: 0.87% Day Change: 0.88 | |
| Week Change: 0.26% Year-to-date Change: -14.0% | |
| AKAM Links: Profile News Message Board | |
| Charts:- Daily , Weekly | |
| Add AKAM to Watchlist: View: Get Complete AKAM Trend Analysis ➞ | |
 | CPB Campbell Soup Company |
| Sector: Consumer Staples | |
| SubSector: Processed & Packaged Goods | |
| MarketCap: 14468.8 Millions | |
| Recent Price: 44.96 Smart Investing & Trading Score: 87 | |
| Day Percent Change: -0.35% Day Change: -0.16 | |
| Week Change: 1.72% Year-to-date Change: 4.0% | |
| CPB Links: Profile News Message Board | |
| Charts:- Daily , Weekly | |
| Add CPB to Watchlist: View: Get Complete CPB Trend Analysis ➞ | |
 | ODFL Old Dominion Freight Line, Inc. |
| Sector: Transports | |
| SubSector: Trucking | |
| MarketCap: 14457.5 Millions | |
| Recent Price: 219.28 Smart Investing & Trading Score: 42 | |
| Day Percent Change: 3.63% Day Change: 7.69 | |
| Week Change: 3.52% Year-to-date Change: -45.9% | |
| ODFL Links: Profile News Message Board | |
| Charts:- Daily , Weekly | |
| Add ODFL to Watchlist: View: Get Complete ODFL Trend Analysis ➞ | |
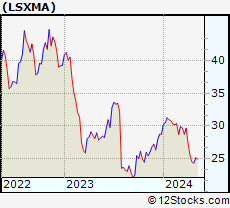 | LSXMA The Liberty SiriusXM Group |
| Sector: Services & Goods | |
| SubSector: Broadcasting - Radio | |
| MarketCap: 14414.5 Millions | |
| Recent Price: 25.39 Smart Investing & Trading Score: 42 | |
| Day Percent Change: 2.30% Day Change: 0.57 | |
| Week Change: 3.59% Year-to-date Change: -11.7% | |
| LSXMA Links: Profile News Message Board | |
| Charts:- Daily , Weekly | |
| Add LSXMA to Watchlist: View: Get Complete LSXMA Trend Analysis ➞ | |
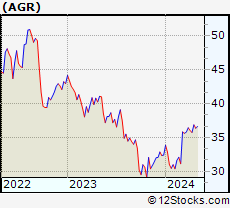 | AGR Avangrid, Inc. |
| Sector: Utilities | |
| SubSector: Gas Utilities | |
| MarketCap: 14337.3 Millions | |
| Recent Price: 36.84 Smart Investing & Trading Score: 90 | |
| Day Percent Change: -0.57% Day Change: -0.21 | |
| Week Change: -0.08% Year-to-date Change: 13.7% | |
| AGR Links: Profile News Message Board | |
| Charts:- Daily , Weekly | |
| Add AGR to Watchlist: View: Get Complete AGR Trend Analysis ➞ | |
 | RIVN Rivian Automotive, Inc. |
| Sector: Services & Goods | |
| SubSector: Auto Manufacturers | |
| MarketCap: 14310 Millions | |
| Recent Price: 9.03 Smart Investing & Trading Score: 35 | |
| Day Percent Change: 2.79% Day Change: 0.24 | |
| Week Change: 4.63% Year-to-date Change: -61.5% | |
| RIVN Links: Profile News Message Board | |
| Charts:- Daily , Weekly | |
| Add RIVN to Watchlist: View: Get Complete RIVN Trend Analysis ➞ | |
 | SWK Stanley Black & Decker, Inc. |
| Sector: Industrials | |
| SubSector: Machine Tools & Accessories | |
| MarketCap: 14274.8 Millions | |
| Recent Price: 90.74 Smart Investing & Trading Score: 37 | |
| Day Percent Change: 1.56% Day Change: 1.39 | |
| Week Change: 1.59% Year-to-date Change: -7.5% | |
| SWK Links: Profile News Message Board | |
| Charts:- Daily , Weekly | |
| Add SWK to Watchlist: View: Get Complete SWK Trend Analysis ➞ | |
 | MRVL Marvell Technology Group Ltd. |
| Sector: Technology | |
| SubSector: Semiconductor - Integrated Circuits | |
| MarketCap: 14090.4 Millions | |
| Recent Price: 63.86 Smart Investing & Trading Score: 17 | |
| Day Percent Change: 1.56% Day Change: 0.98 | |
| Week Change: 2.78% Year-to-date Change: 5.9% | |
| MRVL Links: Profile News Message Board | |
| Charts:- Daily , Weekly | |
| Add MRVL to Watchlist: View: Get Complete MRVL Trend Analysis ➞ | |
 | CAG Conagra Brands, Inc. |
| Sector: Consumer Staples | |
| SubSector: Processed & Packaged Goods | |
| MarketCap: 14084.1 Millions | |
| Recent Price: 31.27 Smart Investing & Trading Score: 93 | |
| Day Percent Change: 0.55% Day Change: 0.17 | |
| Week Change: 2.12% Year-to-date Change: 9.1% | |
| CAG Links: Profile News Message Board | |
| Charts:- Daily , Weekly | |
| Add CAG to Watchlist: View: Get Complete CAG Trend Analysis ➞ | |
 | SWKS Skyworks Solutions, Inc. |
| Sector: Technology | |
| SubSector: Semiconductor - Integrated Circuits | |
| MarketCap: 13981 Millions | |
| Recent Price: 99.30 Smart Investing & Trading Score: 32 | |
| Day Percent Change: 1.21% Day Change: 1.19 | |
| Week Change: 3.32% Year-to-date Change: -11.7% | |
| SWKS Links: Profile News Message Board | |
| Charts:- Daily , Weekly | |
| Add SWKS to Watchlist: View: Get Complete SWKS Trend Analysis ➞ | |
 | AMCR Amcor plc |
| Sector: Consumer Staples | |
| SubSector: Packaging & Containers | |
| MarketCap: 13964 Millions | |
| Recent Price: 8.98 Smart Investing & Trading Score: 28 | |
| Day Percent Change: -0.55% Day Change: -0.05 | |
| Week Change: 0.11% Year-to-date Change: -6.9% | |
| AMCR Links: Profile News Message Board | |
| Charts:- Daily , Weekly | |
| Add AMCR to Watchlist: View: Get Complete AMCR Trend Analysis ➞ | |
 | MTB M&T Bank Corporation |
| Sector: Financials | |
| SubSector: Regional - Northeast Banks | |
| MarketCap: 13950.9 Millions | |
| Recent Price: 146.86 Smart Investing & Trading Score: 100 | |
| Day Percent Change: 0.81% Day Change: 1.18 | |
| Week Change: 2.43% Year-to-date Change: 7.1% | |
| MTB Links: Profile News Message Board | |
| Charts:- Daily , Weekly | |
| Add MTB to Watchlist: View: Get Complete MTB Trend Analysis ➞ | |
 | GRMN Garmin Ltd. |
| Sector: Technology | |
| SubSector: Scientific & Technical Instruments | |
| MarketCap: 13909.3 Millions | |
| Recent Price: 142.51 Smart Investing & Trading Score: 63 | |
| Day Percent Change: 1.06% Day Change: 1.49 | |
| Week Change: 2.14% Year-to-date Change: 10.9% | |
| GRMN Links: Profile News Message Board | |
| Charts:- Daily , Weekly | |
| Add GRMN to Watchlist: View: Get Complete GRMN Trend Analysis ➞ | |
 | LBRDK Liberty Broadband Corporation |
| Sector: Services & Goods | |
| SubSector: Broadcasting - TV | |
| MarketCap: 13847.3 Millions | |
| Recent Price: 50.01 Smart Investing & Trading Score: 49 | |
| Day Percent Change: 0.30% Day Change: 0.15 | |
| Week Change: 0.26% Year-to-date Change: -38.0% | |
| LBRDK Links: Profile News Message Board | |
| Charts:- Daily , Weekly | |
| Add LBRDK to Watchlist: View: Get Complete LBRDK Trend Analysis ➞ | |
| For tabular summary view of above stock list: Summary View ➞ 0 - 25 , 25 - 50 , 50 - 75 , 75 - 100 , 100 - 125 , 125 - 150 , 150 - 175 , 175 - 200 , 200 - 225 , 225 - 250 , 250 - 275 , 275 - 300 , 300 - 325 , 325 - 350 , 350 - 375 , 375 - 400 , 400 - 425 , 425 - 450 , 450 - 475 , 475 - 500 , 500 - 525 , 525 - 550 , 550 - 575 , 575 - 600 , 600 - 625 , 625 - 650 , 650 - 675 , 675 - 700 , 700 - 725 , 725 - 750 , 750 - 775 | ||
| Click To Change The Sort Order: By Market Cap or Company Size Performance: Year-to-date, Week and Day | |
| Select Chart Type: | ||
|
Best Stocks Today 12Stocks.com |
© 2024 12Stocks.com Terms & Conditions Privacy Contact Us
All Information Provided Only For Education And Not To Be Used For Investing or Trading. See Terms & Conditions


One More Thing ... Get Best Stocks Delivered Daily!
Never Ever Miss A Move With Our Top Ten Stocks Lists
Find Best Stocks In Any Market - Bull or Bear Market
Take A Peek At Our Top Ten Stocks Lists: Daily, Weekly, Year-to-Date & Top Trends
Find Best Stocks In Any Market - Bull or Bear Market
Take A Peek At Our Top Ten Stocks Lists: Daily, Weekly, Year-to-Date & Top Trends
Midcap Stocks With Best Up Trends [0-bearish to 100-bullish]: HashiCorp [100], Ryder System[100], Quest Diagnostics[100], Hasbro [100], RLI [100], Popular [100], BioMarin Pharmaceutical[100], SLM [100], Kirby [100], Highwoods Properties[100], HEICO [100]
Best Midcap Stocks Year-to-Date:
AppLovin [78.89%], Vistra Energy[77.7%], ShockWave Medical[72.41%], Spotify [61.41%], Constellation Energy[60.75%], EMCOR [56.93%], Natera [45.34%], Pure Storage[45.26%], Wingstop [42.15%], Williams-Sonoma [41.28%], CAVA [40.73%] Best Midcap Stocks This Week:
HashiCorp [22.53%], Tandem Diabetes[14.92%], Globe Life[13.52%], Ryder System[12.23%], Coinbase Global[12.04%], MongoDB [11.91%], Spotify [9.96%], Kohl s[9.53%], Medpace [9.49%], Repligen [9%], GitLab [8.91%] Best Midcap Stocks Daily:
HashiCorp [19.54%], Globe Life[14.11%], Ryder System[11.94%], Spotify [11.41%], Tandem Diabetes[10.11%], Repligen [8.76%], Medpace [8.21%], Viasat [7.99%], MongoDB [7.69%], GitLab [6.80%], Lucid [6.11%]