
 Login Sign Up


| |||||
 |  | ||||

| 12Stocks.com Market Intelligence |
Best MidCap Stocks
|
| In a hurry? Mid Cap Stocks Lists: Performance Trends Table, Stock Charts
Sort midcap stocks: Daily, Weekly, Year-to-Date, Market Cap & Trends. Filter midcap stocks list by sector: Show all, Tech, Finance, Energy, Staples, Retail, Industrial, Materials, Utilities and HealthCare Filter midcap stocks list by size:All MidCap Large Mid-Range Small |
| 12Stocks.com Mid Cap Stocks Performances & Trends Daily | |||||||||
|
|  The overall Smart Investing & Trading Score is 70 (0-bearish to 100-bullish) which puts Mid Cap index in short term neutral to bullish trend. The Smart Investing & Trading Score from previous trading session is 56 and hence an improvement of trend.
| ||||||||
Here are the Smart Investing & Trading Scores of the most requested mid cap stocks at 12Stocks.com (click stock name for detailed review):
|


| 12Stocks.com: Top Performing Mid Cap Index Stocks | ||||||||||||||||||||||||||||||||||||||||||||||||
 The top performing Mid Cap Index stocks year to date are
Now, more recently, over last week, the top performing Mid Cap Index stocks on the move are


|
||||||||||||||||||||||||||||||||||||||||||||||||
| 12Stocks.com: Investing in Midcap Index with Stocks | |
|
The following table helps investors and traders sort through current performance and trends (as measured by Smart Investing & Trading Score) of various
stocks in the Midcap Index. Quick View: Move mouse or cursor over stock symbol (ticker) to view short-term technical chart and over stock name to view long term chart. Click on  to add stock symbol to your watchlist and to add stock symbol to your watchlist and  to view watchlist. Click on any ticker or stock name for detailed market intelligence report for that stock. to view watchlist. Click on any ticker or stock name for detailed market intelligence report for that stock. |
12Stocks.com Performance of Stocks in Midcap Index
| Ticker | Stock Name | Watchlist | Category | Recent Price | Smart Investing & Trading Score | Change % | YTD Change% |
| AWI | Armstrong World |   | Industrials | 118.94 | 85 | 1.67% | 20.97% |
| PII | Polaris | | Consumer Staples | 85.37 | 25 | 1.86% | -9.92% |
| BRX | Brixmor Property | | Financials | 21.91 | 57 | 0.87% | -5.84% |
| CFR | Cullen/Frost Bankers | | Financials | 106.83 | 30 | -0.23% | -1.53% |
| RLI | RLI | | Financials | 143.68 | 68 | -0.33% | 7.93% |
| IART | Integra LifeSciences | | Health Care | 29.12 | 27 | 2.75% | -33.13% |
| W | Wayfair | | Services & Goods | 51.47 | 43 | -1.05% | -16.59% |
| RBA | Ritchie Bros. | | Services & Goods | 73.39 | 63 | 0.29% | 9.72% |
| MANH | Manhattan Associates | | Technology | 208.84 | 32 | -0.09% | -3.01% |
| PLNT | Planet Fitness | | Services & Goods | 60.83 | 45 | 0.93% | -16.67% |
| STWD | Starwood Property | | Financials | 19.59 | 64 | 0.49% | -6.78% |
| MAN | Manpower | | Services & Goods | 76.74 | 88 | 1.17% | -3.44% |
| CHH | Choice Hotels | | Services & Goods | 120.09 | 49 | 0.87% | 5.99% |
| EME | EMCOR | | Industrials | 357.86 | 90 | 1.08% | 66.11% |
| FTI | TechnipFMC | | Energy | 26.47 | 90 | -0.47% | 31.41% |
| DECK | Deckers | | Consumer Staples | 844.86 | 75 | 1.37% | 26.39% |
| AGCO | AGCO | | Industrials | 119.24 | 47 | 2.26% | -1.79% |
| SAIC | Science Applications | | Technology | 131.10 | 90 | 1.26% | 5.45% |
| NTNX | Nutanix | | Technology | 62.18 | 58 | 0.84% | 30.38% |
| WSM | Williams-Sonoma | | Services & Goods | 284.24 | 68 | 0.74% | 40.87% |
| TNDM | Tandem Diabetes | | Health Care | 37.73 | 100 | 7.07% | 27.55% |
| AYI | Acuity | | Technology | 254.34 | 56 | 0.86% | 24.17% |
| HLI | Houlihan Lokey | | Financials | 127.58 | 88 | 0.69% | 6.40% |
| JWN | Nordstrom | | Services & Goods | 19.34 | 86 | 1.10% | 4.82% |
| GPK | Graphic Packaging | | Consumer Staples | 27.73 | 83 | 0.74% | 12.52% |
| For chart view version of above stock list: Chart View ➞ 0 - 25 , 25 - 50 , 50 - 75 , 75 - 100 , 100 - 125 , 125 - 150 , 150 - 175 , 175 - 200 , 200 - 225 , 225 - 250 , 250 - 275 , 275 - 300 , 300 - 325 , 325 - 350 , 350 - 375 , 375 - 400 , 400 - 425 , 425 - 450 , 450 - 475 , 475 - 500 , 500 - 525 , 525 - 550 , 550 - 575 , 575 - 600 , 600 - 625 , 625 - 650 , 650 - 675 , 675 - 700 , 700 - 725 | ||
 | Click To Change The Sort Order: By Market Cap or Company Size Performance: Year-to-date, Week and Day |  |
|
Get the most comprehensive stock market coverage daily at 12Stocks.com ➞ Best Stocks Today ➞ Best Stocks Weekly ➞ Best Stocks Year-to-Date ➞ Best Stocks Trends ➞  Best Stocks Today 12Stocks.com Best Nasdaq Stocks ➞ Best S&P 500 Stocks ➞ Best Tech Stocks ➞ Best Biotech Stocks ➞ |
| Detailed Overview of Midcap Stocks |
| Midcap Technical Overview, Leaders & Laggards, Top Midcap ETF Funds & Detailed Midcap Stocks List, Charts, Trends & More |
| Midcap: Technical Analysis, Trends & YTD Performance | |
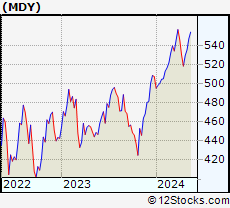
| MidCap segment as represented by
MDY, an exchange-traded fund [ETF], holds basket of about four hundred midcap stocks from across all major sectors of the US stock market. The midcap index (contains stocks like Green Mountain Coffee Roasters and Tractor Supply Company) is up by 4.92% and is currently underperforming the overall market by -1.58% year-to-date. Below is a quick view of technical charts and trends: | |
 MDY Weekly Chart |
|
| Long Term Trend: Very Good | |
| Medium Term Trend: Good | |
 MDY Daily Chart |
|
| Short Term Trend: Very Good | |
| Overall Trend Score: 70 | |
| YTD Performance: 4.92% | |
| **Trend Scores & Views Are Only For Educational Purposes And Not For Investing | |
| 12Stocks.com: Investing in Midcap Index using Exchange Traded Funds | |
|
The following table shows list of key exchange traded funds (ETF) that
help investors track Midcap index. The following list also includes leveraged ETF funds that track twice or thrice the daily returns of Midcap indices. Short or inverse ETF funds move in the opposite direction to the index they track and are useful during market pullbacks or during bear markets. Quick View: Move mouse or cursor over ETF symbol (ticker) to view short-term technical chart and over ETF name to view long term chart. Click on ticker or stock name for detailed view. Click on to add stock symbol to your watchlist and to view watchlist. |
12Stocks.com List of ETFs that track Midcap Index
| Ticker | ETF Name | Watchlist | Recent Price | Smart Investing & Trading Score | Change % | Week % | Year-to-date % |
| IWR | iShares Russell Mid-Cap | | 80.94 | 75 | 0.52 | 0.52 | 4.12% |
| IJH | iShares Core S&P Mid-Cap | | 58.08 | 75 | 0.44 | 0.44 | 4.77% |
| IWP | iShares Russell Mid-Cap Growth | | 109.38 | 78 | 0.37 | 0.37 | 4.71% |
| IWS | iShares Russell Mid-Cap Value | | 120.78 | 75 | 0.66 | 0.66 | 3.86% |
| MDY | SPDR S&P MidCap 400 ETF | | 532.34 | 70 | 0.56 | 0.56 | 4.92% |
| IJK | iShares S&P Mid-Cap 400 Growth | | 87.42 | 70 | 0.48 | 0.48 | 10.35% |
| IJJ | iShares S&P Mid-Cap 400 Value | | 113.04 | 88 | 0.72 | 0.72 | -0.88% |
| UMDD | ProShares UltraPro MidCap400 | | 24.34 | 78 | 1.59 | 1.59 | 9.05% |
| XMLV | PowerShares S&P MidCap Low Volatil ETF | | 54.95 | 83 | 0.54 | 0.54 | 3.32% |
| MYY | ProShares Short MidCap400 | | 20.64 | 25 | -0.72 | -0.72 | -3.8% |
| MZZ | ProShares UltraShort MidCap400 | | 11.67 | 27 | -0.09 | -0.09 | -7.17% |
| MVV | ProShares Ultra MidCap400 | | 62.18 | 83 | 1.22 | 1.22 | 7.41% |
| SMDD | ProShares UltraPro Short MidCap400 | | 11.65 | 10 | -1.52 | -1.52 | -13.47% |
| 12Stocks.com: Charts, Trends, Fundamental Data and Performances of MidCap Stocks | |
|
We now take in-depth look at all MidCap stocks including charts, multi-period performances and overall trends (as measured by Smart Investing & Trading Score). One can sort MidCap stocks (click link to choose) by Daily, Weekly and by Year-to-Date performances. Also, one can sort by size of the company or by market capitalization. |
| Select Your Default Chart Type: | |||||
| |||||
| Click on stock symbol or name for detailed view. Click on to add stock symbol to your watchlist and to view watchlist. Quick View: Move mouse or cursor over "Daily" to quickly view daily technical stock chart and over "Weekly" to view weekly technical stock chart. | |||||

 | AWI Armstrong World Industries, Inc. |
| Sector: Industrials | |
| SubSector: General Building Materials | |
| MarketCap: 3609.53 Millions | |
| Recent Price: 118.94 Smart Investing & Trading Score: 85 | |
| Day Percent Change: 1.67% Day Change: 1.95 | |
| Week Change: 1.67% Year-to-date Change: 21.0% | |
| AWI Links: Profile News Message Board | |
| Charts:- Daily , Weekly | |
| Add AWI to Watchlist: View: Get Complete AWI Trend Analysis ➞ | |
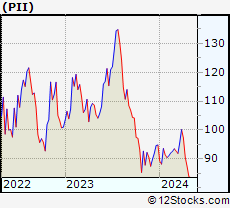 | PII Polaris Inc. |
| Sector: Consumer Staples | |
| SubSector: Recreational Vehicles | |
| MarketCap: 3589.29 Millions | |
| Recent Price: 85.37 Smart Investing & Trading Score: 25 | |
| Day Percent Change: 1.86% Day Change: 1.56 | |
| Week Change: 1.86% Year-to-date Change: -9.9% | |
| PII Links: Profile News Message Board | |
| Charts:- Daily , Weekly | |
| Add PII to Watchlist: View: Get Complete PII Trend Analysis ➞ | |
 | BRX Brixmor Property Group Inc. |
| Sector: Financials | |
| SubSector: REIT - Retail | |
| MarketCap: 3561.54 Millions | |
| Recent Price: 21.91 Smart Investing & Trading Score: 57 | |
| Day Percent Change: 0.87% Day Change: 0.19 | |
| Week Change: 0.87% Year-to-date Change: -5.8% | |
| BRX Links: Profile News Message Board | |
| Charts:- Daily , Weekly | |
| Add BRX to Watchlist: View: Get Complete BRX Trend Analysis ➞ | |
 | CFR Cullen/Frost Bankers, Inc. |
| Sector: Financials | |
| SubSector: Regional - Southwest Banks | |
| MarketCap: 3536.75 Millions | |
| Recent Price: 106.83 Smart Investing & Trading Score: 30 | |
| Day Percent Change: -0.23% Day Change: -0.25 | |
| Week Change: -0.23% Year-to-date Change: -1.5% | |
| CFR Links: Profile News Message Board | |
| Charts:- Daily , Weekly | |
| Add CFR to Watchlist: View: Get Complete CFR Trend Analysis ➞ | |
 | RLI RLI Corp. |
| Sector: Financials | |
| SubSector: Property & Casualty Insurance | |
| MarketCap: 3534.92 Millions | |
| Recent Price: 143.68 Smart Investing & Trading Score: 68 | |
| Day Percent Change: -0.33% Day Change: -0.47 | |
| Week Change: -0.33% Year-to-date Change: 7.9% | |
| RLI Links: Profile News Message Board | |
| Charts:- Daily , Weekly | |
| Add RLI to Watchlist: View: Get Complete RLI Trend Analysis ➞ | |
 | IART Integra LifeSciences Holdings Corporation |
| Sector: Health Care | |
| SubSector: Medical Instruments & Supplies | |
| MarketCap: 3510.4 Millions | |
| Recent Price: 29.12 Smart Investing & Trading Score: 27 | |
| Day Percent Change: 2.75% Day Change: 0.78 | |
| Week Change: 2.75% Year-to-date Change: -33.1% | |
| IART Links: Profile News Message Board | |
| Charts:- Daily , Weekly | |
| Add IART to Watchlist: View: Get Complete IART Trend Analysis ➞ | |
 | W Wayfair Inc. |
| Sector: Services & Goods | |
| SubSector: Catalog & Mail Order Houses | |
| MarketCap: 3497.02 Millions | |
| Recent Price: 51.47 Smart Investing & Trading Score: 43 | |
| Day Percent Change: -1.05% Day Change: -0.54 | |
| Week Change: -1.05% Year-to-date Change: -16.6% | |
| W Links: Profile News Message Board | |
| Charts:- Daily , Weekly | |
| Add W to Watchlist: View: Get Complete W Trend Analysis ➞ | |
 | RBA Ritchie Bros. Auctioneers Incorporated |
| Sector: Services & Goods | |
| SubSector: Business Services | |
| MarketCap: 3491.02 Millions | |
| Recent Price: 73.39 Smart Investing & Trading Score: 63 | |
| Day Percent Change: 0.29% Day Change: 0.21 | |
| Week Change: 0.29% Year-to-date Change: 9.7% | |
| RBA Links: Profile News Message Board | |
| Charts:- Daily , Weekly | |
| Add RBA to Watchlist: View: Get Complete RBA Trend Analysis ➞ | |
 | MANH Manhattan Associates, Inc. |
| Sector: Technology | |
| SubSector: Application Software | |
| MarketCap: 3487.02 Millions | |
| Recent Price: 208.84 Smart Investing & Trading Score: 32 | |
| Day Percent Change: -0.09% Day Change: -0.18 | |
| Week Change: -0.09% Year-to-date Change: -3.0% | |
| MANH Links: Profile News Message Board | |
| Charts:- Daily , Weekly | |
| Add MANH to Watchlist: View: Get Complete MANH Trend Analysis ➞ | |
 | PLNT Planet Fitness, Inc. |
| Sector: Services & Goods | |
| SubSector: Sporting Activities | |
| MarketCap: 3485.94 Millions | |
| Recent Price: 60.83 Smart Investing & Trading Score: 45 | |
| Day Percent Change: 0.93% Day Change: 0.56 | |
| Week Change: 0.93% Year-to-date Change: -16.7% | |
| PLNT Links: Profile News Message Board | |
| Charts:- Daily , Weekly | |
| Add PLNT to Watchlist: View: Get Complete PLNT Trend Analysis ➞ | |
 | STWD Starwood Property Trust, Inc. |
| Sector: Financials | |
| SubSector: Mortgage Investment | |
| MarketCap: 3447.09 Millions | |
| Recent Price: 19.59 Smart Investing & Trading Score: 64 | |
| Day Percent Change: 0.49% Day Change: 0.09 | |
| Week Change: 0.49% Year-to-date Change: -6.8% | |
| STWD Links: Profile News Message Board | |
| Charts:- Daily , Weekly | |
| Add STWD to Watchlist: View: Get Complete STWD Trend Analysis ➞ | |
 | MAN ManpowerGroup Inc. |
| Sector: Services & Goods | |
| SubSector: Staffing & Outsourcing Services | |
| MarketCap: 3436.28 Millions | |
| Recent Price: 76.74 Smart Investing & Trading Score: 88 | |
| Day Percent Change: 1.17% Day Change: 0.89 | |
| Week Change: 1.17% Year-to-date Change: -3.4% | |
| MAN Links: Profile News Message Board | |
| Charts:- Daily , Weekly | |
| Add MAN to Watchlist: View: Get Complete MAN Trend Analysis ➞ | |
 | CHH Choice Hotels International, Inc. |
| Sector: Services & Goods | |
| SubSector: Lodging | |
| MarketCap: 3427.56 Millions | |
| Recent Price: 120.09 Smart Investing & Trading Score: 49 | |
| Day Percent Change: 0.87% Day Change: 1.04 | |
| Week Change: 0.87% Year-to-date Change: 6.0% | |
| CHH Links: Profile News Message Board | |
| Charts:- Daily , Weekly | |
| Add CHH to Watchlist: View: Get Complete CHH Trend Analysis ➞ | |
 | EME EMCOR Group, Inc. |
| Sector: Industrials | |
| SubSector: General Contractors | |
| MarketCap: 3417.83 Millions | |
| Recent Price: 357.86 Smart Investing & Trading Score: 90 | |
| Day Percent Change: 1.08% Day Change: 3.84 | |
| Week Change: 1.08% Year-to-date Change: 66.1% | |
| EME Links: Profile News Message Board | |
| Charts:- Daily , Weekly | |
| Add EME to Watchlist: View: Get Complete EME Trend Analysis ➞ | |
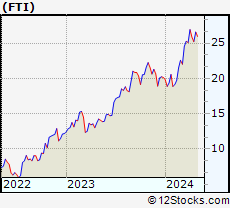 | FTI TechnipFMC plc |
| Sector: Energy | |
| SubSector: Oil & Gas Equipment & Services | |
| MarketCap: 3406.71 Millions | |
| Recent Price: 26.47 Smart Investing & Trading Score: 90 | |
| Day Percent Change: -0.47% Day Change: -0.13 | |
| Week Change: -0.47% Year-to-date Change: 31.4% | |
| FTI Links: Profile News Message Board | |
| Charts:- Daily , Weekly | |
| Add FTI to Watchlist: View: Get Complete FTI Trend Analysis ➞ | |
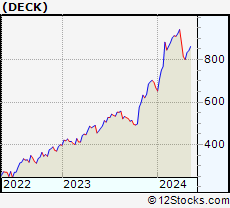 | DECK Deckers Outdoor Corporation |
| Sector: Consumer Staples | |
| SubSector: Textile - Apparel Footwear & Accessories | |
| MarketCap: 3401.6 Millions | |
| Recent Price: 844.86 Smart Investing & Trading Score: 75 | |
| Day Percent Change: 1.37% Day Change: 11.40 | |
| Week Change: 1.37% Year-to-date Change: 26.4% | |
| DECK Links: Profile News Message Board | |
| Charts:- Daily , Weekly | |
| Add DECK to Watchlist: View: Get Complete DECK Trend Analysis ➞ | |
 | AGCO AGCO Corporation |
| Sector: Industrials | |
| SubSector: Farm & Construction Machinery | |
| MarketCap: 3399.57 Millions | |
| Recent Price: 119.24 Smart Investing & Trading Score: 47 | |
| Day Percent Change: 2.26% Day Change: 2.63 | |
| Week Change: 2.26% Year-to-date Change: -1.8% | |
| AGCO Links: Profile News Message Board | |
| Charts:- Daily , Weekly | |
| Add AGCO to Watchlist: View: Get Complete AGCO Trend Analysis ➞ | |
 | SAIC Science Applications International Corporation |
| Sector: Technology | |
| SubSector: Information Technology Services | |
| MarketCap: 3388.78 Millions | |
| Recent Price: 131.10 Smart Investing & Trading Score: 90 | |
| Day Percent Change: 1.26% Day Change: 1.63 | |
| Week Change: 1.26% Year-to-date Change: 5.5% | |
| SAIC Links: Profile News Message Board | |
| Charts:- Daily , Weekly | |
| Add SAIC to Watchlist: View: Get Complete SAIC Trend Analysis ➞ | |
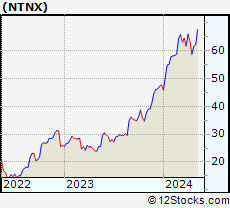 | NTNX Nutanix, Inc. |
| Sector: Technology | |
| SubSector: Technical & System Software | |
| MarketCap: 3376.6 Millions | |
| Recent Price: 62.18 Smart Investing & Trading Score: 58 | |
| Day Percent Change: 0.84% Day Change: 0.52 | |
| Week Change: 0.84% Year-to-date Change: 30.4% | |
| NTNX Links: Profile News Message Board | |
| Charts:- Daily , Weekly | |
| Add NTNX to Watchlist: View: Get Complete NTNX Trend Analysis ➞ | |
 | WSM Williams-Sonoma, Inc. |
| Sector: Services & Goods | |
| SubSector: Home Furnishing Stores | |
| MarketCap: 3370.05 Millions | |
| Recent Price: 284.24 Smart Investing & Trading Score: 68 | |
| Day Percent Change: 0.74% Day Change: 2.08 | |
| Week Change: 0.74% Year-to-date Change: 40.9% | |
| WSM Links: Profile News Message Board | |
| Charts:- Daily , Weekly | |
| Add WSM to Watchlist: View: Get Complete WSM Trend Analysis ➞ | |
 | TNDM Tandem Diabetes Care, Inc. |
| Sector: Health Care | |
| SubSector: Medical Instruments & Supplies | |
| MarketCap: 3359.1 Millions | |
| Recent Price: 37.73 Smart Investing & Trading Score: 100 | |
| Day Percent Change: 7.07% Day Change: 2.49 | |
| Week Change: 7.07% Year-to-date Change: 27.6% | |
| TNDM Links: Profile News Message Board | |
| Charts:- Daily , Weekly | |
| Add TNDM to Watchlist: View: Get Complete TNDM Trend Analysis ➞ | |
 | AYI Acuity Brands, Inc. |
| Sector: Technology | |
| SubSector: Diversified Electronics | |
| MarketCap: 3356.66 Millions | |
| Recent Price: 254.34 Smart Investing & Trading Score: 56 | |
| Day Percent Change: 0.86% Day Change: 2.18 | |
| Week Change: 0.86% Year-to-date Change: 24.2% | |
| AYI Links: Profile News Message Board | |
| Charts:- Daily , Weekly | |
| Add AYI to Watchlist: View: Get Complete AYI Trend Analysis ➞ | |
 | HLI Houlihan Lokey, Inc. |
| Sector: Financials | |
| SubSector: Investment Brokerage - National | |
| MarketCap: 3352.65 Millions | |
| Recent Price: 127.58 Smart Investing & Trading Score: 88 | |
| Day Percent Change: 0.69% Day Change: 0.88 | |
| Week Change: 0.69% Year-to-date Change: 6.4% | |
| HLI Links: Profile News Message Board | |
| Charts:- Daily , Weekly | |
| Add HLI to Watchlist: View: Get Complete HLI Trend Analysis ➞ | |
 | JWN Nordstrom, Inc. |
| Sector: Services & Goods | |
| SubSector: Apparel Stores | |
| MarketCap: 3351.68 Millions | |
| Recent Price: 19.34 Smart Investing & Trading Score: 86 | |
| Day Percent Change: 1.10% Day Change: 0.21 | |
| Week Change: 1.1% Year-to-date Change: 4.8% | |
| JWN Links: Profile News Message Board | |
| Charts:- Daily , Weekly | |
| Add JWN to Watchlist: View: Get Complete JWN Trend Analysis ➞ | |
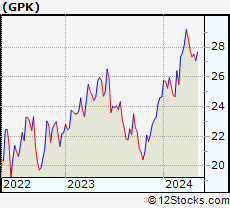 | GPK Graphic Packaging Holding Company |
| Sector: Consumer Staples | |
| SubSector: Packaging & Containers | |
| MarketCap: 3350.23 Millions | |
| Recent Price: 27.73 Smart Investing & Trading Score: 83 | |
| Day Percent Change: 0.74% Day Change: 0.20 | |
| Week Change: 0.74% Year-to-date Change: 12.5% | |
| GPK Links: Profile News Message Board | |
| Charts:- Daily , Weekly | |
| Add GPK to Watchlist: View: Get Complete GPK Trend Analysis ➞ | |
| For tabular summary view of above stock list: Summary View ➞ 0 - 25 , 25 - 50 , 50 - 75 , 75 - 100 , 100 - 125 , 125 - 150 , 150 - 175 , 175 - 200 , 200 - 225 , 225 - 250 , 250 - 275 , 275 - 300 , 300 - 325 , 325 - 350 , 350 - 375 , 375 - 400 , 400 - 425 , 425 - 450 , 450 - 475 , 475 - 500 , 500 - 525 , 525 - 550 , 550 - 575 , 575 - 600 , 600 - 625 , 625 - 650 , 650 - 675 , 675 - 700 , 700 - 725 | ||
| Click To Change The Sort Order: By Market Cap or Company Size Performance: Year-to-date, Week and Day | |
| Select Chart Type: | ||
|
Best Stocks Today 12Stocks.com |
© 2024 12Stocks.com Terms & Conditions Privacy Contact Us
All Information Provided Only For Education And Not To Be Used For Investing or Trading. See Terms & Conditions


One More Thing ... Get Best Stocks Delivered Daily!
Never Ever Miss A Move With Our Top Ten Stocks Lists
Find Best Stocks In Any Market - Bull or Bear Market
Take A Peek At Our Top Ten Stocks Lists: Daily, Weekly, Year-to-Date & Top Trends
Find Best Stocks In Any Market - Bull or Bear Market
Take A Peek At Our Top Ten Stocks Lists: Daily, Weekly, Year-to-Date & Top Trends
Midcap Stocks With Best Up Trends [0-bearish to 100-bullish]: Tandem Diabetes[100], Albemarle [100], Quest Diagnostics[100], Domino s[100], Lazard [100], Aptar [100], LPL Financial[100], Cognex [100], United [100], Owens Corning[100], Highwoods Properties[100]
Best Midcap Stocks Year-to-Date:
Vistra Energy[98.34%], ShockWave Medical[72.86%], EMCOR [66.11%], Spotify [51.73%], Wingstop [50.21%], Natera [49.38%], Antero Resources[48.85%], Pure Storage[47.67%], NRG Energy[43.17%], Interactive Brokers[41.47%], Williams-Sonoma [40.87%] Best Midcap Stocks This Week:
Tandem Diabetes[7.07%], Sunrun [6.46%], Hertz Global[6.45%], Albemarle [6.36%], Liberty SiriusXM[5.31%], Petco Health[5.3%], Liberty SiriusXM[5.21%], Quest Diagnostics[5.18%], Vistra Energy[5.09%], Sirius XM[4.97%], Biogen [4.61%] Best Midcap Stocks Daily:
Tandem Diabetes[7.07%], Sunrun [6.46%], Hertz Global[6.45%], Albemarle [6.36%], Liberty SiriusXM[5.31%], Petco Health[5.30%], Liberty SiriusXM[5.21%], Quest Diagnostics[5.18%], Vistra Energy[5.09%], Sirius XM[4.97%], Biogen [4.61%]