
 Login Sign Up


| |||||
 |  | ||||

| 12Stocks.com Market Intelligence |
Best Latin America Stocks
|
|
| Quick Read: Top Latin America Stocks By Performances & Trends: Daily, Weekly, Year-to-Date, Market Cap (Size) & Technical Trends | |||
| Best Latin America Views: Quick Browse View, Summary & Slide Show | |||
| 12Stocks.com Latin America Stocks Performances & Trends Daily | |||||||||
|
|  The overall market intelligence score is 7 (0-bearish to 100-bullish) which puts Latin America index in short term bearish trend. The market intelligence score from previous trading session is 0 and hence an improvement of trend.
| ||||||||
| Here are the market intelligence trend scores of the most requested Latin America stocks at 12Stocks.com (click stock name for detailed review): | |
| Scroll down this page for most comprehensive review of Latin America stocks by performance, trends, technical analysis, charts, fund plays & more | |


| 12Stocks.com: Top Performing Latin America Index Stocks | ||||||||||||||||||||||||||||||||||||||||||||||||
 The top performing Latin America Index stocks year to date are
Now, more recently, over last week, the top performing Latin America Index stocks on the move are


|
||||||||||||||||||||||||||||||||||||||||||||||||
| 12Stocks.com: Investing in Latin America Index with Stocks | |
|
The following table helps investors and traders sort through current performance and trends (as measured by market intelligence score) of various
stocks in the Latin America Index. Quick View: Move mouse or cursor over stock symbol (ticker) to view short-term technical chart and over stock name to view long term chart. Click on  to add stock symbol to your watchlist and to add stock symbol to your watchlist and  to view watchlist. Click on any ticker or stock name for detailed market intelligence report for that stock. to view watchlist. Click on any ticker or stock name for detailed market intelligence report for that stock. |
12Stocks.com Performance of Stocks in Latin America Index
| Ticker | Stock Name | Watchlist | Category | Recent Price | Market Intelligence Score | Change % | YTD Change% |
| VOXR | Vox Royalty |   | Materials | 2.02 | 36 | 0.75 | -2.18% |
| CBD | Companhia Brasileira | | Services & Goods | 0.46 | 20 | 0.75 | -42.63% |
| VTMX | Vesta Financials | | Financials | 35.08 | 17 | 0.66 | -11.78% |
| FSM | Fortuna Silver | | Materials | 4.57 | 76 | 0.66 | 18.39% |
| GTE | Gran Tierra | | Energy | 8.05 | 71 | 0.63 | 42.73% |
| SSRM | SSR Mining | | Materials | 5.07 | 35 | 0.60 | -52.88% |
| HBM | Hudbay Minerals | | Materials | 7.61 | 78 | 0.53 | 37.86% |
| PAAS | Pan American | | Materials | 18.90 | 75 | 0.53 | 15.74% |
| BNS | Bank of Nova Scotia | | Financials | 46.62 | 15 | 0.52 | -4.25% |
| EMX | EMX Royalty | | Materials | 1.93 | 56 | 0.52 | 19.14% |
| TU | TELUS | | Technology | 15.76 | 27 | 0.51 | -11.41% |
| RCI | Rogers | | Technology | 37.89 | 17 | 0.50 | -19.06% |
| GGB | Gerdau S.A | | Materials | 4.29 | 56 | 0.47 | -11.55% |
| CCJ | Cameco | | Materials | 48.41 | 68 | 0.46 | 12.32% |
| ERJ | Embraer S.A | | Industrials | 24.40 | 53 | 0.45 | 32.25% |
| BBDO | Banco Bradesco | | Financials | 2.35 | 0 | 0.43 | -26.10% |
| PSLV | Sprott Physical | | Financials | 9.58 | 90 | 0.42 | 18.56% |
| AGI | Alamos Gold | | Materials | 14.94 | 70 | 0.40 | 10.91% |
| RY | Royal Bank | | Financials | 96.78 | 30 | 0.39 | -4.30% |
| BTG | B2Gold | | Materials | 2.65 | 32 | 0.38 | -16.14% |
| OTEX | Open Text | | Technology | 34.60 | 17 | 0.38 | -17.66% |
| GOOS | Canada Goose | | Consumer Staples | 11.24 | 27 | 0.36 | -5.15% |
| WPRT | Westport Fuel | | Consumer Staples | 5.75 | 17 | 0.35 | -13.14% |
| CVE | Cenovus Energy | | Energy | 20.70 | 71 | 0.34 | 24.32% |
| NG | NovaGold Resources | | Materials | 3.13 | 68 | 0.32 | -16.31% |
| To view more stocks, click on Next / Previous arrows or select different range: 0 - 25 , 25 - 50 , 50 - 75 , 75 - 100 , 100 - 125 , 125 - 150 , 150 - 175 , 175 - 200 , 200 - 225 | ||
 | Click To Change The Sort Order: By Market Cap or Company Size Performance: Year-to-date, Week and Day |  |
| Detailed Overview Of Latin America Stocks |
| Latin America Technical Overview, Leaders & Laggards, Top Latin America ETF Funds & Detailed Latin America Stocks List, Charts, Trends & More |
| Latin America: Technical Analysis, Trends & YTD Performance | |
 ILF Weekly Chart |
|
| Long Term Trend: Not Good | |
| Medium Term Trend: Not Good | |
 ILF Daily Chart |
|
| Short Term Trend: Not Good | |
| Overall Trend Score: 7 | |
| YTD Performance: -7.74% | |
| **Trend Scores & Views Are Only For Educational Purposes And Not For Investing | |
| 12Stocks.com: Investing in Latin America Index using Exchange Traded Funds | |
|
The following table shows list of key exchange traded funds (ETF) that
help investors play Latin America stock market. For detailed view, check out our ETF Funds section of our website. Quick View: Move mouse or cursor over ETF symbol (ticker) to view short-term technical chart and over ETF name to view long term chart. Click on ticker or stock name for detailed view. Click on to add stock symbol to your watchlist and to view watchlist. |
12Stocks.com List of ETFs that track Latin America Index
| Ticker | ETF Name | Watchlist | Recent Price | Market Intelligence Score | Change % | Week % | Year-to-date % |
| ILF | Latin America 40 | | 26.81 | 7 | 0.41 | -3.04 | -7.74% |
| EWC | Canada | | 36.77 | 56 | 0.41 | -1.02 | 0.25% |
| FLN | Latin America AlphaDEX | | 19.15 | 7 | -0.17 | -6.13 | -7.89% |
| EWZ | Brazil | | 30.17 | 7 | 0.30 | -3.52 | -13.7% |
| EWW | Mexico | | 64.92 | 7 | 0.08 | -3.71 | -4.32% |
| ARGT | Argentina | | 52.91 | 41 | -0.36 | -4.89 | 3.06% |
| EWZS | Brazil Small-Cap | | 12.93 | 0 | 0.00 | -4.54 | -14.14% |
| BRF | Brazil Small-Cap | | 14.77 | 17 | -0.40 | -5.11 | -16.02% |
| BZQ | Short Brazil | | 13.07 | 93 | -2.06 | 6.17 | 30.31% |
| BRZU | Brazil Bull 3X | | 74.45 | 7 | 1.40 | -6.67 | -27.63% |
| FBZ | Brazil AlphaDEX | | 11.14 | 7 | -0.18 | -6.03 | -8.89% |
| 12Stocks.com: Charts, Trends, Fundamental Data and Performances of Latin America Stocks | |
|
We now take in-depth look at all Latin America stocks including charts, multi-period performances and overall trends (as measured by market intelligence score). One can sort Latin America stocks (click link to choose) by Daily, Weekly and by Year-to-Date performances. Also, one can sort by size of the company or by market capitalization. |
| Select Your Default Chart Type: | |||||
| |||||
| Click on stock symbol or name for detailed view. Click on to add stock symbol to your watchlist and to view watchlist. Quick View: Move mouse or cursor over "Daily" to quickly view daily technical stock chart and over "Weekly" to view weekly technical stock chart. | |||||

 | VOXR Vox Royalty Corp. |
| Sector: Materials | |
| SubSector: Other Precious Metals & Mining | |
| MarketCap: 154 Millions | |
| Recent Price: 2.02 Market Intelligence Score: 36 | |
| Day Percent Change: 0.75% Day Change: 0.02 | |
| Week Change: -2.66% Year-to-date Change: -2.2% | |
| VOXR Links: Profile News Message Board | |
| Charts:- Daily , Weekly | |
| Add VOXR to Watchlist: View: Get Complete VOXR Trend Analysis ➞ | |
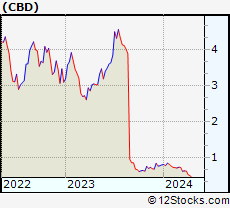 | CBD Companhia Brasileira de Distribuicao |
| Sector: Services & Goods | |
| SubSector: Grocery Stores | |
| MarketCap: 3830.15 Millions | |
| Recent Price: 0.46 Market Intelligence Score: 20 | |
| Day Percent Change: 0.75% Day Change: 0.00 | |
| Week Change: -8.18% Year-to-date Change: -42.6% | |
| CBD Links: Profile News Message Board | |
| Charts:- Daily , Weekly | |
| Add CBD to Watchlist: View: Get Complete CBD Trend Analysis ➞ | |
 | VTMX Vesta Financials Corp SAB de CV |
| Sector: Financials | |
| SubSector: REIT - Industrial | |
| MarketCap: 2270 Millions | |
| Recent Price: 35.08 Market Intelligence Score: 17 | |
| Day Percent Change: 0.66% Day Change: 0.23 | |
| Week Change: -1.71% Year-to-date Change: -11.8% | |
| VTMX Links: Profile News Message Board | |
| Charts:- Daily , Weekly | |
| Add VTMX to Watchlist: View: Get Complete VTMX Trend Analysis ➞ | |
 | FSM Fortuna Silver Mines Inc. |
| Sector: Materials | |
| SubSector: Silver | |
| MarketCap: 362.256 Millions | |
| Recent Price: 4.57 Market Intelligence Score: 76 | |
| Day Percent Change: 0.66% Day Change: 0.03 | |
| Week Change: -0.87% Year-to-date Change: 18.4% | |
| FSM Links: Profile News Message Board | |
| Charts:- Daily , Weekly | |
| Add FSM to Watchlist: View: Get Complete FSM Trend Analysis ➞ | |
 | GTE Gran Tierra Energy Inc. |
| Sector: Energy | |
| SubSector: Independent Oil & Gas | |
| MarketCap: 87.0593 Millions | |
| Recent Price: 8.05 Market Intelligence Score: 71 | |
| Day Percent Change: 0.63% Day Change: 0.05 | |
| Week Change: -0.49% Year-to-date Change: 42.7% | |
| GTE Links: Profile News Message Board | |
| Charts:- Daily , Weekly | |
| Add GTE to Watchlist: View: Get Complete GTE Trend Analysis ➞ | |
 | SSRM SSR Mining Inc. |
| Sector: Materials | |
| SubSector: Gold | |
| MarketCap: 1546.09 Millions | |
| Recent Price: 5.07 Market Intelligence Score: 35 | |
| Day Percent Change: 0.60% Day Change: 0.03 | |
| Week Change: -2.31% Year-to-date Change: -52.9% | |
| SSRM Links: Profile News Message Board | |
| Charts:- Daily , Weekly | |
| Add SSRM to Watchlist: View: Get Complete SSRM Trend Analysis ➞ | |
 | HBM Hudbay Minerals Inc. |
| Sector: Materials | |
| SubSector: Copper | |
| MarketCap: 363.157 Millions | |
| Recent Price: 7.61 Market Intelligence Score: 78 | |
| Day Percent Change: 0.53% Day Change: 0.04 | |
| Week Change: -0.13% Year-to-date Change: 37.9% | |
| HBM Links: Profile News Message Board | |
| Charts:- Daily , Weekly | |
| Add HBM to Watchlist: View: Get Complete HBM Trend Analysis ➞ | |
 | PAAS Pan American Silver Corp. |
| Sector: Materials | |
| SubSector: Silver | |
| MarketCap: 2832.56 Millions | |
| Recent Price: 18.90 Market Intelligence Score: 75 | |
| Day Percent Change: 0.53% Day Change: 0.10 | |
| Week Change: -3.57% Year-to-date Change: 15.7% | |
| PAAS Links: Profile News Message Board | |
| Charts:- Daily , Weekly | |
| Add PAAS to Watchlist: View: Get Complete PAAS Trend Analysis ➞ | |
 | BNS The Bank of Nova Scotia |
| Sector: Financials | |
| SubSector: Money Center Banks | |
| MarketCap: 48742.1 Millions | |
| Recent Price: 46.62 Market Intelligence Score: 15 | |
| Day Percent Change: 0.52% Day Change: 0.24 | |
| Week Change: -3.26% Year-to-date Change: -4.3% | |
| BNS Links: Profile News Message Board | |
| Charts:- Daily , Weekly | |
| Add BNS to Watchlist: View: Get Complete BNS Trend Analysis ➞ | |
 | EMX EMX Royalty Corporation |
| Sector: Materials | |
| SubSector: Industrial Metals & Minerals | |
| MarketCap: 103.91 Millions | |
| Recent Price: 1.93 Market Intelligence Score: 56 | |
| Day Percent Change: 0.52% Day Change: 0.01 | |
| Week Change: 0.52% Year-to-date Change: 19.1% | |
| EMX Links: Profile News Message Board | |
| Charts:- Daily , Weekly | |
| Add EMX to Watchlist: View: Get Complete EMX Trend Analysis ➞ | |
 | TU TELUS Corporation |
| Sector: Technology | |
| SubSector: Wireless Communications | |
| MarketCap: 10864.7 Millions | |
| Recent Price: 15.76 Market Intelligence Score: 27 | |
| Day Percent Change: 0.51% Day Change: 0.08 | |
| Week Change: -0.57% Year-to-date Change: -11.4% | |
| TU Links: Profile News Message Board | |
| Charts:- Daily , Weekly | |
| Add TU to Watchlist: View: Get Complete TU Trend Analysis ➞ | |
 | RCI Rogers Communications Inc. |
| Sector: Technology | |
| SubSector: Wireless Communications | |
| MarketCap: 22111.6 Millions | |
| Recent Price: 37.89 Market Intelligence Score: 17 | |
| Day Percent Change: 0.50% Day Change: 0.19 | |
| Week Change: -3.27% Year-to-date Change: -19.1% | |
| RCI Links: Profile News Message Board | |
| Charts:- Daily , Weekly | |
| Add RCI to Watchlist: View: Get Complete RCI Trend Analysis ➞ | |
 | GGB Gerdau S.A. |
| Sector: Materials | |
| SubSector: Steel & Iron | |
| MarketCap: 3607.48 Millions | |
| Recent Price: 4.29 Market Intelligence Score: 56 | |
| Day Percent Change: 0.47% Day Change: 0.02 | |
| Week Change: -0.69% Year-to-date Change: -11.6% | |
| GGB Links: Profile News Message Board | |
| Charts:- Daily , Weekly | |
| Add GGB to Watchlist: View: Get Complete GGB Trend Analysis ➞ | |
 | CCJ Cameco Corporation |
| Sector: Materials | |
| SubSector: Industrial Metals & Minerals | |
| MarketCap: 2722.9 Millions | |
| Recent Price: 48.41 Market Intelligence Score: 68 | |
| Day Percent Change: 0.46% Day Change: 0.22 | |
| Week Change: -2.38% Year-to-date Change: 12.3% | |
| CCJ Links: Profile News Message Board | |
| Charts:- Daily , Weekly | |
| Add CCJ to Watchlist: View: Get Complete CCJ Trend Analysis ➞ | |
 | ERJ Embraer S.A. |
| Sector: Industrials | |
| SubSector: Aerospace/Defense Products & Services | |
| MarketCap: 1623.71 Millions | |
| Recent Price: 24.40 Market Intelligence Score: 53 | |
| Day Percent Change: 0.45% Day Change: 0.11 | |
| Week Change: -1.81% Year-to-date Change: 32.3% | |
| ERJ Links: Profile News Message Board | |
| Charts:- Daily , Weekly | |
| Add ERJ to Watchlist: View: Get Complete ERJ Trend Analysis ➞ | |
 | BBDO Banco Bradesco S.A. |
| Sector: Financials | |
| SubSector: Foreign Regional Banks | |
| MarketCap: 27711.4 Millions | |
| Recent Price: 2.35 Market Intelligence Score: 0 | |
| Day Percent Change: 0.43% Day Change: 0.01 | |
| Week Change: -4.47% Year-to-date Change: -26.1% | |
| BBDO Links: Profile News Message Board | |
| Charts:- Daily , Weekly | |
| Add BBDO to Watchlist: View: Get Complete BBDO Trend Analysis ➞ | |
 | PSLV Sprott Physical Silver Trust |
| Sector: Financials | |
| SubSector: Exchange Traded Fund | |
| MarketCap: 765.851 Millions | |
| Recent Price: 9.58 Market Intelligence Score: 90 | |
| Day Percent Change: 0.42% Day Change: 0.04 | |
| Week Change: 1.81% Year-to-date Change: 18.6% | |
| PSLV Links: Profile News Message Board | |
| Charts:- Daily , Weekly | |
| Add PSLV to Watchlist: View: Get Complete PSLV Trend Analysis ➞ | |
 | AGI Alamos Gold Inc. |
| Sector: Materials | |
| SubSector: Gold | |
| MarketCap: 1740.39 Millions | |
| Recent Price: 14.94 Market Intelligence Score: 70 | |
| Day Percent Change: 0.40% Day Change: 0.06 | |
| Week Change: -1.78% Year-to-date Change: 10.9% | |
| AGI Links: Profile News Message Board | |
| Charts:- Daily , Weekly | |
| Add AGI to Watchlist: View: Get Complete AGI Trend Analysis ➞ | |
 | RY Royal Bank of Canada |
| Sector: Financials | |
| SubSector: Money Center Banks | |
| MarketCap: 87565.4 Millions | |
| Recent Price: 96.78 Market Intelligence Score: 30 | |
| Day Percent Change: 0.39% Day Change: 0.38 | |
| Week Change: -3.57% Year-to-date Change: -4.3% | |
| RY Links: Profile News Message Board | |
| Charts:- Daily , Weekly | |
| Add RY to Watchlist: View: Get Complete RY Trend Analysis ➞ | |
 | BTG B2Gold Corp. |
| Sector: Materials | |
| SubSector: Gold | |
| MarketCap: 2792.39 Millions | |
| Recent Price: 2.65 Market Intelligence Score: 32 | |
| Day Percent Change: 0.38% Day Change: 0.01 | |
| Week Change: -8.3% Year-to-date Change: -16.1% | |
| BTG Links: Profile News Message Board | |
| Charts:- Daily , Weekly | |
| Add BTG to Watchlist: View: Get Complete BTG Trend Analysis ➞ | |
 | OTEX Open Text Corporation |
| Sector: Technology | |
| SubSector: Application Software | |
| MarketCap: 9291.92 Millions | |
| Recent Price: 34.60 Market Intelligence Score: 17 | |
| Day Percent Change: 0.38% Day Change: 0.13 | |
| Week Change: -2.59% Year-to-date Change: -17.7% | |
| OTEX Links: Profile News Message Board | |
| Charts:- Daily , Weekly | |
| Add OTEX to Watchlist: View: Get Complete OTEX Trend Analysis ➞ | |
 | GOOS Canada Goose Holdings Inc. |
| Sector: Consumer Staples | |
| SubSector: Textile - Apparel Clothing | |
| MarketCap: 881.465 Millions | |
| Recent Price: 11.24 Market Intelligence Score: 27 | |
| Day Percent Change: 0.36% Day Change: 0.04 | |
| Week Change: 4.17% Year-to-date Change: -5.2% | |
| GOOS Links: Profile News Message Board | |
| Charts:- Daily , Weekly | |
| Add GOOS to Watchlist: View: Get Complete GOOS Trend Analysis ➞ | |
 | WPRT Westport Fuel Systems Inc. |
| Sector: Consumer Staples | |
| SubSector: Auto Parts | |
| MarketCap: 108.939 Millions | |
| Recent Price: 5.75 Market Intelligence Score: 17 | |
| Day Percent Change: 0.35% Day Change: 0.02 | |
| Week Change: -1.03% Year-to-date Change: -13.1% | |
| WPRT Links: Profile News Message Board | |
| Charts:- Daily , Weekly | |
| Add WPRT to Watchlist: View: Get Complete WPRT Trend Analysis ➞ | |
 | CVE Cenovus Energy Inc. |
| Sector: Energy | |
| SubSector: Oil & Gas Drilling & Exploration | |
| MarketCap: 2369.29 Millions | |
| Recent Price: 20.70 Market Intelligence Score: 71 | |
| Day Percent Change: 0.34% Day Change: 0.07 | |
| Week Change: -1.19% Year-to-date Change: 24.3% | |
| CVE Links: Profile News Message Board | |
| Charts:- Daily , Weekly | |
| Add CVE to Watchlist: View: Get Complete CVE Trend Analysis ➞ | |
 | NG NovaGold Resources Inc. |
| Sector: Materials | |
| SubSector: Gold | |
| MarketCap: 2499.49 Millions | |
| Recent Price: 3.13 Market Intelligence Score: 68 | |
| Day Percent Change: 0.32% Day Change: 0.01 | |
| Week Change: -0.63% Year-to-date Change: -16.3% | |
| NG Links: Profile News Message Board | |
| Charts:- Daily , Weekly | |
| Add NG to Watchlist: View: Get Complete NG Trend Analysis ➞ | |
| To view more stocks, click on Next / Previous arrows or select different range: 0 - 25 , 25 - 50 , 50 - 75 , 75 - 100 , 100 - 125 , 125 - 150 , 150 - 175 , 175 - 200 , 200 - 225 | ||
| Click To Change The Sort Order: By Market Cap or Company Size Performance: Year-to-date, Week and Day | |
| Select Chart Type: | ||
 Best Stocks Today 12Stocks.com |
© 2024 12Stocks.com Terms & Conditions Privacy Contact Us
All Information Provided Only For Education And Not To Be Used For Investing or Trading. See Terms & Conditions


One More Thing ... Get Best Stocks Delivered Daily!
Never Ever Miss A Move With Our Top Ten Stocks Lists
Find Best Stocks In Any Market - Bull or Bear Market
Take A Peek At Our Top Ten Stocks Lists: Daily, Weekly, Year-to-Date & Top Trends
Find Best Stocks In Any Market - Bull or Bear Market
Take A Peek At Our Top Ten Stocks Lists: Daily, Weekly, Year-to-Date & Top Trends
Latin America Stocks With Best Up Trends [0-bearish to 100-bullish]: IMAX [100], Sprott Physical[90], Sprott Physical[90], Franco-Nevada [88], Agnico Eagle[88], Suncor Energy[83], Sprott Physical[83], Sandstorm Gold[81], Hudbay Minerals[78], Teck Resources[78], Kinross Gold[76]
Best Latin America Stocks Year-to-Date:
Aurora Cannabis[1124.28%], Fusion [121.25%], D-Wave Quantum[90.34%], Banco Macro[67.56%], Grupo Financiero[60.5%], Celestica [52.39%], McEwen Mining[51.04%], Banco BBVA[47.61%], IAMGOLD [44.66%], OrganiGram [39.69%], Hudbay Minerals[37.86%] Best Latin America Stocks This Week:
Controladora Vuela[6.52%], Canada Goose[4.17%], IMAX [3.9%], TransAlta [2.64%], Lululemon Athletica[2.55%], D-Wave Quantum[2.45%], BRF S.A[2.19%], Franco-Nevada [2.05%], Silvercorp Metals[1.98%], Sprott Physical[1.81%], Ready Capital[1.8%] Best Latin America Stocks Daily:
Controladora Vuela[6.37%], IAMGOLD [3.39%], Sandstorm Gold[3.24%], Franco-Nevada [2.88%], Wheaton Precious[2.75%], SilverCrest Metals[2.73%], America Movil[2.62%], Triple Flag[2.59%], Companhia de[2.51%], Algoma Steel[2.48%], Mercer [2.33%]