
 Login Sign Up


| |||||
 |  | ||||

| 12Stocks.com Market Intelligence |
Best Latin America Stocks
|
|
| Quick Read: Top Latin America Stocks By Performances & Trends: Daily, Weekly, Year-to-Date, Market Cap (Size) & Technical Trends | |||
| Best Latin America Views: Quick Browse View, Summary & Slide Show | |||
| 12Stocks.com Latin America Stocks Performances & Trends Daily | |||||||||
|
|  The overall market intelligence score is 80 (0-bearish to 100-bullish) which puts Latin America index in short term neutral to bullish trend. The market intelligence score from previous trading session is 100 and hence a deterioration of trend.
| ||||||||
| Here are the market intelligence trend scores of the most requested Latin America stocks at 12Stocks.com (click stock name for detailed review): | |
| Scroll down this page for most comprehensive review of Latin America stocks by performance, trends, technical analysis, charts, fund plays & more | |


| 12Stocks.com: Top Performing Latin America Index Stocks | ||||||||||||||||||||||||||||||||||||||||||||||||
 The top performing Latin America Index stocks year to date are
Now, more recently, over last week, the top performing Latin America Index stocks on the move are


|
||||||||||||||||||||||||||||||||||||||||||||||||
| 12Stocks.com: Investing in Latin America Index with Stocks | |
|
The following table helps investors and traders sort through current performance and trends (as measured by market intelligence score) of various
stocks in the Latin America Index. Quick View: Move mouse or cursor over stock symbol (ticker) to view short-term technical chart and over stock name to view long term chart. Click on  to add stock symbol to your watchlist and to add stock symbol to your watchlist and  to view watchlist. Click on any ticker or stock name for detailed market intelligence report for that stock. to view watchlist. Click on any ticker or stock name for detailed market intelligence report for that stock. |
12Stocks.com Performance of Stocks in Latin America Index
| Ticker | Stock Name | Watchlist | Category | Recent Price | Market Intelligence Score | Change % | YTD Change% |
| ASM | Avino Silver |   | Materials | 4.47 | 100 | 4.55% | 343.81% |
| VFF | Village Farms | | Consumer Staples | 3.27 | 50 | 0.70% | 273.54% |
| DDC | Dominion Diamond | | Materials | 13.92 | 80 | 28.83% | 207.43% |
| THM | Tower | | Materials | 1.40 | 100 | 6.67% | 181.07% |
| GROY | Gold Royalty | | Materials | 3.62 | 100 | 6.76% | 161.16% |
| SSRM | SSR Mining | | Materials | 19.31 | 100 | 2.86% | 143.10% |
| USAS | Americas Silver | | Materials | 2.73 | 100 | 2.91% | 139.03% |
| FSI | Flexible | | Materials | 11.25 | 80 | 0.00% | 122.51% |
| NGD | New Gold | | Materials | 5.90 | 100 | 3.42% | 119.35% |
| KGC | Kinross Gold | | Materials | 20.90 | 100 | 2.25% | 111.46% |
| VSTA | Vasta Platform | | Consumer Staples | 4.28 | 50 | -1.29% | 109.75% |
| CLS | Celestica | | Technology | 194.75 | 50 | -0.85% | 96.47% |
| SAND | Sandstorm Gold | | Materials | 11.16 | 100 | 2.95% | 95.03% |
| INTR | Inter & Co | | Financials | 8.59 | 43 | 0.13% | 86.91% |
| STNE | StoneCo | | Technology | 16.47 | 70 | 0.14% | 86.07% |
| EMX | EMX Royalty | | Materials | 3.65 | 100 | -1.58% | 79.77% |
| THTX | Thera | | Health Care | 3.24 | 60 | 0.15% | 79.56% |
| NG | NovaGold Resources | | Materials | 6.84 | 100 | 0.51% | 78.68% |
| QBTS | D-Wave Quantum | | Technology | 15.62 | 60 | -1.66% | 76.31% |
| AEM | Agnico Eagle | | Materials | 144.17 | 100 | 1.23% | 75.66% |
| TFPM | Triple Flag | | Materials | 27.37 | 48 | 2.93% | 74.09% |
| FSM | Fortuna Silver | | Materials | 7.70 | 100 | 3.67% | 71.33% |
| VIV | Telefonica Brasil | | Technology | 12.47 | 30 | 0.40% | 70.38% |
| OR | Osisko Gold | | Materials | 32.16 | 100 | 1.46% | 70.08% |
| WPM | Wheaton Precious | | Materials | 100.42 | 100 | 1.19% | 68.45% |
| To view more stocks, click on Next / Previous arrows or select different range: 0 - 25 , 25 - 50 , 50 - 75 , 75 - 100 , 100 - 125 , 125 - 150 , 150 - 175 , 175 - 200 , 200 - 225 | ||
 | Click To Change The Sort Order: By Market Cap or Company Size Performance: Year-to-date, Week and Day |  |
| Detailed Overview Of Latin America Stocks |
| Latin America Technical Overview, Leaders & Laggards, Top Latin America ETF Funds & Detailed Latin America Stocks List, Charts, Trends & More |
| Latin America: Technical Analysis, Trends & YTD Performance | |
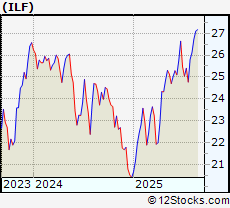
 ILF Weekly Chart |
|
| Long Term Trend: Very Good | |
| Medium Term Trend: Very Good | |
 ILF Daily Chart |
|
| Short Term Trend: Very Good | |
| Overall Trend Score: 80 | |
| YTD Performance: 20.68% | |
| **Trend Scores & Views Are Only For Educational Purposes And Not For Investing | |
| 12Stocks.com: Investing in Latin America Index using Exchange Traded Funds | |
|
The following table shows list of key exchange traded funds (ETF) that
help investors play Latin America stock market. For detailed view, check out our ETF Funds section of our website. Quick View: Move mouse or cursor over ETF symbol (ticker) to view short-term technical chart and over ETF name to view long term chart. Click on ticker or stock name for detailed view. Click on to add stock symbol to your watchlist and to view watchlist. |
12Stocks.com List of ETFs that track Latin America Index
| Ticker | ETF Name | Watchlist | Recent Price | Market Intelligence Score | Change % | Week % | Year-to-date % |
| ILF | Latin America 40 | | 27.07 | 80 | 0.19 | -0.11 | 20.68% |
| EWC | Canada | | 48.79 | 100 | 1.57 | 1.59 | 17.28% |
| FLN | Latin America AlphaDEX | | 20.48 | 100 | 0.31 | -0.55 | 33.28% |
| EWZ | Brazil | | 29.50 | 60 | 3.33 | 1.35 | 14.93% |
| EWW | Mexico | | 61.94 | 100 | 2 | 2.35 | 30.49% |
| ARGT | Argentina | | 80.15 | 0 | 0.48 | -2.82 | -1.29% |
| EWZS | Brazil Small-Cap | | 13.40 | 70 | -0.6 | -2.06 | 35.19% |
| BRF | Brazil Small-Cap | | 15.65 | 70 | -0.22 | -2.19 | 32.59% |
| BZQ | Short Brazil | | 10.00 | 30 | -0.06 | 1.69 | -39.37% |
| BRZU | Brazil Bull 3X | | 67.10 | 50 | -0.12 | -1.98 | 45.21% |
| 12Stocks.com: Charts, Trends, Fundamental Data and Performances of Latin America Stocks | |
|
We now take in-depth look at all Latin America stocks including charts, multi-period performances and overall trends (as measured by market intelligence score). One can sort Latin America stocks (click link to choose) by Daily, Weekly and by Year-to-Date performances. Also, one can sort by size of the company or by market capitalization. |
| Select Your Default Chart Type: | |||||
| |||||
| Click on stock symbol or name for detailed view. Click on to add stock symbol to your watchlist and to view watchlist. Quick View: Move mouse or cursor over "Daily" to quickly view daily technical stock chart and over "Weekly" to view weekly technical stock chart. | |||||

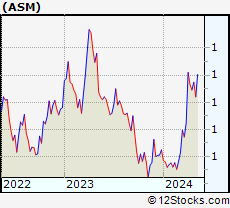 | ASM Avino Silver & Gold Mines Ltd. |
| Sector: Materials | |
| SubSector: Silver | |
| MarketCap: 29.7456 Millions | |
| Recent Price: 4.47 Market Intelligence Score: 100 | |
| Day Percent Change: 4.55% Day Change: 0.17 | |
| Week Change: 2.89% Year-to-date Change: 343.8% | |
| ASM Links: Profile News Message Board | |
| Charts:- Daily , Weekly | |
| Add ASM to Watchlist: View: Get Complete ASM Trend Analysis ➞ | |
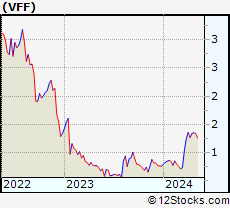 | VFF Village Farms International, Inc. |
| Sector: Consumer Staples | |
| SubSector: Farm Products | |
| MarketCap: 125.287 Millions | |
| Recent Price: 3.27 Market Intelligence Score: 50 | |
| Day Percent Change: 0.7% Day Change: 0.02 | |
| Week Change: 2.13% Year-to-date Change: 273.5% | |
| VFF Links: Profile News Message Board | |
| Charts:- Daily , Weekly | |
| Add VFF to Watchlist: View: Get Complete VFF Trend Analysis ➞ | |
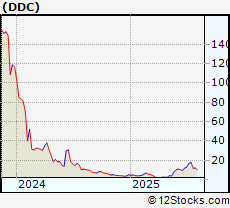 | DDC Dominion Diamond Corporation |
| Sector: Materials | |
| SubSector: Nonmetallic Mineral Mining | |
| MarketCap: 713.29 Millions | |
| Recent Price: 13.92 Market Intelligence Score: 80 | |
| Day Percent Change: 28.83% Day Change: 3.01 | |
| Week Change: 33.17% Year-to-date Change: 207.4% | |
| DDC Links: Profile News Message Board | |
| Charts:- Daily , Weekly | |
| Add DDC to Watchlist: View: Get Complete DDC Trend Analysis ➞ | |
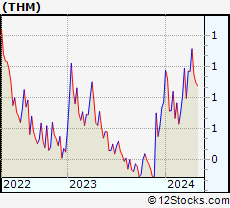 | THM International Tower Hill Mines Ltd. |
| Sector: Materials | |
| SubSector: Gold | |
| MarketCap: 70.4619 Millions | |
| Recent Price: 1.40 Market Intelligence Score: 100 | |
| Day Percent Change: 6.67% Day Change: 0.08 | |
| Week Change: 2.4% Year-to-date Change: 181.1% | |
| THM Links: Profile News Message Board | |
| Charts:- Daily , Weekly | |
| Add THM to Watchlist: View: Get Complete THM Trend Analysis ➞ | |
 | GROY Gold Royalty Corp. |
| Sector: Materials | |
| SubSector: Other Precious Metals & Mining | |
| MarketCap: 254 Millions | |
| Recent Price: 3.62 Market Intelligence Score: 100 | |
| Day Percent Change: 6.76% Day Change: 0.2 | |
| Week Change: 2.93% Year-to-date Change: 161.2% | |
| GROY Links: Profile News Message Board | |
| Charts:- Daily , Weekly | |
| Add GROY to Watchlist: View: Get Complete GROY Trend Analysis ➞ | |
 | SSRM SSR Mining Inc. |
| Sector: Materials | |
| SubSector: Gold | |
| MarketCap: 1546.09 Millions | |
| Recent Price: 19.31 Market Intelligence Score: 100 | |
| Day Percent Change: 2.86% Day Change: 0.47 | |
| Week Change: 5.22% Year-to-date Change: 143.1% | |
| SSRM Links: Profile News Message Board | |
| Charts:- Daily , Weekly | |
| Add SSRM to Watchlist: View: Get Complete SSRM Trend Analysis ➞ | |
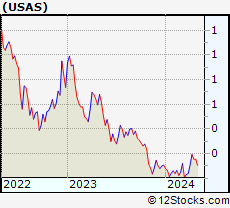 | USAS Americas Silver Corporation |
| Sector: Materials | |
| SubSector: Silver | |
| MarketCap: 67.8456 Millions | |
| Recent Price: 2.73 Market Intelligence Score: 100 | |
| Day Percent Change: 2.91% Day Change: 0.03 | |
| Week Change: -6.41% Year-to-date Change: 139.0% | |
| USAS Links: Profile News Message Board | |
| Charts:- Daily , Weekly | |
| Add USAS to Watchlist: View: Get Complete USAS Trend Analysis ➞ | |
 | FSI Flexible Solutions International Inc. |
| Sector: Materials | |
| SubSector: Specialty Chemicals | |
| MarketCap: 14.3357 Millions | |
| Recent Price: 11.25 Market Intelligence Score: 80 | |
| Day Percent Change: 0% Day Change: 0 | |
| Week Change: 3.97% Year-to-date Change: 122.5% | |
| FSI Links: Profile News Message Board | |
| Charts:- Daily , Weekly | |
| Add FSI to Watchlist: View: Get Complete FSI Trend Analysis ➞ | |
 | NGD New Gold Inc. |
| Sector: Materials | |
| SubSector: Gold | |
| MarketCap: 398.119 Millions | |
| Recent Price: 5.90 Market Intelligence Score: 100 | |
| Day Percent Change: 3.42% Day Change: 0.18 | |
| Week Change: 6.67% Year-to-date Change: 119.4% | |
| NGD Links: Profile News Message Board | |
| Charts:- Daily , Weekly | |
| Add NGD to Watchlist: View: Get Complete NGD Trend Analysis ➞ | |
 | KGC Kinross Gold Corporation |
| Sector: Materials | |
| SubSector: Gold | |
| MarketCap: 5389.29 Millions | |
| Recent Price: 20.90 Market Intelligence Score: 100 | |
| Day Percent Change: 2.25% Day Change: 0.43 | |
| Week Change: 3.28% Year-to-date Change: 111.5% | |
| KGC Links: Profile News Message Board | |
| Charts:- Daily , Weekly | |
| Add KGC to Watchlist: View: Get Complete KGC Trend Analysis ➞ | |
 | VSTA Vasta Platform Limited |
| Sector: Consumer Staples | |
| SubSector: Education & Training Services | |
| MarketCap: 12747 Millions | |
| Recent Price: 4.28 Market Intelligence Score: 50 | |
| Day Percent Change: -1.29% Day Change: -0.05 | |
| Week Change: -0.83% Year-to-date Change: 109.8% | |
| VSTA Links: Profile News Message Board | |
| Charts:- Daily , Weekly | |
| Add VSTA to Watchlist: View: Get Complete VSTA Trend Analysis ➞ | |
 | CLS Celestica Inc. |
| Sector: Technology | |
| SubSector: Printed Circuit Boards | |
| MarketCap: 474.235 Millions | |
| Recent Price: 194.75 Market Intelligence Score: 50 | |
| Day Percent Change: -0.85% Day Change: -1.56 | |
| Week Change: -7.78% Year-to-date Change: 96.5% | |
| CLS Links: Profile News Message Board | |
| Charts:- Daily , Weekly | |
| Add CLS to Watchlist: View: Get Complete CLS Trend Analysis ➞ | |
 | SAND Sandstorm Gold Ltd. |
| Sector: Materials | |
| SubSector: Gold | |
| MarketCap: 808.119 Millions | |
| Recent Price: 11.16 Market Intelligence Score: 100 | |
| Day Percent Change: 2.95% Day Change: 0.31 | |
| Week Change: 3.24% Year-to-date Change: 95.0% | |
| SAND Links: Profile News Message Board | |
| Charts:- Daily , Weekly | |
| Add SAND to Watchlist: View: Get Complete SAND Trend Analysis ➞ | |
 | INTR Inter & Co, Inc. |
| Sector: Financials | |
| SubSector: Banks - Regional | |
| MarketCap: 1250 Millions | |
| Recent Price: 8.59 Market Intelligence Score: 43 | |
| Day Percent Change: 0.13% Day Change: 0.01 | |
| Week Change: -4.9% Year-to-date Change: 86.9% | |
| INTR Links: Profile News Message Board | |
| Charts:- Daily , Weekly | |
| Add INTR to Watchlist: View: Get Complete INTR Trend Analysis ➞ | |
 | STNE StoneCo Ltd. |
| Sector: Technology | |
| SubSector: Application Software | |
| MarketCap: 7347.82 Millions | |
| Recent Price: 16.47 Market Intelligence Score: 70 | |
| Day Percent Change: 0.14% Day Change: 0.02 | |
| Week Change: -3.2% Year-to-date Change: 86.1% | |
| STNE Links: Profile News Message Board | |
| Charts:- Daily , Weekly | |
| Add STNE to Watchlist: View: Get Complete STNE Trend Analysis ➞ | |
 | EMX EMX Royalty Corporation |
| Sector: Materials | |
| SubSector: Industrial Metals & Minerals | |
| MarketCap: 103.91 Millions | |
| Recent Price: 3.65 Market Intelligence Score: 100 | |
| Day Percent Change: -1.58% Day Change: -0.05 | |
| Week Change: -6.89% Year-to-date Change: 79.8% | |
| EMX Links: Profile News Message Board | |
| Charts:- Daily , Weekly | |
| Add EMX to Watchlist: View: Get Complete EMX Trend Analysis ➞ | |
 | THTX Theratechnologies Inc. |
| Sector: Health Care | |
| SubSector: Drugs - Generic | |
| MarketCap: 123.185 Millions | |
| Recent Price: 3.24 Market Intelligence Score: 60 | |
| Day Percent Change: 0.15% Day Change: 0 | |
| Week Change: 0.93% Year-to-date Change: 79.6% | |
| THTX Links: Profile News Message Board | |
| Charts:- Daily , Weekly | |
| Add THTX to Watchlist: View: Get Complete THTX Trend Analysis ➞ | |
 | NG NovaGold Resources Inc. |
| Sector: Materials | |
| SubSector: Gold | |
| MarketCap: 2499.49 Millions | |
| Recent Price: 6.84 Market Intelligence Score: 100 | |
| Day Percent Change: 0.51% Day Change: 0.03 | |
| Week Change: -0.34% Year-to-date Change: 78.7% | |
| NG Links: Profile News Message Board | |
| Charts:- Daily , Weekly | |
| Add NG to Watchlist: View: Get Complete NG Trend Analysis ➞ | |
 | QBTS D-Wave Quantum Inc. |
| Sector: Technology | |
| SubSector: Computer Hardware | |
| MarketCap: 290 Millions | |
| Recent Price: 15.62 Market Intelligence Score: 60 | |
| Day Percent Change: -1.66% Day Change: -0.25 | |
| Week Change: -18.54% Year-to-date Change: 76.3% | |
| QBTS Links: Profile News Message Board | |
| Charts:- Daily , Weekly | |
| Add QBTS to Watchlist: View: Get Complete QBTS Trend Analysis ➞ | |
 | AEM Agnico Eagle Mines Limited |
| Sector: Materials | |
| SubSector: Gold | |
| MarketCap: 9491.49 Millions | |
| Recent Price: 144.17 Market Intelligence Score: 100 | |
| Day Percent Change: 1.23% Day Change: 1.65 | |
| Week Change: 2.72% Year-to-date Change: 75.7% | |
| AEM Links: Profile News Message Board | |
| Charts:- Daily , Weekly | |
| Add AEM to Watchlist: View: Get Complete AEM Trend Analysis ➞ | |
 | TFPM Triple Flag Precious Metals Corp. |
| Sector: Materials | |
| SubSector: Other Precious Metals & Mining | |
| MarketCap: 3640 Millions | |
| Recent Price: 27.37 Market Intelligence Score: 48 | |
| Day Percent Change: 2.93% Day Change: 0.74 | |
| Week Change: 0.85% Year-to-date Change: 74.1% | |
| TFPM Links: Profile News Message Board | |
| Charts:- Daily , Weekly | |
| Add TFPM to Watchlist: View: Get Complete TFPM Trend Analysis ➞ | |
 | FSM Fortuna Silver Mines Inc. |
| Sector: Materials | |
| SubSector: Silver | |
| MarketCap: 362.256 Millions | |
| Recent Price: 7.70 Market Intelligence Score: 100 | |
| Day Percent Change: 3.67% Day Change: 0.26 | |
| Week Change: 1.24% Year-to-date Change: 71.3% | |
| FSM Links: Profile News Message Board | |
| Charts:- Daily , Weekly | |
| Add FSM to Watchlist: View: Get Complete FSM Trend Analysis ➞ | |
 | VIV Telefonica Brasil S.A. |
| Sector: Technology | |
| SubSector: Wireless Communications | |
| MarketCap: 19611.1 Millions | |
| Recent Price: 12.47 Market Intelligence Score: 30 | |
| Day Percent Change: 0.4% Day Change: 0.05 | |
| Week Change: 1.14% Year-to-date Change: 70.4% | |
| VIV Links: Profile News Message Board | |
| Charts:- Daily , Weekly | |
| Add VIV to Watchlist: View: Get Complete VIV Trend Analysis ➞ | |
 | OR Osisko Gold Royalties Ltd |
| Sector: Materials | |
| SubSector: Gold | |
| MarketCap: 1025.99 Millions | |
| Recent Price: 32.16 Market Intelligence Score: 100 | |
| Day Percent Change: 1.46% Day Change: 0.44 | |
| Week Change: 0.07% Year-to-date Change: 70.1% | |
| OR Links: Profile News Message Board | |
| Charts:- Daily , Weekly | |
| Add OR to Watchlist: View: Get Complete OR Trend Analysis ➞ | |
 | WPM Wheaton Precious Metals Corp. |
| Sector: Materials | |
| SubSector: Silver | |
| MarketCap: 11349.6 Millions | |
| Recent Price: 100.42 Market Intelligence Score: 100 | |
| Day Percent Change: 1.19% Day Change: 1.11 | |
| Week Change: 0.07% Year-to-date Change: 68.5% | |
| WPM Links: Profile News Message Board | |
| Charts:- Daily , Weekly | |
| Add WPM to Watchlist: View: Get Complete WPM Trend Analysis ➞ | |
| To view more stocks, click on Next / Previous arrows or select different range: 0 - 25 , 25 - 50 , 50 - 75 , 75 - 100 , 100 - 125 , 125 - 150 , 150 - 175 , 175 - 200 , 200 - 225 | ||
| Click To Change The Sort Order: By Market Cap or Company Size Performance: Year-to-date, Week and Day | |
| Select Chart Type: | ||
 Best Stocks Today 12Stocks.com |
© 2025 12Stocks.com Terms & Conditions Privacy Contact Us
All Information Provided Only For Education And Not To Be Used For Investing or Trading. See Terms & Conditions


One More Thing ... Get Best Stocks Delivered Daily!
Never Ever Miss A Move With Our Top Ten Stocks Lists
Find Best Stocks In Any Market - Bull or Bear Market
Take A Peek At Our Top Ten Stocks Lists: Daily, Weekly, Year-to-Date & Top Trends
Find Best Stocks In Any Market - Bull or Bear Market
Take A Peek At Our Top Ten Stocks Lists: Daily, Weekly, Year-to-Date & Top Trends
Latin America Stocks With Best Up Trends [0-bearish to 100-bullish]: Gold Royalty[100], Alamos Gold[100], Vox Royalty[100], Endeavour Silver[100], Fortuna Silver[100], IAMGOLD [100], New Gold[100], New Found[100], Sandstorm Gold[100], McEwen Mining[100], SSR Mining[100]
Best Latin America Stocks Year-to-Date:
Dominion Diamond[207.43%], Gold Royalty[161.16%], SSR Mining[143.1%], New Gold[119.35%], Kinross Gold[111.46%], Vasta Platform[109.75%], Celestica [96.47%], Sandstorm Gold[95.03%], Inter & Co[86.91%], StoneCo [86.07%], NovaGold Resources[78.68%] Best Latin America Stocks This Week:
Dominion Diamond[33.17%], Nu [13.82%], Alamos Gold[9.37%], Novadaq [8%], New Gold[6.67%], Mercer [5.9%], BRF S.A[5.85%], Trilogy Metals[5.77%], IAMGOLD [5.75%], McEwen Mining[5.39%], SSR Mining[5.22%] Best Latin America Stocks Daily:
Dominion Diamond[28.83%], Bioceres Crop[8.89%], Gold Royalty[6.76%], Cronos [5.79%], Vision Marine[5.23%], Algoma Steel[5.05%], Alamos Gold[4.79%], Tilray [4.72%], Vox Royalty[4.72%], OrganiGram [4.67%], Braskem S.A[4.48%]