
 Login Sign Up


| |||||
 |  | ||||

| 12Stocks.com Market Intelligence |
Best Latin America Stocks
|
|
| Quick Read: Top Latin America Stocks By Performances & Trends: Daily, Weekly, Year-to-Date, Market Cap (Size) & Technical Trends | |||
| Best Latin America Views: Quick Browse View, Summary & Slide Show | |||
| 12Stocks.com Latin America Stocks Performances & Trends Daily | |||||||||
|
|  The overall market intelligence score is 18 (0-bearish to 100-bullish) which puts Latin America index in short term bearish trend. The market intelligence score from previous trading session is 32 and hence a deterioration of trend.
| ||||||||
| Here are the market intelligence trend scores of the most requested Latin America stocks at 12Stocks.com (click stock name for detailed review): | |
| Scroll down this page for most comprehensive review of Latin America stocks by performance, trends, technical analysis, charts, fund plays & more | |


| 12Stocks.com: Top Performing Latin America Index Stocks | ||||||||||||||||||||||||||||||||||||||||||||||||
 The top performing Latin America Index stocks year to date are
Now, more recently, over last week, the top performing Latin America Index stocks on the move are


|
||||||||||||||||||||||||||||||||||||||||||||||||
| 12Stocks.com: Investing in Latin America Index with Stocks | |
|
The following table helps investors and traders sort through current performance and trends (as measured by market intelligence score) of various
stocks in the Latin America Index. Quick View: Move mouse or cursor over stock symbol (ticker) to view short-term technical chart and over stock name to view long term chart. Click on  to add stock symbol to your watchlist and to add stock symbol to your watchlist and  to view watchlist. Click on any ticker or stock name for detailed market intelligence report for that stock. to view watchlist. Click on any ticker or stock name for detailed market intelligence report for that stock. |
12Stocks.com Performance of Stocks in Latin America Index
| Ticker | Stock Name | Watchlist | Category | Recent Price | Market Intelligence Score | Change % | YTD Change% |
| FMX | Fomento Economico |   | Consumer Staples | 115.11 | 10 | -0.68% | -11.69% |
| ITUB | Itau Unibanco | | Financials | 6.11 | 35 | -1.61% | -12.09% |
| XENE | Xenon | | Health Care | 40.10 | 0 | 1.52% | -12.94% |
| THTX | Thera | | Health Care | 1.41 | 35 | 3.68% | -12.96% |
| CAE | CAE | | Industrials | 18.75 | 8 | -1.94% | -13.15% |
| BLCO | Bausch + | | Health Care | 14.76 | 51 | -0.67% | -13.18% |
| BIOX | Bioceres Crop | | Industrials | 11.92 | 10 | 0.00% | -13.18% |
| MELI | MercadoLibre | | Services & Goods | 1363.83 | 10 | -0.45% | -13.22% |
| STNE | StoneCo | | Technology | 15.55 | 20 | -1.77% | -13.75% |
| WPRT | Westport Fuel | | Consumer Staples | 5.64 | 0 | 0.09% | -14.73% |
| VSTA | Vasta Platform | | Consumer Staples | 3.75 | 35 | -1.32% | -14.77% |
| OTEX | Open Text | | Technology | 35.74 | 42 | -0.78% | -14.95% |
| VIV | Telefonica Brasil | | Technology | 9.30 | 35 | -1.27% | -14.99% |
| CIGI | Colliers | | Financials | 107.48 | 32 | -1.39% | -15.05% |
| EDN | Empresa Distribuidora | | Utilities | 16.45 | 10 | -0.18% | -15.07% |
| RC | Ready Capital | | Financials | 8.70 | 35 | -1.36% | -15.12% |
| ARCO | Arcos Dorados | | Services & Goods | 10.75 | 32 | -1.65% | -15.29% |
| EBR | Centrais Eletricas | | Utilities | 7.21 | 10 | 0.56% | -16.36% |
| BCE | BCE | | Technology | 32.89 | 50 | -0.51% | -16.48% |
| VTRU | Vitru | | Consumer Staples | 13.13 | 42 | 0.69% | -17.00% |
| ELP | Companhia Paranaense | | Utilities | 7.00 | 7 | -0.99% | -17.45% |
| MGA | Magna | | Services & Goods | 48.70 | 25 | -1.04% | -17.57% |
| TAC | TransAlta | | Utilities | 6.83 | 74 | 3.17% | -17.81% |
| ABEV | Ambev S.A | | Consumer Staples | 2.30 | 27 | -0.86% | -17.86% |
| BTG | B2Gold | | Materials | 2.57 | 28 | 0.78% | -18.67% |
| To view more stocks, click on Next / Previous arrows or select different range: 0 - 25 , 25 - 50 , 50 - 75 , 75 - 100 , 100 - 125 , 125 - 150 , 150 - 175 , 175 - 200 , 200 - 225 | ||
 | Click To Change The Sort Order: By Market Cap or Company Size Performance: Year-to-date, Week and Day |  |
| Detailed Overview Of Latin America Stocks |
| Latin America Technical Overview, Leaders & Laggards, Top Latin America ETF Funds & Detailed Latin America Stocks List, Charts, Trends & More |
| Latin America: Technical Analysis, Trends & YTD Performance | |
 ILF Weekly Chart |
|
| Long Term Trend: Not Good | |
| Medium Term Trend: Not Good | |
 ILF Daily Chart |
|
| Short Term Trend: Deteriorating | |
| Overall Trend Score: 18 | |
| YTD Performance: -6.23% | |
| **Trend Scores & Views Are Only For Educational Purposes And Not For Investing | |
| 12Stocks.com: Investing in Latin America Index using Exchange Traded Funds | |
|
The following table shows list of key exchange traded funds (ETF) that
help investors play Latin America stock market. For detailed view, check out our ETF Funds section of our website. Quick View: Move mouse or cursor over ETF symbol (ticker) to view short-term technical chart and over ETF name to view long term chart. Click on ticker or stock name for detailed view. Click on to add stock symbol to your watchlist and to view watchlist. |
12Stocks.com List of ETFs that track Latin America Index
| Ticker | ETF Name | Watchlist | Recent Price | Market Intelligence Score | Change % | Week % | Year-to-date % |
| ILF | Latin America 40 | | 27.25 | 18 | -0.22 | 0.66 | -6.23% |
| EWC | Canada | | 37.50 | 61 | 0.37 | 1.05 | 2.24% |
| FLN | Latin America AlphaDEX | | 19.37 | 31 | -0.51 | 0.78 | -6.83% |
| EWZ | Brazil | | 30.81 | 35 | -0.58 | 0.23 | -11.87% |
| EWW | Mexico | | 65.80 | 18 | 0.05 | 1.4 | -3.02% |
| ARGT | Argentina | | 54.62 | 71 | 0.18 | 2.15 | 6.39% |
| EWZS | Brazil Small-Cap | | 13.06 | 32 | -0.87 | 0.42 | -13.31% |
| BRF | Brazil Small-Cap | | 14.88 | 25 | -0.93 | 0.13 | -15.4% |
| BZQ | Short Brazil | | 12.63 | 63 | 0.84 | -0.8 | 25.92% |
| BRZU | Brazil Bull 3X | | 77.07 | 27 | -1.41 | 0.35 | -25.09% |
| FBZ | Brazil AlphaDEX | | 11.17 | 10 | -0.71 | -0.62 | -8.61% |
| 12Stocks.com: Charts, Trends, Fundamental Data and Performances of Latin America Stocks | |
|
We now take in-depth look at all Latin America stocks including charts, multi-period performances and overall trends (as measured by market intelligence score). One can sort Latin America stocks (click link to choose) by Daily, Weekly and by Year-to-Date performances. Also, one can sort by size of the company or by market capitalization. |
| Select Your Default Chart Type: | |||||
| |||||
| Click on stock symbol or name for detailed view. Click on to add stock symbol to your watchlist and to view watchlist. Quick View: Move mouse or cursor over "Daily" to quickly view daily technical stock chart and over "Weekly" to view weekly technical stock chart. | |||||

 | FMX Fomento Economico Mexicano, S.A.B. de C.V. |
| Sector: Consumer Staples | |
| SubSector: Beverages - Brewers | |
| MarketCap: 22018.7 Millions | |
| Recent Price: 115.11 Market Intelligence Score: 10 | |
| Day Percent Change: -0.68% Day Change: -0.79 | |
| Week Change: -3.83% Year-to-date Change: -11.7% | |
| FMX Links: Profile News Message Board | |
| Charts:- Daily , Weekly | |
| Add FMX to Watchlist: View: Get Complete FMX Trend Analysis ➞ | |
 | ITUB Itau Unibanco Holding S.A. |
| Sector: Financials | |
| SubSector: Foreign Regional Banks | |
| MarketCap: 48121 Millions | |
| Recent Price: 6.11 Market Intelligence Score: 35 | |
| Day Percent Change: -1.61% Day Change: -0.10 | |
| Week Change: 0.99% Year-to-date Change: -12.1% | |
| ITUB Links: Profile News Message Board | |
| Charts:- Daily , Weekly | |
| Add ITUB to Watchlist: View: Get Complete ITUB Trend Analysis ➞ | |
 | XENE Xenon Pharmaceuticals Inc. |
| Sector: Health Care | |
| SubSector: Biotechnology | |
| MarketCap: 388.585 Millions | |
| Recent Price: 40.10 Market Intelligence Score: 0 | |
| Day Percent Change: 1.52% Day Change: 0.60 | |
| Week Change: 0.55% Year-to-date Change: -12.9% | |
| XENE Links: Profile News Message Board | |
| Charts:- Daily , Weekly | |
| Add XENE to Watchlist: View: Get Complete XENE Trend Analysis ➞ | |
 | THTX Theratechnologies Inc. |
| Sector: Health Care | |
| SubSector: Drugs - Generic | |
| MarketCap: 123.185 Millions | |
| Recent Price: 1.41 Market Intelligence Score: 35 | |
| Day Percent Change: 3.68% Day Change: 0.05 | |
| Week Change: 9.3% Year-to-date Change: -13.0% | |
| THTX Links: Profile News Message Board | |
| Charts:- Daily , Weekly | |
| Add THTX to Watchlist: View: Get Complete THTX Trend Analysis ➞ | |
 | CAE CAE Inc. |
| Sector: Industrials | |
| SubSector: Aerospace/Defense Products & Services | |
| MarketCap: 3739.61 Millions | |
| Recent Price: 18.75 Market Intelligence Score: 8 | |
| Day Percent Change: -1.94% Day Change: -0.37 | |
| Week Change: 0.64% Year-to-date Change: -13.2% | |
| CAE Links: Profile News Message Board | |
| Charts:- Daily , Weekly | |
| Add CAE to Watchlist: View: Get Complete CAE Trend Analysis ➞ | |
 | BLCO Bausch + Lomb Corporation |
| Sector: Health Care | |
| SubSector: Medical Instruments & Supplies | |
| MarketCap: 7100 Millions | |
| Recent Price: 14.76 Market Intelligence Score: 51 | |
| Day Percent Change: -0.67% Day Change: -0.10 | |
| Week Change: 0.82% Year-to-date Change: -13.2% | |
| BLCO Links: Profile News Message Board | |
| Charts:- Daily , Weekly | |
| Add BLCO to Watchlist: View: Get Complete BLCO Trend Analysis ➞ | |
 | BIOX Bioceres Crop Solutions Corp. |
| Sector: Industrials | |
| SubSector: Conglomerates | |
| MarketCap: 198.348 Millions | |
| Recent Price: 11.92 Market Intelligence Score: 10 | |
| Day Percent Change: 0.00% Day Change: 0.00 | |
| Week Change: -1.69% Year-to-date Change: -13.2% | |
| BIOX Links: Profile News Message Board | |
| Charts:- Daily , Weekly | |
| Add BIOX to Watchlist: View: Get Complete BIOX Trend Analysis ➞ | |
 | MELI MercadoLibre, Inc. |
| Sector: Services & Goods | |
| SubSector: Catalog & Mail Order Houses | |
| MarketCap: 24695.5 Millions | |
| Recent Price: 1363.83 Market Intelligence Score: 10 | |
| Day Percent Change: -0.45% Day Change: -6.17 | |
| Week Change: 0.55% Year-to-date Change: -13.2% | |
| MELI Links: Profile News Message Board | |
| Charts:- Daily , Weekly | |
| Add MELI to Watchlist: View: Get Complete MELI Trend Analysis ➞ | |
 | STNE StoneCo Ltd. |
| Sector: Technology | |
| SubSector: Application Software | |
| MarketCap: 7347.82 Millions | |
| Recent Price: 15.55 Market Intelligence Score: 20 | |
| Day Percent Change: -1.77% Day Change: -0.28 | |
| Week Change: 1.63% Year-to-date Change: -13.8% | |
| STNE Links: Profile News Message Board | |
| Charts:- Daily , Weekly | |
| Add STNE to Watchlist: View: Get Complete STNE Trend Analysis ➞ | |
 | WPRT Westport Fuel Systems Inc. |
| Sector: Consumer Staples | |
| SubSector: Auto Parts | |
| MarketCap: 108.939 Millions | |
| Recent Price: 5.64 Market Intelligence Score: 0 | |
| Day Percent Change: 0.09% Day Change: 0.00 | |
| Week Change: -1.66% Year-to-date Change: -14.7% | |
| WPRT Links: Profile News Message Board | |
| Charts:- Daily , Weekly | |
| Add WPRT to Watchlist: View: Get Complete WPRT Trend Analysis ➞ | |
 | VSTA Vasta Platform Limited |
| Sector: Consumer Staples | |
| SubSector: Education & Training Services | |
| MarketCap: 12747 Millions | |
| Recent Price: 3.75 Market Intelligence Score: 35 | |
| Day Percent Change: -1.32% Day Change: -0.05 | |
| Week Change: 0% Year-to-date Change: -14.8% | |
| VSTA Links: Profile News Message Board | |
| Charts:- Daily , Weekly | |
| Add VSTA to Watchlist: View: Get Complete VSTA Trend Analysis ➞ | |
 | OTEX Open Text Corporation |
| Sector: Technology | |
| SubSector: Application Software | |
| MarketCap: 9291.92 Millions | |
| Recent Price: 35.74 Market Intelligence Score: 42 | |
| Day Percent Change: -0.78% Day Change: -0.28 | |
| Week Change: 1.97% Year-to-date Change: -15.0% | |
| OTEX Links: Profile News Message Board | |
| Charts:- Daily , Weekly | |
| Add OTEX to Watchlist: View: Get Complete OTEX Trend Analysis ➞ | |
 | VIV Telefonica Brasil S.A. |
| Sector: Technology | |
| SubSector: Wireless Communications | |
| MarketCap: 19611.1 Millions | |
| Recent Price: 9.30 Market Intelligence Score: 35 | |
| Day Percent Change: -1.27% Day Change: -0.12 | |
| Week Change: -0.53% Year-to-date Change: -15.0% | |
| VIV Links: Profile News Message Board | |
| Charts:- Daily , Weekly | |
| Add VIV to Watchlist: View: Get Complete VIV Trend Analysis ➞ | |
 | CIGI Colliers International Group Inc. |
| Sector: Financials | |
| SubSector: Property Management | |
| MarketCap: 1928.42 Millions | |
| Recent Price: 107.48 Market Intelligence Score: 32 | |
| Day Percent Change: -1.39% Day Change: -1.52 | |
| Week Change: 1.19% Year-to-date Change: -15.1% | |
| CIGI Links: Profile News Message Board | |
| Charts:- Daily , Weekly | |
| Add CIGI to Watchlist: View: Get Complete CIGI Trend Analysis ➞ | |
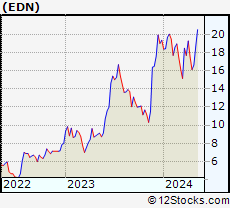 | EDN Empresa Distribuidora y Comercializadora Norte Sociedad Anonima |
| Sector: Utilities | |
| SubSector: Electric Utilities | |
| MarketCap: 105.914 Millions | |
| Recent Price: 16.45 Market Intelligence Score: 10 | |
| Day Percent Change: -0.18% Day Change: -0.03 | |
| Week Change: 1.92% Year-to-date Change: -15.1% | |
| EDN Links: Profile News Message Board | |
| Charts:- Daily , Weekly | |
| Add EDN to Watchlist: View: Get Complete EDN Trend Analysis ➞ | |
 | RC Ready Capital Corporation |
| Sector: Financials | |
| SubSector: Mortgage Investment | |
| MarketCap: 358.039 Millions | |
| Recent Price: 8.70 Market Intelligence Score: 35 | |
| Day Percent Change: -1.36% Day Change: -0.12 | |
| Week Change: 0.93% Year-to-date Change: -15.1% | |
| RC Links: Profile News Message Board | |
| Charts:- Daily , Weekly | |
| Add RC to Watchlist: View: Get Complete RC Trend Analysis ➞ | |
 | ARCO Arcos Dorados Holdings Inc. |
| Sector: Services & Goods | |
| SubSector: Restaurants | |
| MarketCap: 778.87 Millions | |
| Recent Price: 10.75 Market Intelligence Score: 32 | |
| Day Percent Change: -1.65% Day Change: -0.18 | |
| Week Change: -1.38% Year-to-date Change: -15.3% | |
| ARCO Links: Profile News Message Board | |
| Charts:- Daily , Weekly | |
| Add ARCO to Watchlist: View: Get Complete ARCO Trend Analysis ➞ | |
 | EBR Centrais Eletricas Brasileiras S.A. - Eletrobras |
| Sector: Utilities | |
| SubSector: Electric Utilities | |
| MarketCap: 5459.84 Millions | |
| Recent Price: 7.21 Market Intelligence Score: 10 | |
| Day Percent Change: 0.56% Day Change: 0.04 | |
| Week Change: -1.77% Year-to-date Change: -16.4% | |
| EBR Links: Profile News Message Board | |
| Charts:- Daily , Weekly | |
| Add EBR to Watchlist: View: Get Complete EBR Trend Analysis ➞ | |
 | BCE BCE Inc. |
| Sector: Technology | |
| SubSector: Telecom Services - Domestic | |
| MarketCap: 37288.3 Millions | |
| Recent Price: 32.89 Market Intelligence Score: 50 | |
| Day Percent Change: -0.51% Day Change: -0.17 | |
| Week Change: 0.92% Year-to-date Change: -16.5% | |
| BCE Links: Profile News Message Board | |
| Charts:- Daily , Weekly | |
| Add BCE to Watchlist: View: Get Complete BCE Trend Analysis ➞ | |
 | VTRU Vitru Limited |
| Sector: Consumer Staples | |
| SubSector: Education & Training Services | |
| MarketCap: 33347 Millions | |
| Recent Price: 13.13 Market Intelligence Score: 42 | |
| Day Percent Change: 0.69% Day Change: 0.09 | |
| Week Change: 6.49% Year-to-date Change: -17.0% | |
| VTRU Links: Profile News Message Board | |
| Charts:- Daily , Weekly | |
| Add VTRU to Watchlist: View: Get Complete VTRU Trend Analysis ➞ | |
 | ELP Companhia Paranaense de Energia - COPEL |
| Sector: Utilities | |
| SubSector: Electric Utilities | |
| MarketCap: 3352.84 Millions | |
| Recent Price: 7.00 Market Intelligence Score: 7 | |
| Day Percent Change: -0.99% Day Change: -0.07 | |
| Week Change: -4.24% Year-to-date Change: -17.5% | |
| ELP Links: Profile News Message Board | |
| Charts:- Daily , Weekly | |
| Add ELP to Watchlist: View: Get Complete ELP Trend Analysis ➞ | |
 | MGA Magna International Inc. |
| Sector: Services & Goods | |
| SubSector: Auto Parts Wholesale | |
| MarketCap: 8967.3 Millions | |
| Recent Price: 48.70 Market Intelligence Score: 25 | |
| Day Percent Change: -1.04% Day Change: -0.51 | |
| Week Change: 0.74% Year-to-date Change: -17.6% | |
| MGA Links: Profile News Message Board | |
| Charts:- Daily , Weekly | |
| Add MGA to Watchlist: View: Get Complete MGA Trend Analysis ➞ | |
 | TAC TransAlta Corporation |
| Sector: Utilities | |
| SubSector: Diversified Utilities | |
| MarketCap: 1487.8 Millions | |
| Recent Price: 6.83 Market Intelligence Score: 74 | |
| Day Percent Change: 3.17% Day Change: 0.21 | |
| Week Change: 5.89% Year-to-date Change: -17.8% | |
| TAC Links: Profile News Message Board | |
| Charts:- Daily , Weekly | |
| Add TAC to Watchlist: View: Get Complete TAC Trend Analysis ➞ | |
 | ABEV Ambev S.A. |
| Sector: Consumer Staples | |
| SubSector: Beverages - Brewers | |
| MarketCap: 37753.5 Millions | |
| Recent Price: 2.30 Market Intelligence Score: 27 | |
| Day Percent Change: -0.86% Day Change: -0.02 | |
| Week Change: 0.44% Year-to-date Change: -17.9% | |
| ABEV Links: Profile News Message Board | |
| Charts:- Daily , Weekly | |
| Add ABEV to Watchlist: View: Get Complete ABEV Trend Analysis ➞ | |
 | BTG B2Gold Corp. |
| Sector: Materials | |
| SubSector: Gold | |
| MarketCap: 2792.39 Millions | |
| Recent Price: 2.57 Market Intelligence Score: 28 | |
| Day Percent Change: 0.78% Day Change: 0.02 | |
| Week Change: -1.15% Year-to-date Change: -18.7% | |
| BTG Links: Profile News Message Board | |
| Charts:- Daily , Weekly | |
| Add BTG to Watchlist: View: Get Complete BTG Trend Analysis ➞ | |
| To view more stocks, click on Next / Previous arrows or select different range: 0 - 25 , 25 - 50 , 50 - 75 , 75 - 100 , 100 - 125 , 125 - 150 , 150 - 175 , 175 - 200 , 200 - 225 | ||
| Click To Change The Sort Order: By Market Cap or Company Size Performance: Year-to-date, Week and Day | |
| Select Chart Type: | ||
 Best Stocks Today 12Stocks.com |
© 2024 12Stocks.com Terms & Conditions Privacy Contact Us
All Information Provided Only For Education And Not To Be Used For Investing or Trading. See Terms & Conditions


One More Thing ... Get Best Stocks Delivered Daily!
Never Ever Miss A Move With Our Top Ten Stocks Lists
Find Best Stocks In Any Market - Bull or Bear Market
Take A Peek At Our Top Ten Stocks Lists: Daily, Weekly, Year-to-Date & Top Trends
Find Best Stocks In Any Market - Bull or Bear Market
Take A Peek At Our Top Ten Stocks Lists: Daily, Weekly, Year-to-Date & Top Trends
Latin America Stocks With Best Up Trends [0-bearish to 100-bullish]: SilverCrest Metals[100], Grupo Aeroportuario[100], Mercer [100], Descartes Systems[100], Hudbay Minerals[95], Triple Flag[95], Grupo Aeroportuario[93], SunOpta [93], Despegar.com [90], Controladora Vuela[88], BRF S.A[88]
Best Latin America Stocks Year-to-Date:
Aurora Cannabis[1311.17%], Fusion [123.13%], Banco Macro[71.01%], Grupo Financiero[70.81%], Canopy Growth[70.06%], D-Wave Quantum[68.68%], McEwen Mining[65.6%], Banco BBVA[64.71%], Celestica [47.71%], Hudbay Minerals[47.1%], IAMGOLD [46.64%] Best Latin America Stocks This Week:
Grupo Aeroportuario[15.25%], Grupo Aeroportuario[13.53%], Grupo Aeroportuario[12.82%], Controladora Vuela[12.56%], SunOpta [9.9%], Despegar.com [9.61%], Canopy Growth[9.45%], Afya [8.75%], Central Puerto[7.78%], SilverCrest Metals[7.72%], Trilogy Metals[7.58%] Best Latin America Stocks Daily:
McEwen Mining[9.34%], Teck Resources[9.02%], New Gold[5.23%], Grupo Aeroportuario[5.18%], Hudbay Minerals[4.91%], Afya [4.69%], Trilogy Metals[4.56%], SilverCrest Metals[4.42%], Endeavour Silver[3.33%], Coca-Cola FEMSA[3.22%], TransAlta [3.17%]