
 Login Sign Up


| |||||
 |  | ||||

| 12Stocks.com Market Intelligence |
Best Latin America Stocks
|
|
| Quick Read: Top Latin America Stocks By Performances & Trends: Daily, Weekly, Year-to-Date, Market Cap (Size) & Technical Trends | |||
| Best Latin America Views: Quick Browse View, Summary & Slide Show | |||
| 12Stocks.com Latin America Stocks Performances & Trends Daily | |||||||||
|
|  The overall market intelligence score is 32 (0-bearish to 100-bullish) which puts Latin America index in short term bearish to neutral trend. The market intelligence score from previous trading session is 0 and an improvement of trend continues.
| ||||||||
| Here are the market intelligence trend scores of the most requested Latin America stocks at 12Stocks.com (click stock name for detailed review): | |
| Scroll down this page for most comprehensive review of Latin America stocks by performance, trends, technical analysis, charts, fund plays & more | |


| 12Stocks.com: Top Performing Latin America Index Stocks | ||||||||||||||||||||||||||||||||||||||||||||||||
 The top performing Latin America Index stocks year to date are
Now, more recently, over last week, the top performing Latin America Index stocks on the move are


|
||||||||||||||||||||||||||||||||||||||||||||||||
| 12Stocks.com: Investing in Latin America Index with Stocks | |
|
The following table helps investors and traders sort through current performance and trends (as measured by market intelligence score) of various
stocks in the Latin America Index. Quick View: Move mouse or cursor over stock symbol (ticker) to view short-term technical chart and over stock name to view long term chart. Click on  to add stock symbol to your watchlist and to add stock symbol to your watchlist and  to view watchlist. Click on any ticker or stock name for detailed market intelligence report for that stock. to view watchlist. Click on any ticker or stock name for detailed market intelligence report for that stock. |
12Stocks.com Performance of Stocks in Latin America Index
| Ticker | Stock Name | Watchlist | Category | Recent Price | Market Intelligence Score | Change % | YTD Change% |
| PAGS | PagSeguro Digital |   | Financials | 11.93 | 10 | 1.19% | -4.33% |
| SHOP | Shopify | | Technology | 74.40 | 49 | 5.46% | -4.49% |
| AQNU | Algonquin Power | | Utilities | 21.22 | 62 | 0.90% | -4.50% |
| UGP | Ultrapar Participacoes | | Energy | 5.17 | 25 | -0.29% | -4.52% |
| FTS | Fortis | | Utilities | 39.20 | 67 | 0.50% | -4.68% |
| QSR | Restaurant Brands | | Services & Goods | 74.34 | 49 | 1.42% | -4.85% |
| BMO | Bank of Montreal | | Financials | 93.75 | 42 | 0.82% | -5.25% |
| LND | BrasilAgro - | | Financials | 5.00 | 67 | 0.60% | -5.30% |
| FSV | FirstService | | Financials | 153.47 | 10 | 0.88% | -5.32% |
| EDSA | Edesa Biotech | | Health Care | 4.38 | 10 | -1.79% | -5.60% |
| TIXT | TELUS | | Technology | 8.06 | 42 | 0.62% | -5.73% |
| VINP | Vi Partners | | Financials | 10.30 | 32 | -1.81% | -6.28% |
| INTR | Inter & Co | | Financials | 5.24 | 58 | 0.48% | -6.60% |
| NTR | Nutrien | | Materials | 52.19 | 46 | -0.21% | -7.35% |
| DCBO | Docebo | | Technology | 44.84 | 23 | 1.60% | -7.36% |
| TMQ | Trilogy Metals | | Materials | 0.40 | 25 | -3.34% | -7.88% |
| VTMX | Vesta Financials | | Financials | 36.58 | 49 | 0.91% | -8.01% |
| NAK | Northern Dynasty | | Materials | 0.30 | 48 | 1.88% | -8.01% |
| PAM | Pampa Energia | | Utilities | 45.55 | 49 | -1.52% | -8.03% |
| TRP | TC Energy | | Energy | 35.92 | 32 | 0.04% | -8.10% |
| TD | Toronto-Dominion Bank | | Financials | 58.89 | 59 | 0.56% | -8.87% |
| TU | TELUS | | Technology | 16.16 | 67 | 0.59% | -9.13% |
| ITUB | Itau Unibanco | | Financials | 6.31 | 42 | 3.44% | -9.21% |
| PROF | Profound Medical | | Materials | 7.68 | 10 | -0.52% | -9.54% |
| FMX | Fomento Economico | | Consumer Staples | 117.60 | 10 | -0.77% | -9.78% |
| To view more stocks, click on Next / Previous arrows or select different range: 0 - 25 , 25 - 50 , 50 - 75 , 75 - 100 , 100 - 125 , 125 - 150 , 150 - 175 , 175 - 200 , 200 - 225 | ||
 | Click To Change The Sort Order: By Market Cap or Company Size Performance: Year-to-date, Week and Day |  |
| Detailed Overview Of Latin America Stocks |
| Latin America Technical Overview, Leaders & Laggards, Top Latin America ETF Funds & Detailed Latin America Stocks List, Charts, Trends & More |
| Latin America: Technical Analysis, Trends & YTD Performance | |
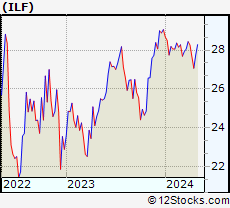
 ILF Weekly Chart |
|
| Long Term Trend: Not Good | |
| Medium Term Trend: Not Good | |
 ILF Daily Chart |
|
| Short Term Trend: Very Good | |
| Overall Trend Score: 32 | |
| YTD Performance: -5.2% | |
| **Trend Scores & Views Are Only For Educational Purposes And Not For Investing | |
| 12Stocks.com: Investing in Latin America Index using Exchange Traded Funds | |
|
The following table shows list of key exchange traded funds (ETF) that
help investors play Latin America stock market. For detailed view, check out our ETF Funds section of our website. Quick View: Move mouse or cursor over ETF symbol (ticker) to view short-term technical chart and over ETF name to view long term chart. Click on ticker or stock name for detailed view. Click on to add stock symbol to your watchlist and to view watchlist. |
12Stocks.com List of ETFs that track Latin America Index
| Ticker | ETF Name | Watchlist | Recent Price | Market Intelligence Score | Change % | Week % | Year-to-date % |
| ILF | Latin America 40 | | 27.55 | 32 | 0.92 | 1.77 | -5.2% |
| EWC | Canada | | 37.77 | 75 | 1.08 | 1.77 | 2.96% |
| FLN | Latin America AlphaDEX | | 19.54 | 32 | 0.54 | 1.64 | -6.04% |
| EWZ | Brazil | | 31.29 | 49 | 0.90 | 1.79 | -10.5% |
| EWW | Mexico | | 66.47 | 32 | 1.33 | 2.44 | -2.03% |
| ARGT | Argentina | | 56.19 | 93 | 0.72 | 5.09 | 9.45% |
| EWZS | Brazil Small-Cap | | 13.15 | 32 | -0.30 | 1.15 | -12.68% |
| BRF | Brazil Small-Cap | | 15.15 | 32 | 1.07 | 1.95 | -13.86% |
| BZQ | Short Brazil | | 12.33 | 56 | -1.61 | -3.17 | 22.92% |
| BRZU | Brazil Bull 3X | | 79.44 | 49 | 1.68 | 3.44 | -22.78% |
| FBZ | Brazil AlphaDEX | | 11.33 | 32 | 0.09 | 0.8 | -7.3% |
| 12Stocks.com: Charts, Trends, Fundamental Data and Performances of Latin America Stocks | |
|
We now take in-depth look at all Latin America stocks including charts, multi-period performances and overall trends (as measured by market intelligence score). One can sort Latin America stocks (click link to choose) by Daily, Weekly and by Year-to-Date performances. Also, one can sort by size of the company or by market capitalization. |
| Select Your Default Chart Type: | |||||
| |||||
| Click on stock symbol or name for detailed view. Click on to add stock symbol to your watchlist and to view watchlist. Quick View: Move mouse or cursor over "Daily" to quickly view daily technical stock chart and over "Weekly" to view weekly technical stock chart. | |||||

 | PAGS PagSeguro Digital Ltd. |
| Sector: Financials | |
| SubSector: Credit Services | |
| MarketCap: 6500.78 Millions | |
| Recent Price: 11.93 Market Intelligence Score: 10 | |
| Day Percent Change: 1.19% Day Change: 0.14 | |
| Week Change: 3.92% Year-to-date Change: -4.3% | |
| PAGS Links: Profile News Message Board | |
| Charts:- Daily , Weekly | |
| Add PAGS to Watchlist: View: Get Complete PAGS Trend Analysis ➞ | |
 | SHOP Shopify Inc. |
| Sector: Technology | |
| SubSector: Application Software | |
| MarketCap: 45164.2 Millions | |
| Recent Price: 74.40 Market Intelligence Score: 49 | |
| Day Percent Change: 5.46% Day Change: 3.85 | |
| Week Change: 6.79% Year-to-date Change: -4.5% | |
| SHOP Links: Profile News Message Board | |
| Charts:- Daily , Weekly | |
| Add SHOP to Watchlist: View: Get Complete SHOP Trend Analysis ➞ | |
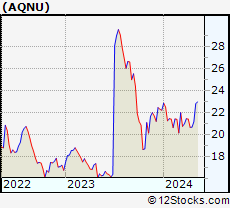 | AQNU Algonquin Power & Utilities Corp. |
| Sector: Utilities | |
| SubSector: Utilities - Renewable | |
| MarketCap: 5690 Millions | |
| Recent Price: 21.22 Market Intelligence Score: 62 | |
| Day Percent Change: 0.90% Day Change: 0.19 | |
| Week Change: 2.66% Year-to-date Change: -4.5% | |
| AQNU Links: Profile News Message Board | |
| Charts:- Daily , Weekly | |
| Add AQNU to Watchlist: View: Get Complete AQNU Trend Analysis ➞ | |
 | UGP Ultrapar Participacoes S.A. |
| Sector: Energy | |
| SubSector: Oil & Gas Refining & Marketing | |
| MarketCap: 3473.54 Millions | |
| Recent Price: 5.17 Market Intelligence Score: 25 | |
| Day Percent Change: -0.29% Day Change: -0.02 | |
| Week Change: 0.49% Year-to-date Change: -4.5% | |
| UGP Links: Profile News Message Board | |
| Charts:- Daily , Weekly | |
| Add UGP to Watchlist: View: Get Complete UGP Trend Analysis ➞ | |
 | FTS Fortis Inc. |
| Sector: Utilities | |
| SubSector: Electric Utilities | |
| MarketCap: 14741.8 Millions | |
| Recent Price: 39.20 Market Intelligence Score: 67 | |
| Day Percent Change: 0.50% Day Change: 0.20 | |
| Week Change: 1.91% Year-to-date Change: -4.7% | |
| FTS Links: Profile News Message Board | |
| Charts:- Daily , Weekly | |
| Add FTS to Watchlist: View: Get Complete FTS Trend Analysis ➞ | |
 | QSR Restaurant Brands International Inc. |
| Sector: Services & Goods | |
| SubSector: Restaurants | |
| MarketCap: 9551 Millions | |
| Recent Price: 74.34 Market Intelligence Score: 49 | |
| Day Percent Change: 1.42% Day Change: 1.04 | |
| Week Change: 4.09% Year-to-date Change: -4.9% | |
| QSR Links: Profile News Message Board | |
| Charts:- Daily , Weekly | |
| Add QSR to Watchlist: View: Get Complete QSR Trend Analysis ➞ | |
 | BMO Bank of Montreal |
| Sector: Financials | |
| SubSector: Money Center Banks | |
| MarketCap: 32830.2 Millions | |
| Recent Price: 93.75 Market Intelligence Score: 42 | |
| Day Percent Change: 0.82% Day Change: 0.76 | |
| Week Change: 1.75% Year-to-date Change: -5.3% | |
| BMO Links: Profile News Message Board | |
| Charts:- Daily , Weekly | |
| Add BMO to Watchlist: View: Get Complete BMO Trend Analysis ➞ | |
 | LND BrasilAgro - Companhia Brasileira de Propriedades Agricolas |
| Sector: Financials | |
| SubSector: Property Management | |
| MarketCap: 157.842 Millions | |
| Recent Price: 5.00 Market Intelligence Score: 67 | |
| Day Percent Change: 0.60% Day Change: 0.03 | |
| Week Change: -0.2% Year-to-date Change: -5.3% | |
| LND Links: Profile News Message Board | |
| Charts:- Daily , Weekly | |
| Add LND to Watchlist: View: Get Complete LND Trend Analysis ➞ | |
 | FSV FirstService Corporation |
| Sector: Financials | |
| SubSector: Property Management | |
| MarketCap: 2793.92 Millions | |
| Recent Price: 153.47 Market Intelligence Score: 10 | |
| Day Percent Change: 0.88% Day Change: 1.34 | |
| Week Change: 2.71% Year-to-date Change: -5.3% | |
| FSV Links: Profile News Message Board | |
| Charts:- Daily , Weekly | |
| Add FSV to Watchlist: View: Get Complete FSV Trend Analysis ➞ | |
 | EDSA Edesa Biotech, Inc. |
| Sector: Health Care | |
| SubSector: Biotechnology | |
| MarketCap: 19.6785 Millions | |
| Recent Price: 4.38 Market Intelligence Score: 10 | |
| Day Percent Change: -1.79% Day Change: -0.08 | |
| Week Change: -2.01% Year-to-date Change: -5.6% | |
| EDSA Links: Profile News Message Board | |
| Charts:- Daily , Weekly | |
| Add EDSA to Watchlist: View: Get Complete EDSA Trend Analysis ➞ | |
 | TIXT TELUS International (Cda) Inc. |
| Sector: Technology | |
| SubSector: Software - Infrastructure | |
| MarketCap: 1470 Millions | |
| Recent Price: 8.06 Market Intelligence Score: 42 | |
| Day Percent Change: 0.62% Day Change: 0.05 | |
| Week Change: 3.2% Year-to-date Change: -5.7% | |
| TIXT Links: Profile News Message Board | |
| Charts:- Daily , Weekly | |
| Add TIXT to Watchlist: View: Get Complete TIXT Trend Analysis ➞ | |
 | VINP Vinci Partners Investments Ltd. |
| Sector: Financials | |
| SubSector: Asset Management | |
| MarketCap: 537 Millions | |
| Recent Price: 10.30 Market Intelligence Score: 32 | |
| Day Percent Change: -1.81% Day Change: -0.19 | |
| Week Change: 0.49% Year-to-date Change: -6.3% | |
| VINP Links: Profile News Message Board | |
| Charts:- Daily , Weekly | |
| Add VINP to Watchlist: View: Get Complete VINP Trend Analysis ➞ | |
 | INTR Inter & Co, Inc. |
| Sector: Financials | |
| SubSector: Banks - Regional | |
| MarketCap: 1250 Millions | |
| Recent Price: 5.24 Market Intelligence Score: 58 | |
| Day Percent Change: 0.48% Day Change: 0.03 | |
| Week Change: 0.48% Year-to-date Change: -6.6% | |
| INTR Links: Profile News Message Board | |
| Charts:- Daily , Weekly | |
| Add INTR to Watchlist: View: Get Complete INTR Trend Analysis ➞ | |
 | NTR Nutrien Ltd. |
| Sector: Materials | |
| SubSector: Agricultural Chemicals | |
| MarketCap: 15897.9 Millions | |
| Recent Price: 52.19 Market Intelligence Score: 46 | |
| Day Percent Change: -0.21% Day Change: -0.11 | |
| Week Change: -1.12% Year-to-date Change: -7.4% | |
| NTR Links: Profile News Message Board | |
| Charts:- Daily , Weekly | |
| Add NTR to Watchlist: View: Get Complete NTR Trend Analysis ➞ | |
 | DCBO Docebo Inc. |
| Sector: Technology | |
| SubSector: Software Application | |
| MarketCap: 15787 Millions | |
| Recent Price: 44.84 Market Intelligence Score: 23 | |
| Day Percent Change: 1.60% Day Change: 0.70 | |
| Week Change: 1.16% Year-to-date Change: -7.4% | |
| DCBO Links: Profile News Message Board | |
| Charts:- Daily , Weekly | |
| Add DCBO to Watchlist: View: Get Complete DCBO Trend Analysis ➞ | |
 | TMQ Trilogy Metals Inc. |
| Sector: Materials | |
| SubSector: Industrial Metals & Minerals | |
| MarketCap: 151.21 Millions | |
| Recent Price: 0.40 Market Intelligence Score: 25 | |
| Day Percent Change: -3.34% Day Change: -0.01 | |
| Week Change: 0.41% Year-to-date Change: -7.9% | |
| TMQ Links: Profile News Message Board | |
| Charts:- Daily , Weekly | |
| Add TMQ to Watchlist: View: Get Complete TMQ Trend Analysis ➞ | |
 | VTMX Vesta Financials Corp SAB de CV |
| Sector: Financials | |
| SubSector: REIT - Industrial | |
| MarketCap: 2270 Millions | |
| Recent Price: 36.58 Market Intelligence Score: 49 | |
| Day Percent Change: 0.91% Day Change: 0.33 | |
| Week Change: 3.8% Year-to-date Change: -8.0% | |
| VTMX Links: Profile News Message Board | |
| Charts:- Daily , Weekly | |
| Add VTMX to Watchlist: View: Get Complete VTMX Trend Analysis ➞ | |
 | NAK Northern Dynasty Minerals Ltd. |
| Sector: Materials | |
| SubSector: Industrial Metals & Minerals | |
| MarketCap: 167.01 Millions | |
| Recent Price: 0.30 Market Intelligence Score: 48 | |
| Day Percent Change: 1.88% Day Change: 0.01 | |
| Week Change: 1.64% Year-to-date Change: -8.0% | |
| NAK Links: Profile News Message Board | |
| Charts:- Daily , Weekly | |
| Add NAK to Watchlist: View: Get Complete NAK Trend Analysis ➞ | |
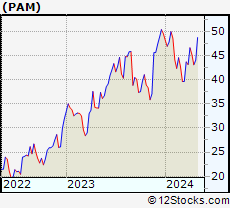 | PAM Pampa Energia S.A. |
| Sector: Utilities | |
| SubSector: Electric Utilities | |
| MarketCap: 1004.14 Millions | |
| Recent Price: 45.55 Market Intelligence Score: 49 | |
| Day Percent Change: -1.52% Day Change: -0.70 | |
| Week Change: 5.72% Year-to-date Change: -8.0% | |
| PAM Links: Profile News Message Board | |
| Charts:- Daily , Weekly | |
| Add PAM to Watchlist: View: Get Complete PAM Trend Analysis ➞ | |
 | TRP TC Energy Corporation |
| Sector: Energy | |
| SubSector: Oil & Gas Pipelines | |
| MarketCap: 44071.1 Millions | |
| Recent Price: 35.92 Market Intelligence Score: 32 | |
| Day Percent Change: 0.04% Day Change: 0.02 | |
| Week Change: 0.63% Year-to-date Change: -8.1% | |
| TRP Links: Profile News Message Board | |
| Charts:- Daily , Weekly | |
| Add TRP to Watchlist: View: Get Complete TRP Trend Analysis ➞ | |
 | TD The Toronto-Dominion Bank |
| Sector: Financials | |
| SubSector: Money Center Banks | |
| MarketCap: 75152.4 Millions | |
| Recent Price: 58.89 Market Intelligence Score: 59 | |
| Day Percent Change: 0.56% Day Change: 0.33 | |
| Week Change: 1.38% Year-to-date Change: -8.9% | |
| TD Links: Profile News Message Board | |
| Charts:- Daily , Weekly | |
| Add TD to Watchlist: View: Get Complete TD Trend Analysis ➞ | |
 | TU TELUS Corporation |
| Sector: Technology | |
| SubSector: Wireless Communications | |
| MarketCap: 10864.7 Millions | |
| Recent Price: 16.16 Market Intelligence Score: 67 | |
| Day Percent Change: 0.59% Day Change: 0.09 | |
| Week Change: 1.54% Year-to-date Change: -9.1% | |
| TU Links: Profile News Message Board | |
| Charts:- Daily , Weekly | |
| Add TU to Watchlist: View: Get Complete TU Trend Analysis ➞ | |
 | ITUB Itau Unibanco Holding S.A. |
| Sector: Financials | |
| SubSector: Foreign Regional Banks | |
| MarketCap: 48121 Millions | |
| Recent Price: 6.31 Market Intelligence Score: 42 | |
| Day Percent Change: 3.44% Day Change: 0.21 | |
| Week Change: 4.3% Year-to-date Change: -9.2% | |
| ITUB Links: Profile News Message Board | |
| Charts:- Daily , Weekly | |
| Add ITUB to Watchlist: View: Get Complete ITUB Trend Analysis ➞ | |
 | PROF Profound Medical Corp. |
| Sector: Materials | |
| SubSector: Industrial Metals & Minerals | |
| MarketCap: 121.41 Millions | |
| Recent Price: 7.68 Market Intelligence Score: 10 | |
| Day Percent Change: -0.52% Day Change: -0.04 | |
| Week Change: 2.26% Year-to-date Change: -9.5% | |
| PROF Links: Profile News Message Board | |
| Charts:- Daily , Weekly | |
| Add PROF to Watchlist: View: Get Complete PROF Trend Analysis ➞ | |
 | FMX Fomento Economico Mexicano, S.A.B. de C.V. |
| Sector: Consumer Staples | |
| SubSector: Beverages - Brewers | |
| MarketCap: 22018.7 Millions | |
| Recent Price: 117.60 Market Intelligence Score: 10 | |
| Day Percent Change: -0.77% Day Change: -0.91 | |
| Week Change: -1.75% Year-to-date Change: -9.8% | |
| FMX Links: Profile News Message Board | |
| Charts:- Daily , Weekly | |
| Add FMX to Watchlist: View: Get Complete FMX Trend Analysis ➞ | |
| To view more stocks, click on Next / Previous arrows or select different range: 0 - 25 , 25 - 50 , 50 - 75 , 75 - 100 , 100 - 125 , 125 - 150 , 150 - 175 , 175 - 200 , 200 - 225 | ||
| Click To Change The Sort Order: By Market Cap or Company Size Performance: Year-to-date, Week and Day | |
| Select Chart Type: | ||
 Best Stocks Today 12Stocks.com |
© 2024 12Stocks.com Terms & Conditions Privacy Contact Us
All Information Provided Only For Education And Not To Be Used For Investing or Trading. See Terms & Conditions


One More Thing ... Get Best Stocks Delivered Daily!
Never Ever Miss A Move With Our Top Ten Stocks Lists
Find Best Stocks In Any Market - Bull or Bear Market
Take A Peek At Our Top Ten Stocks Lists: Daily, Weekly, Year-to-Date & Top Trends
Find Best Stocks In Any Market - Bull or Bear Market
Take A Peek At Our Top Ten Stocks Lists: Daily, Weekly, Year-to-Date & Top Trends
Latin America Stocks With Best Up Trends [0-bearish to 100-bullish]: Grupo Aeroportuario[100], Controladora Vuela[100], Descartes Systems[100], Grupo Financiero[100], Cresud Sociedad[100], Grupo Supervielle[100], IRSA Inversiones[100], Grupo Aeroportuario[93], America Movil[93], Banco Macro[90], Cenovus Energy[88]
Best Latin America Stocks Year-to-Date:
Aurora Cannabis[1444.52%], Fusion [123.13%], Banco Macro[81.22%], Grupo Financiero[78.51%], D-Wave Quantum[76.66%], Canopy Growth[74.56%], Banco BBVA[71.69%], McEwen Mining[52.98%], Celestica [50.51%], Grupo Supervielle[50.25%], OrganiGram [49.62%] Best Latin America Stocks This Week:
Grupo Aeroportuario[14.47%], Aurora Cannabis[13.85%], Central Puerto[13.31%], Repare [13.25%], Canopy Growth[12.34%], Grupo Supervielle[10.91%], Grupo Aeroportuario[9.87%], SunOpta [9.4%], Li-Cycle [9.22%], Banco BBVA[8.98%], Telecom Argentina[8.84%] Best Latin America Stocks Daily:
Aurora Cannabis[17.12%], Canopy Growth[13.63%], Grupo Aeroportuario[11.41%], Tilray [7.85%], IAMGOLD [7.59%], Grupo Aeroportuario[7.41%], Endeavour Silver[6.84%], Grupo Aeroportuario[6.74%], New Found[5.82%], Shopify [5.46%], Cronos [5.08%]