
 Login Sign Up


| |||||
 |  | ||||

| 12Stocks.com Market Intelligence |
Best Latin America Stocks
|
|
| Quick Read: Top Latin America Stocks By Performances & Trends: Daily, Weekly, Year-to-Date, Market Cap (Size) & Technical Trends | |||
| Best Latin America Views: Quick Browse View, Summary & Slide Show | |||
| 12Stocks.com Latin America Stocks Performances & Trends Daily | |||||||||
|
|  The overall market intelligence score is 25 (0-bearish to 100-bullish) which puts Latin America index in short term bearish to neutral trend. The market intelligence score from previous trading session is 42 and hence a deterioration of trend.
| ||||||||
| Here are the market intelligence trend scores of the most requested Latin America stocks at 12Stocks.com (click stock name for detailed review): | |
| Scroll down this page for most comprehensive review of Latin America stocks by performance, trends, technical analysis, charts, fund plays & more | |


| 12Stocks.com: Top Performing Latin America Index Stocks | ||||||||||||||||||||||||||||||||||||||||||||||||
 The top performing Latin America Index stocks year to date are
Now, more recently, over last week, the top performing Latin America Index stocks on the move are


|
||||||||||||||||||||||||||||||||||||||||||||||||
| 12Stocks.com: Investing in Latin America Index with Stocks | |
|
The following table helps investors and traders sort through current performance and trends (as measured by market intelligence score) of various
stocks in the Latin America Index. Quick View: Move mouse or cursor over stock symbol (ticker) to view short-term technical chart and over stock name to view long term chart. Click on  to add stock symbol to your watchlist and to add stock symbol to your watchlist and  to view watchlist. Click on any ticker or stock name for detailed market intelligence report for that stock. to view watchlist. Click on any ticker or stock name for detailed market intelligence report for that stock. |
12Stocks.com Performance of Stocks in Latin America Index
| Ticker | Stock Name | Watchlist | Category | Recent Price | Market Intelligence Score | Change % | YTD Change% |
| VET | Vermilion Energy |   | Energy | 11.83 | 61 | -1.42 | -1.91% |
| SID | Companhia Siderurgica | | Materials | 2.78 | 27 | -1.42 | -29.26% |
| THTX | Thera | | Health Care | 1.35 | 35 | -1.46 | -16.67% |
| EBR | Centrais Eletricas | | Utilities | 7.17 | 10 | -1.65 | -16.82% |
| MUX | McEwen Mining | | Materials | 10.92 | 51 | -1.71 | 51.46% |
| UGP | Ultrapar Participacoes | | Energy | 5.04 | 10 | -1.75 | -7.01% |
| MIST | Milestone | | Health Care | 1.67 | 54 | -1.76 | 0.00% |
| AMX | America Movil | | Technology | 18.31 | 61 | -1.77 | -1.13% |
| MELI | MercadoLibre | | Services & Goods | 1370.00 | 35 | -1.79 | -12.82% |
| RPTX | Repare | | Health Care | 3.30 | 42 | -1.79 | -54.79% |
| CX | CEMEX S.A.B. | | Industrials | 8.12 | 25 | -1.81 | 4.77% |
| VTMX | Vesta Financials | | Financials | 35.78 | 32 | -1.87 | -10.02% |
| ASTL | Algoma Steel | | Materials | 7.72 | 28 | -1.97 | -22.60% |
| ARCO | Arcos Dorados | | Services & Goods | 10.93 | 45 | -1.97 | -13.87% |
| SVM | Silvercorp Metals | | Materials | 3.47 | 36 | -1.98 | 31.94% |
| TV | Grupo Televisa | | Services & Goods | 2.94 | 42 | -2.00 | -11.98% |
| ELP | Companhia Paranaense | | Utilities | 7.07 | 17 | -2.21 | -16.63% |
| VTRU | Vitru | | Consumer Staples | 13.04 | 35 | -2.25 | -17.57% |
| NU | Nu | | Financials | 10.67 | 58 | -2.29 | 27.94% |
| ASAI | Sendas Distribuidora | | Consumer Staples | 13.09 | 32 | -2.31 | -5.11% |
| TMQ | Trilogy Metals | | Materials | 0.41 | 25 | -2.31 | -4.65% |
| TEO | Telecom Argentina | | Technology | 7.62 | 42 | -2.31 | 6.57% |
| SHOP | Shopify | | Technology | 72.26 | 49 | -2.36 | -7.24% |
| AMBI | Ambipar Emergency | | Industrials | 4.12 | 17 | -2.37 | -47.58% |
| BLDP | Ballard Power | | Industrials | 2.54 | 15 | -2.49 | -31.22% |
| To view more stocks, click on Next / Previous arrows or select different range: 0 - 25 , 25 - 50 , 50 - 75 , 75 - 100 , 100 - 125 , 125 - 150 , 150 - 175 , 175 - 200 , 200 - 225 | ||
 | Click To Change The Sort Order: By Market Cap or Company Size Performance: Year-to-date, Week and Day |  |
| Detailed Overview Of Latin America Stocks |
| Latin America Technical Overview, Leaders & Laggards, Top Latin America ETF Funds & Detailed Latin America Stocks List, Charts, Trends & More |
| Latin America: Technical Analysis, Trends & YTD Performance | |
 ILF Weekly Chart |
|
| Long Term Trend: Not Good | |
| Medium Term Trend: Not Good | |
 ILF Daily Chart |
|
| Short Term Trend: Very Good | |
| Overall Trend Score: 25 | |
| YTD Performance: -6.02% | |
| **Trend Scores & Views Are Only For Educational Purposes And Not For Investing | |
| 12Stocks.com: Investing in Latin America Index using Exchange Traded Funds | |
|
The following table shows list of key exchange traded funds (ETF) that
help investors play Latin America stock market. For detailed view, check out our ETF Funds section of our website. Quick View: Move mouse or cursor over ETF symbol (ticker) to view short-term technical chart and over ETF name to view long term chart. Click on ticker or stock name for detailed view. Click on to add stock symbol to your watchlist and to view watchlist. |
12Stocks.com List of ETFs that track Latin America Index
| Ticker | ETF Name | Watchlist | Recent Price | Market Intelligence Score | Change % | Week % | Year-to-date % |
| ILF | Latin America 40 | | 27.31 | 25 | -0.65 | 0.89 | -6.02% |
| EWC | Canada | | 37.36 | 61 | -0.90 | 0.67 | 1.85% |
| FLN | Latin America AlphaDEX | | 19.64 | 31 | -0.15 | 2.16 | -5.56% |
| EWZ | Brazil | | 30.99 | 49 | -0.55 | 0.81 | -11.36% |
| EWW | Mexico | | 65.77 | 25 | -1.08 | 1.36 | -3.07% |
| ARGT | Argentina | | 55.26 | 71 | -1.04 | 3.35 | 7.64% |
| EWZS | Brazil Small-Cap | | 13.17 | 17 | -0.75 | 1.31 | -12.55% |
| BRF | Brazil Small-Cap | | 15.02 | 10 | -0.46 | 1.08 | -14.6% |
| BZQ | Short Brazil | | 12.49 | 74 | 0.85 | -1.9 | 24.53% |
| BRZU | Brazil Bull 3X | | 78.17 | 42 | -1.03 | 1.78 | -24.02% |
| FBZ | Brazil AlphaDEX | | 11.41 | 17 | 0.53 | 1.51 | -6.64% |
| 12Stocks.com: Charts, Trends, Fundamental Data and Performances of Latin America Stocks | |
|
We now take in-depth look at all Latin America stocks including charts, multi-period performances and overall trends (as measured by market intelligence score). One can sort Latin America stocks (click link to choose) by Daily, Weekly and by Year-to-Date performances. Also, one can sort by size of the company or by market capitalization. |
| Select Your Default Chart Type: | |||||
| |||||
| Click on stock symbol or name for detailed view. Click on to add stock symbol to your watchlist and to view watchlist. Quick View: Move mouse or cursor over "Daily" to quickly view daily technical stock chart and over "Weekly" to view weekly technical stock chart. | |||||

 | VET Vermilion Energy Inc. |
| Sector: Energy | |
| SubSector: Oil & Gas Drilling & Exploration | |
| MarketCap: 335.839 Millions | |
| Recent Price: 11.83 Market Intelligence Score: 61 | |
| Day Percent Change: -1.42% Day Change: -0.17 | |
| Week Change: -0.25% Year-to-date Change: -1.9% | |
| VET Links: Profile News Message Board | |
| Charts:- Daily , Weekly | |
| Add VET to Watchlist: View: Get Complete VET Trend Analysis ➞ | |
 | SID Companhia Siderurgica Nacional |
| Sector: Materials | |
| SubSector: Steel & Iron | |
| MarketCap: 2087.58 Millions | |
| Recent Price: 2.78 Market Intelligence Score: 27 | |
| Day Percent Change: -1.42% Day Change: -0.04 | |
| Week Change: -1.42% Year-to-date Change: -29.3% | |
| SID Links: Profile News Message Board | |
| Charts:- Daily , Weekly | |
| Add SID to Watchlist: View: Get Complete SID Trend Analysis ➞ | |
 | THTX Theratechnologies Inc. |
| Sector: Health Care | |
| SubSector: Drugs - Generic | |
| MarketCap: 123.185 Millions | |
| Recent Price: 1.35 Market Intelligence Score: 35 | |
| Day Percent Change: -1.46% Day Change: -0.02 | |
| Week Change: 4.65% Year-to-date Change: -16.7% | |
| THTX Links: Profile News Message Board | |
| Charts:- Daily , Weekly | |
| Add THTX to Watchlist: View: Get Complete THTX Trend Analysis ➞ | |
 | EBR Centrais Eletricas Brasileiras S.A. - Eletrobras |
| Sector: Utilities | |
| SubSector: Electric Utilities | |
| MarketCap: 5459.84 Millions | |
| Recent Price: 7.17 Market Intelligence Score: 10 | |
| Day Percent Change: -1.65% Day Change: -0.12 | |
| Week Change: -2.32% Year-to-date Change: -16.8% | |
| EBR Links: Profile News Message Board | |
| Charts:- Daily , Weekly | |
| Add EBR to Watchlist: View: Get Complete EBR Trend Analysis ➞ | |
 | MUX McEwen Mining Inc. |
| Sector: Materials | |
| SubSector: Gold | |
| MarketCap: 264.819 Millions | |
| Recent Price: 10.92 Market Intelligence Score: 51 | |
| Day Percent Change: -1.71% Day Change: -0.19 | |
| Week Change: -2.67% Year-to-date Change: 51.5% | |
| MUX Links: Profile News Message Board | |
| Charts:- Daily , Weekly | |
| Add MUX to Watchlist: View: Get Complete MUX Trend Analysis ➞ | |
 | UGP Ultrapar Participacoes S.A. |
| Sector: Energy | |
| SubSector: Oil & Gas Refining & Marketing | |
| MarketCap: 3473.54 Millions | |
| Recent Price: 5.04 Market Intelligence Score: 10 | |
| Day Percent Change: -1.75% Day Change: -0.09 | |
| Week Change: -2.14% Year-to-date Change: -7.0% | |
| UGP Links: Profile News Message Board | |
| Charts:- Daily , Weekly | |
| Add UGP to Watchlist: View: Get Complete UGP Trend Analysis ➞ | |
 | MIST Milestone Pharmaceuticals Inc. |
| Sector: Health Care | |
| SubSector: Biotechnology | |
| MarketCap: 342.685 Millions | |
| Recent Price: 1.67 Market Intelligence Score: 54 | |
| Day Percent Change: -1.76% Day Change: -0.03 | |
| Week Change: 1.83% Year-to-date Change: 0.0% | |
| MIST Links: Profile News Message Board | |
| Charts:- Daily , Weekly | |
| Add MIST to Watchlist: View: Get Complete MIST Trend Analysis ➞ | |
 | AMX America Movil, S.A.B. de C.V. |
| Sector: Technology | |
| SubSector: Wireless Communications | |
| MarketCap: 44726.6 Millions | |
| Recent Price: 18.31 Market Intelligence Score: 61 | |
| Day Percent Change: -1.77% Day Change: -0.33 | |
| Week Change: 0.27% Year-to-date Change: -1.1% | |
| AMX Links: Profile News Message Board | |
| Charts:- Daily , Weekly | |
| Add AMX to Watchlist: View: Get Complete AMX Trend Analysis ➞ | |
 | MELI MercadoLibre, Inc. |
| Sector: Services & Goods | |
| SubSector: Catalog & Mail Order Houses | |
| MarketCap: 24695.5 Millions | |
| Recent Price: 1370.00 Market Intelligence Score: 35 | |
| Day Percent Change: -1.79% Day Change: -25.00 | |
| Week Change: 1% Year-to-date Change: -12.8% | |
| MELI Links: Profile News Message Board | |
| Charts:- Daily , Weekly | |
| Add MELI to Watchlist: View: Get Complete MELI Trend Analysis ➞ | |
 | RPTX Repare Therapeutics Inc. |
| Sector: Health Care | |
| SubSector: Biotechnology | |
| MarketCap: 13687 Millions | |
| Recent Price: 3.30 Market Intelligence Score: 42 | |
| Day Percent Change: -1.79% Day Change: -0.06 | |
| Week Change: 9.27% Year-to-date Change: -54.8% | |
| RPTX Links: Profile News Message Board | |
| Charts:- Daily , Weekly | |
| Add RPTX to Watchlist: View: Get Complete RPTX Trend Analysis ➞ | |
 | CX CEMEX, S.A.B. de C.V. |
| Sector: Industrials | |
| SubSector: Cement | |
| MarketCap: 2948.23 Millions | |
| Recent Price: 8.12 Market Intelligence Score: 25 | |
| Day Percent Change: -1.81% Day Change: -0.15 | |
| Week Change: 1.63% Year-to-date Change: 4.8% | |
| CX Links: Profile News Message Board | |
| Charts:- Daily , Weekly | |
| Add CX to Watchlist: View: Get Complete CX Trend Analysis ➞ | |
 | VTMX Vesta Financials Corp SAB de CV |
| Sector: Financials | |
| SubSector: REIT - Industrial | |
| MarketCap: 2270 Millions | |
| Recent Price: 35.78 Market Intelligence Score: 32 | |
| Day Percent Change: -1.87% Day Change: -0.68 | |
| Week Change: 1.53% Year-to-date Change: -10.0% | |
| VTMX Links: Profile News Message Board | |
| Charts:- Daily , Weekly | |
| Add VTMX to Watchlist: View: Get Complete VTMX Trend Analysis ➞ | |
 | ASTL Algoma Steel Group Inc. |
| Sector: Materials | |
| SubSector: Steel | |
| MarketCap: 731 Millions | |
| Recent Price: 7.72 Market Intelligence Score: 28 | |
| Day Percent Change: -1.97% Day Change: -0.16 | |
| Week Change: -0.96% Year-to-date Change: -22.6% | |
| ASTL Links: Profile News Message Board | |
| Charts:- Daily , Weekly | |
| Add ASTL to Watchlist: View: Get Complete ASTL Trend Analysis ➞ | |
 | ARCO Arcos Dorados Holdings Inc. |
| Sector: Services & Goods | |
| SubSector: Restaurants | |
| MarketCap: 778.87 Millions | |
| Recent Price: 10.93 Market Intelligence Score: 45 | |
| Day Percent Change: -1.97% Day Change: -0.22 | |
| Week Change: 0.28% Year-to-date Change: -13.9% | |
| ARCO Links: Profile News Message Board | |
| Charts:- Daily , Weekly | |
| Add ARCO to Watchlist: View: Get Complete ARCO Trend Analysis ➞ | |
 | SVM Silvercorp Metals Inc. |
| Sector: Materials | |
| SubSector: Silver | |
| MarketCap: 504.056 Millions | |
| Recent Price: 3.47 Market Intelligence Score: 36 | |
| Day Percent Change: -1.98% Day Change: -0.07 | |
| Week Change: -2.8% Year-to-date Change: 31.9% | |
| SVM Links: Profile News Message Board | |
| Charts:- Daily , Weekly | |
| Add SVM to Watchlist: View: Get Complete SVM Trend Analysis ➞ | |
 | TV Grupo Televisa, S.A.B. |
| Sector: Services & Goods | |
| SubSector: Broadcasting - TV | |
| MarketCap: 3740.43 Millions | |
| Recent Price: 2.94 Market Intelligence Score: 42 | |
| Day Percent Change: -2.00% Day Change: -0.06 | |
| Week Change: 4.63% Year-to-date Change: -12.0% | |
| TV Links: Profile News Message Board | |
| Charts:- Daily , Weekly | |
| Add TV to Watchlist: View: Get Complete TV Trend Analysis ➞ | |
 | ELP Companhia Paranaense de Energia - COPEL |
| Sector: Utilities | |
| SubSector: Electric Utilities | |
| MarketCap: 3352.84 Millions | |
| Recent Price: 7.07 Market Intelligence Score: 17 | |
| Day Percent Change: -2.21% Day Change: -0.16 | |
| Week Change: -3.28% Year-to-date Change: -16.6% | |
| ELP Links: Profile News Message Board | |
| Charts:- Daily , Weekly | |
| Add ELP to Watchlist: View: Get Complete ELP Trend Analysis ➞ | |
 | VTRU Vitru Limited |
| Sector: Consumer Staples | |
| SubSector: Education & Training Services | |
| MarketCap: 33347 Millions | |
| Recent Price: 13.04 Market Intelligence Score: 35 | |
| Day Percent Change: -2.25% Day Change: -0.30 | |
| Week Change: 5.76% Year-to-date Change: -17.6% | |
| VTRU Links: Profile News Message Board | |
| Charts:- Daily , Weekly | |
| Add VTRU to Watchlist: View: Get Complete VTRU Trend Analysis ➞ | |
 | NU Nu Holdings Ltd. |
| Sector: Financials | |
| SubSector: Banks - Diversified | |
| MarketCap: 37240 Millions | |
| Recent Price: 10.67 Market Intelligence Score: 58 | |
| Day Percent Change: -2.29% Day Change: -0.25 | |
| Week Change: 1.81% Year-to-date Change: 27.9% | |
| NU Links: Profile News Message Board | |
| Charts:- Daily , Weekly | |
| Add NU to Watchlist: View: Get Complete NU Trend Analysis ➞ | |
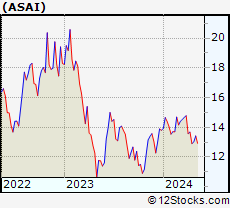 | ASAI Sendas Distribuidora S.A. |
| Sector: Consumer Staples | |
| SubSector: Grocery Stores | |
| MarketCap: 3790 Millions | |
| Recent Price: 13.09 Market Intelligence Score: 32 | |
| Day Percent Change: -2.31% Day Change: -0.31 | |
| Week Change: 1.47% Year-to-date Change: -5.1% | |
| ASAI Links: Profile News Message Board | |
| Charts:- Daily , Weekly | |
| Add ASAI to Watchlist: View: Get Complete ASAI Trend Analysis ➞ | |
 | TMQ Trilogy Metals Inc. |
| Sector: Materials | |
| SubSector: Industrial Metals & Minerals | |
| MarketCap: 151.21 Millions | |
| Recent Price: 0.41 Market Intelligence Score: 25 | |
| Day Percent Change: -2.31% Day Change: -0.01 | |
| Week Change: 3.93% Year-to-date Change: -4.7% | |
| TMQ Links: Profile News Message Board | |
| Charts:- Daily , Weekly | |
| Add TMQ to Watchlist: View: Get Complete TMQ Trend Analysis ➞ | |
 | TEO Telecom Argentina S.A. |
| Sector: Technology | |
| SubSector: Diversified Communication Services | |
| MarketCap: 1508.64 Millions | |
| Recent Price: 7.62 Market Intelligence Score: 42 | |
| Day Percent Change: -2.31% Day Change: -0.18 | |
| Week Change: 6.13% Year-to-date Change: 6.6% | |
| TEO Links: Profile News Message Board | |
| Charts:- Daily , Weekly | |
| Add TEO to Watchlist: View: Get Complete TEO Trend Analysis ➞ | |
 | SHOP Shopify Inc. |
| Sector: Technology | |
| SubSector: Application Software | |
| MarketCap: 45164.2 Millions | |
| Recent Price: 72.26 Market Intelligence Score: 49 | |
| Day Percent Change: -2.36% Day Change: -1.75 | |
| Week Change: 3.72% Year-to-date Change: -7.2% | |
| SHOP Links: Profile News Message Board | |
| Charts:- Daily , Weekly | |
| Add SHOP to Watchlist: View: Get Complete SHOP Trend Analysis ➞ | |
 | AMBI Ambipar Emergency Response |
| Sector: Industrials | |
| SubSector: Waste Management | |
| MarketCap: 462 Millions | |
| Recent Price: 4.12 Market Intelligence Score: 17 | |
| Day Percent Change: -2.37% Day Change: -0.10 | |
| Week Change: -15.57% Year-to-date Change: -47.6% | |
| AMBI Links: Profile News Message Board | |
| Charts:- Daily , Weekly | |
| Add AMBI to Watchlist: View: Get Complete AMBI Trend Analysis ➞ | |
 | BLDP Ballard Power Systems Inc. |
| Sector: Industrials | |
| SubSector: Industrial Electrical Equipment | |
| MarketCap: 2124.79 Millions | |
| Recent Price: 2.54 Market Intelligence Score: 15 | |
| Day Percent Change: -2.49% Day Change: -0.06 | |
| Week Change: -3.23% Year-to-date Change: -31.2% | |
| BLDP Links: Profile News Message Board | |
| Charts:- Daily , Weekly | |
| Add BLDP to Watchlist: View: Get Complete BLDP Trend Analysis ➞ | |
| To view more stocks, click on Next / Previous arrows or select different range: 0 - 25 , 25 - 50 , 50 - 75 , 75 - 100 , 100 - 125 , 125 - 150 , 150 - 175 , 175 - 200 , 200 - 225 | ||
| Click To Change The Sort Order: By Market Cap or Company Size Performance: Year-to-date, Week and Day | |
| Select Chart Type: | ||
 Best Stocks Today 12Stocks.com |
© 2024 12Stocks.com Terms & Conditions Privacy Contact Us
All Information Provided Only For Education And Not To Be Used For Investing or Trading. See Terms & Conditions


One More Thing ... Get Best Stocks Delivered Daily!
Never Ever Miss A Move With Our Top Ten Stocks Lists
Find Best Stocks In Any Market - Bull or Bear Market
Take A Peek At Our Top Ten Stocks Lists: Daily, Weekly, Year-to-Date & Top Trends
Find Best Stocks In Any Market - Bull or Bear Market
Take A Peek At Our Top Ten Stocks Lists: Daily, Weekly, Year-to-Date & Top Trends
Latin America Stocks With Best Up Trends [0-bearish to 100-bullish]: SilverCrest Metals[100], Controladora Vuela[100], SunOpta [100], IMAX [100], Grupo Aeroportuario[100], Descartes Systems[100], Grupo Aeroportuario[100], Mercer [93], Algonquin Power[93], Algonquin Power[93], Despegar.com [90]
Best Latin America Stocks Year-to-Date:
Aurora Cannabis[1411.97%], Fusion [122.92%], Canopy Growth[75.34%], D-Wave Quantum[72.1%], Banco Macro[70.66%], Grupo Financiero[68.49%], Banco BBVA[62.68%], McEwen Mining[51.46%], Celestica [50.61%], OrganiGram [47.33%], IAMGOLD [42.29%] Best Latin America Stocks This Week:
Canopy Growth[12.85%], Grupo Aeroportuario[12.81%], SunOpta [12.08%], Aurora Cannabis[11.46%], Controladora Vuela[11.28%], Grupo Aeroportuario[10.38%], Repare [9.27%], Central Puerto[8.43%], Celestica [8.27%], Grupo Aeroportuario[8.18%], Despegar.com [8.07%] Best Latin America Stocks Daily:
SilverCrest Metals[3.95%], AbCellera Biologics[3.64%], Seabridge Gold[3.62%], Despegar.com [3.03%], Mercer [2.51%], Controladora Vuela[2.36%], TELUS [2.36%], Tucows [2.16%], SunOpta [1.98%], SSR Mining[1.96%], Lion Electric[1.79%]